Ninety-two percent of electors surveyed said they were aware that a federal by-election took place in their riding. Awareness was higher among electors from the ridings of Oxford (97%) and Portage-Lisgar (96%) than among those from Calgary-Heritage (92%), Winnipeg South Centre (89%), and Notre-Dame-de-Grâce-Westmount (89%).
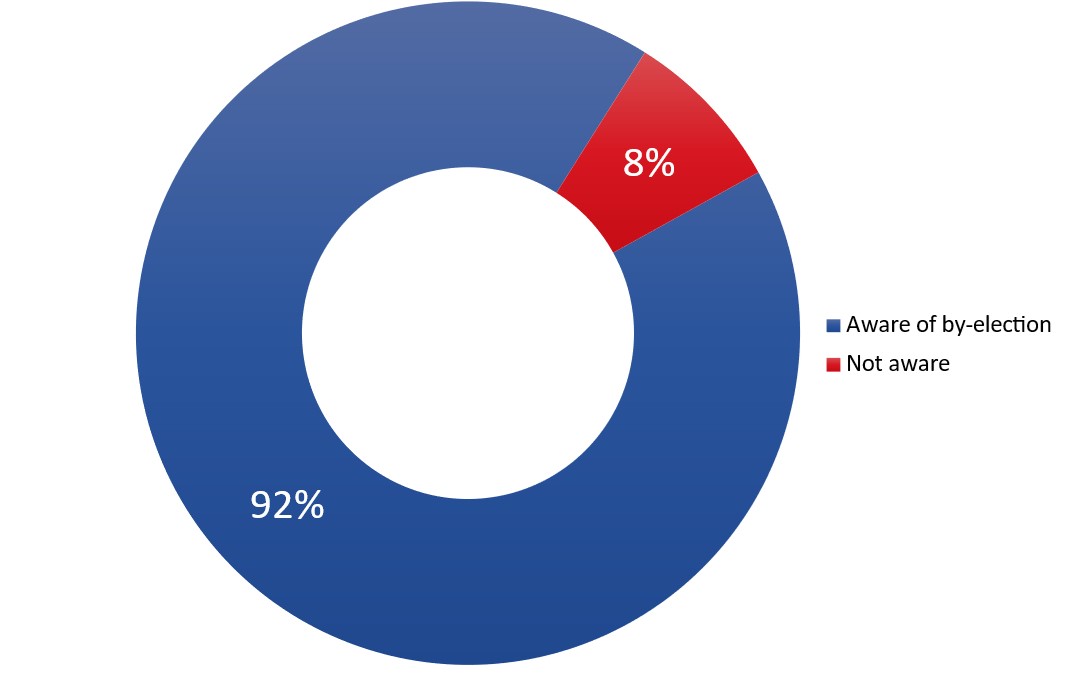
Q. Did you know that a federal by-election took place on June 19, 2023 / July 24, 2023, in your riding? Base: n=2,012; all respondents.
This pie chart shows the breakdown of answers. 92 percent said they were aware of the by-election. 8 percent said they were not aware.
Awareness of the by-election was lower among:
All respondents were asked to identify the current ways that electors can vote in a federal election. The vast majority (90%) identified voting in person at a polling station on election day, followed by voting at advance polls in person (66%) and voting by mail (50%). Eleven percent had the impression that it is possible to vote online.footnote 1All other responses were mentioned by smaller proportions as indicated in Figure 2.
While electors were similarly likely to mention voting on election day, awareness of the possibility of voting at advance polls was higher among electors from Calgary-Heritage (73%), Winnipeg South Centre (69%), and Notre-Dame-de-Grâce-Westmount (69%) than among those from the districts of Oxford and Portage-Lisgar (58% each). In addition, electors from Portage-Lisgar (39%) were less likely than electors from the other ridings to identify voting by mail as a current way to vote in a federal election (Calgary-Heritage: 59%; Winnipeg South Centre: 53%; Notre-Dame-de-Grâce-Westmount: 49%; and Oxford: 47%).
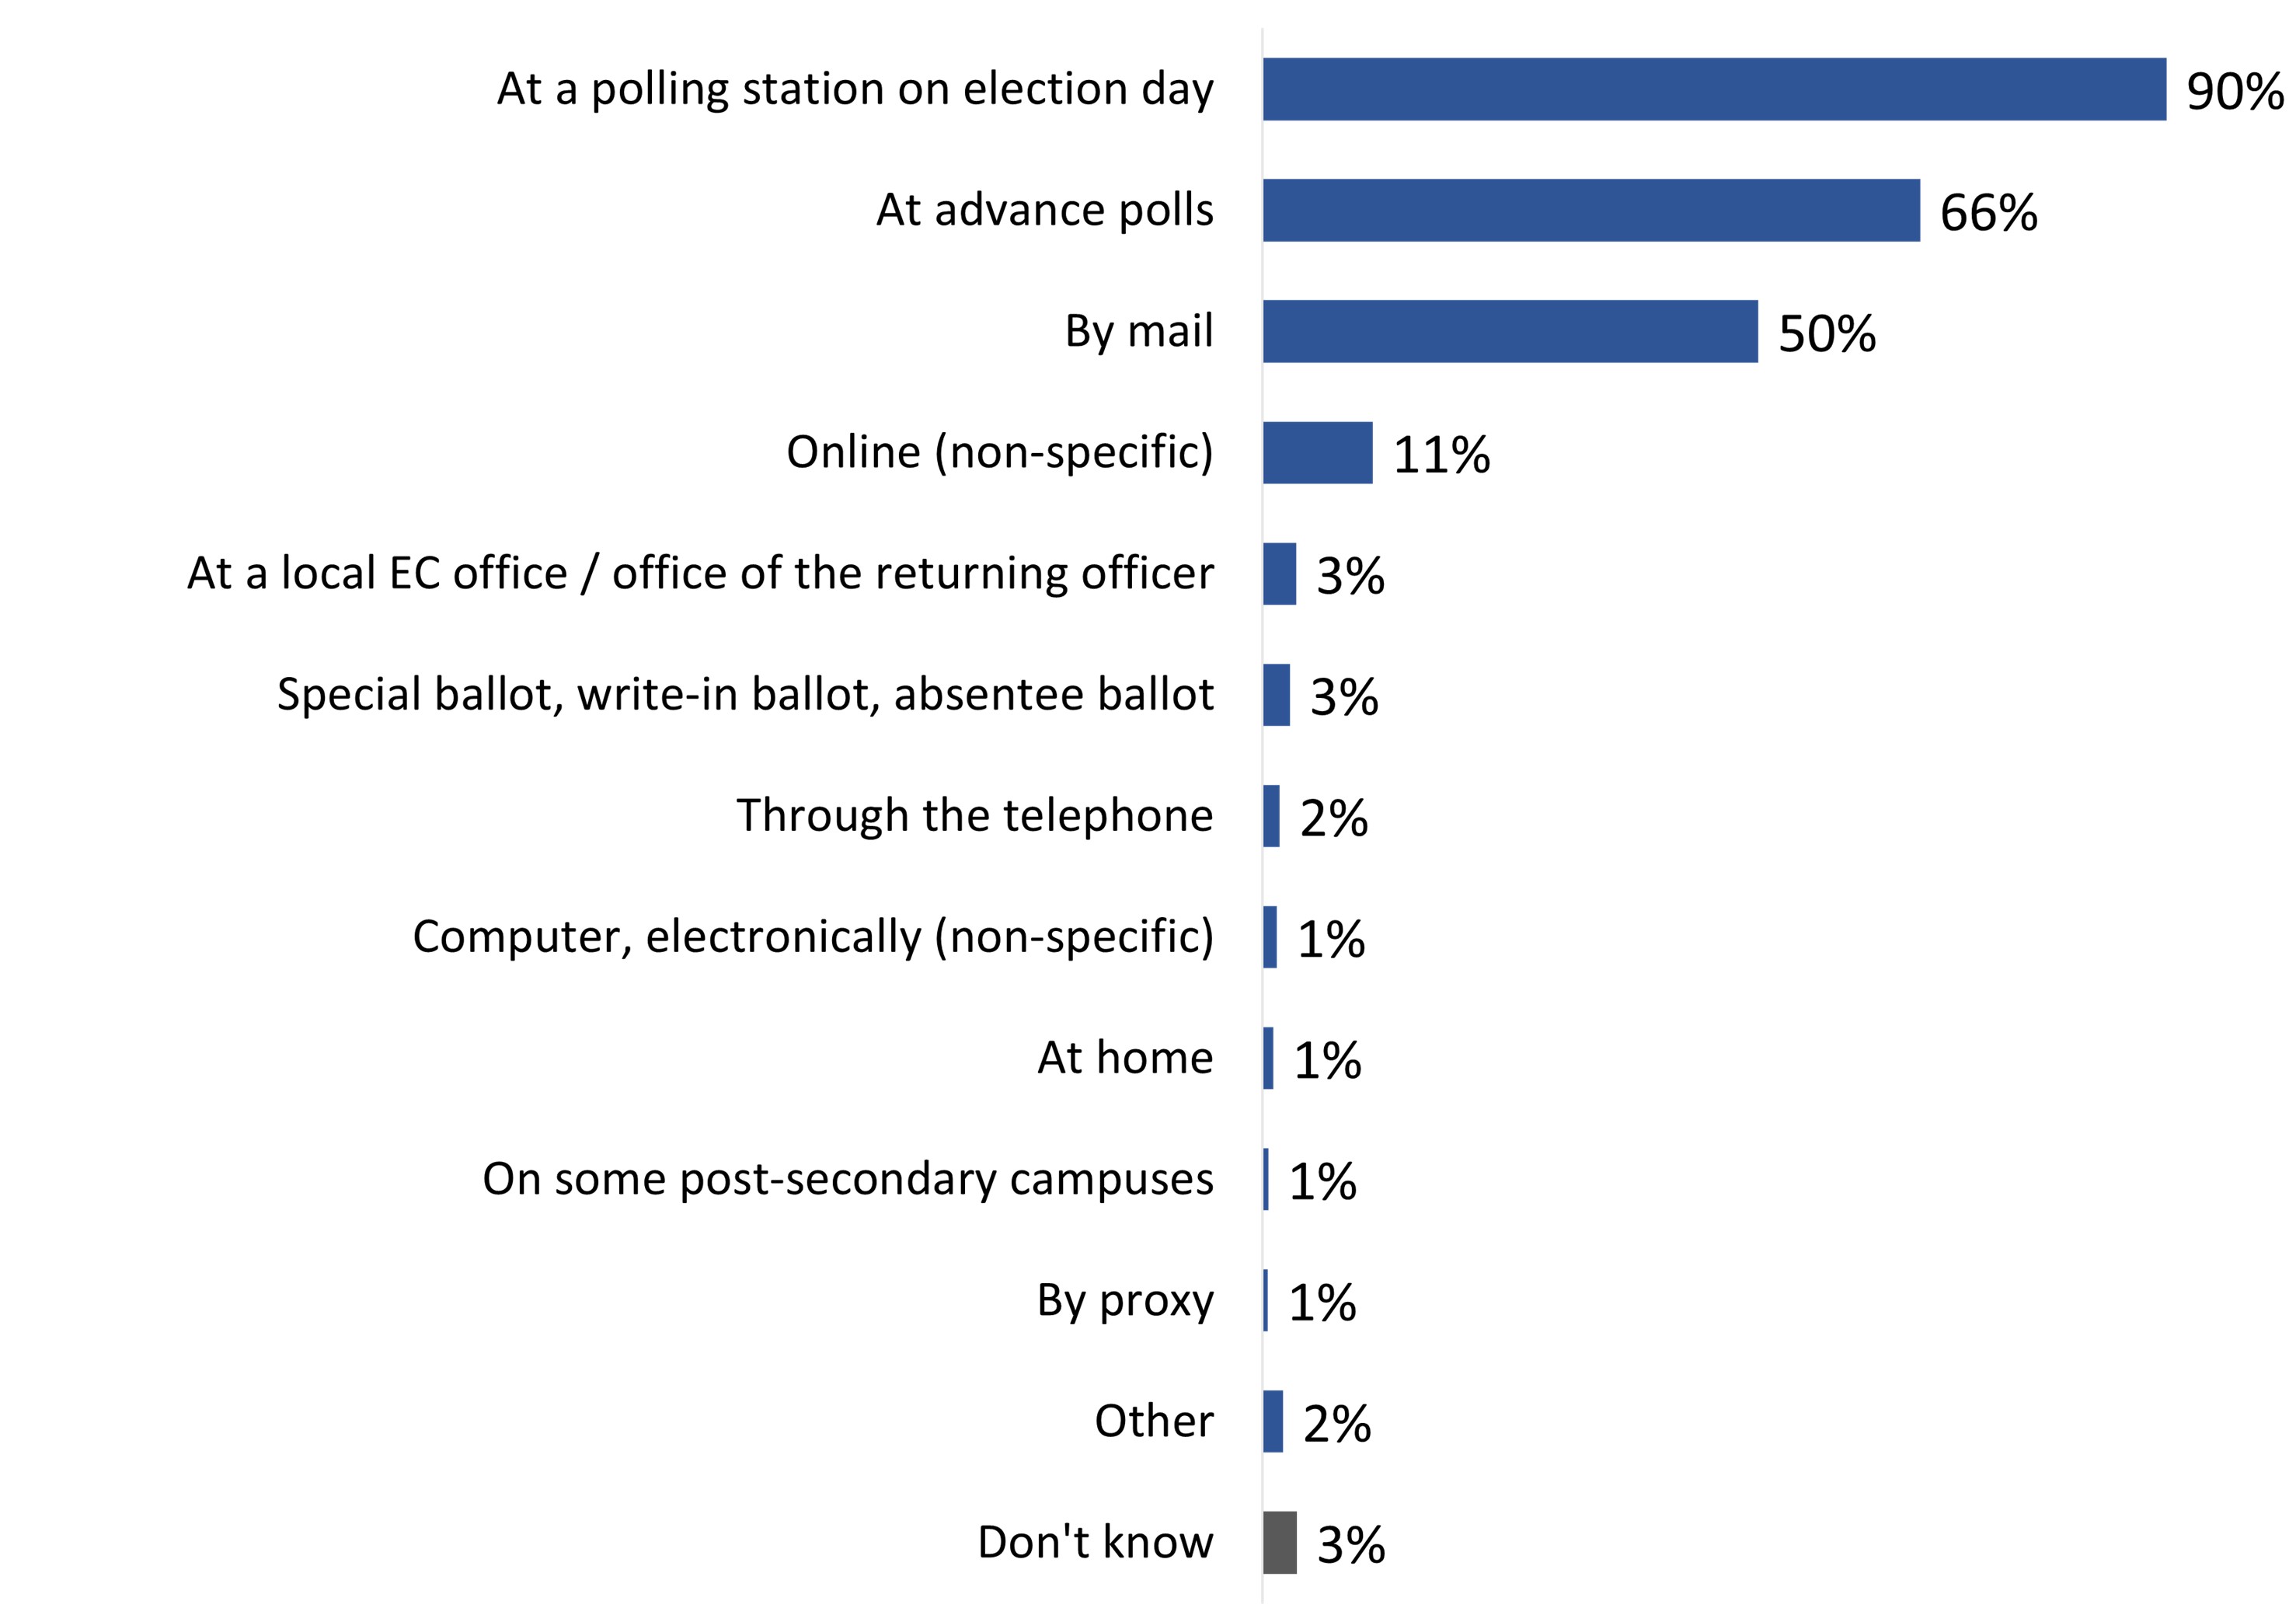
Q. To the best of your knowledge, what are the current ways that electors can vote in a federal election? (Multiple responses accepted). Base: n=1,922; all respondents who completed the survey by telephone.
This horizontal bar chart shows the percentage of respondents who knew they could vote at an advance polling station, at the location Elections Canada office, and by mail. The breakdown is as follows:
Total
Notable subgroup differences include the following:
In the by-elections, Elections Canada tested alternative ways to describe the main voting options compared to existing messages used in the last general election.footnote 2 In the survey, a split-sample experiment was conducted to compare respondents' impressions of each of the alternative messages versus the existing messages, in terms of whether the meaning of the voting option was clear to respondents, whether they would trust it as a secure and reliable way to vote, and whether it seemed liked an easy or convenient way to vote.
The following alternative messages were tested against the respective existing messages:
Large majorities agreed that voting "at your assigned polling station on election day or advance polling days" was clear in what it means (97%), would be trustworthy as a secure and reliable way to vote (97%), and seemed like an easy or convenient way to vote (94%), in proportions that were at least as favourable as they were for existing messages of voting "on election day" (96%, 95% and 89%, respectively) or "on advance polling days" (94%, 92% and 94%, respectively).

Values of less than 3% are not presented in the graph.
Q. Do you strongly agree, somewhat agree, somewhat disagree or strongly disagree with the following statements about voting? Base: n=2,012; all respondents. Messages were randomly assigned to respondents, with approximately half being presented the messages about voting "at your assigned polling station on election day or advance polling days" and approximately one-quarter of respondents each receiving the "on election day" or "on advance polling days" messages.
This horizontal bar chart shows the levels of agreement with statements regarding clarity, trust, and ease/convenience regarding polling stations. The breakdown is as follows:
Total
There were no significant differences between English and French respondents in agreeing that all messages for voting at the polls were clear.
Voting "at the office of the returning officer" was less often understood and less often gave the impression of being a trustworthy and easy way to vote than "at a local Elections Canada office"
Fewer than half (42%) of respondents agreed either strongly or somewhat that the meaning of voting "at the office of the returning officer" was clear; 44% disagreed and 14% said they did not know. In contrast, a large majority (77%) agreed that they were clear on the meaning of voting "at a local Elections Canada office;" 17% disagreed and 6% said they did not know.
Uncertainty about the meaning of voting "at the office of the returning officer" may have contributed to more negative or unsure impressions about the security and reliability and the ease and convenience of this voting method: Only 62% of respondents agreed that they would trust voting "at the office of the returning officer" as secure and reliable; 20% disagreed and another 17% said they did not know. In contrast, 91% agreed that they would trust voting "at a local Elections Canada office;" only 5% disagreed and 4% said they did not know.
Similarly, only 47% agreed that voting "at the office of the returning officer" seemed like an easy or convenient way to vote; 32% disagreed and another 21% said they did not know. In contrast, 78% agreed that voting "at a local Elections Canada office" seemed easy or convenient; 16% disagreed and 6% said they did not know.
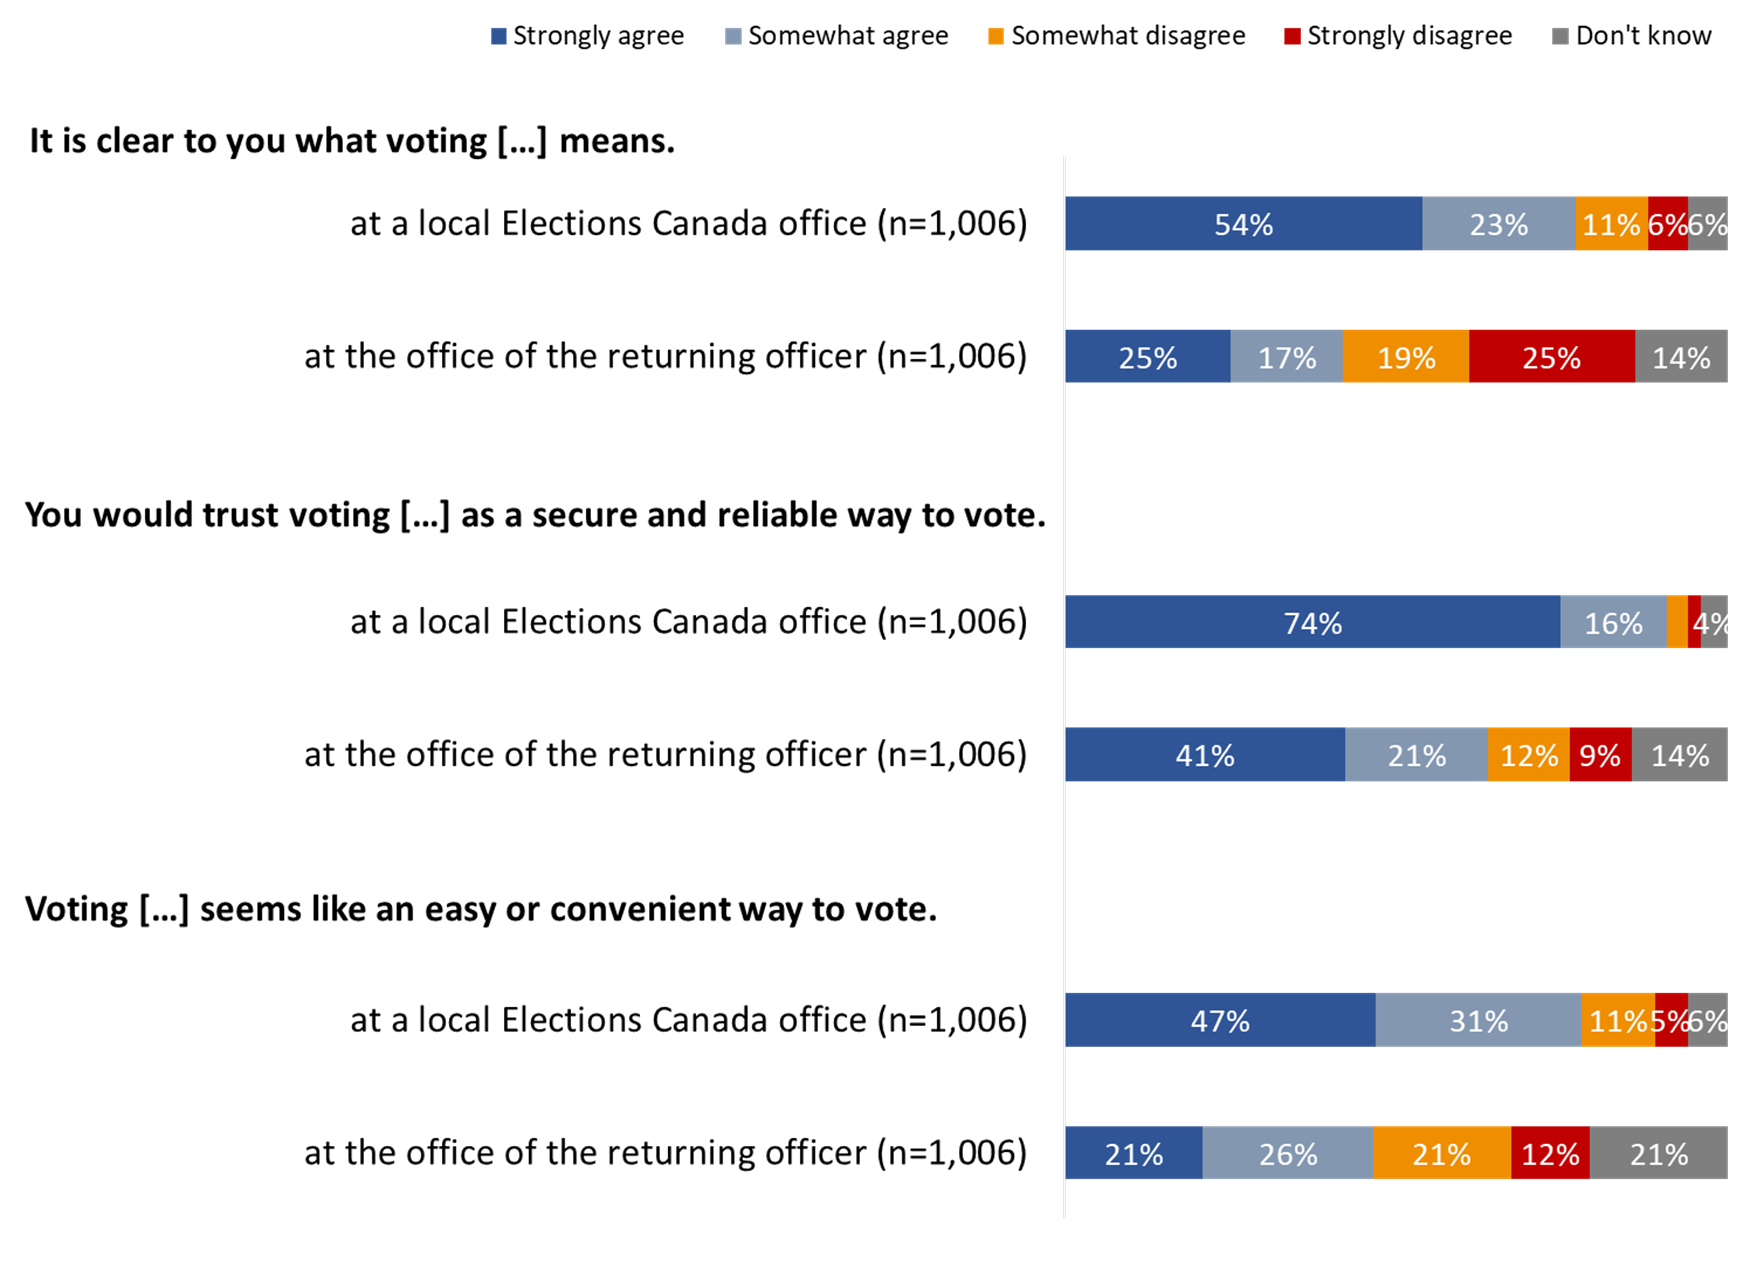
Values of less than 4% are not presented in the graph.
Q. Do you strongly agree, somewhat agree, somewhat disagree or strongly disagree with the following statements about voting? Base: n=2,012; all respondents. Messages were randomly assigned to respondents, with approximately half each being presented the messages about voting "at a local Elections Canada office" and "at the office of the returning officer".
This horizontal bar chart shows the levels of agreement with statements regarding clarity, trust, and ease/convenience regarding voting at a local Elections Canada office or at the office of the returning officer. The breakdown is as follows:
Total
French respondents were more likely to agree that the French equivalents for voting "at the office of the returning officer" (52%) and "at a local Elections Canada office" (88%) were clear, compared with English respondents (40% and 75%, respectively). However, French respondents, like English respondents, still agreed that the existing message was clear more often than they agreed that the alternative message was clear.
Those who disagreed that the meaning of voting "at a local Elections Canada office" or "at the office of the returning officer" was clear were asked to specify what they found unclear. Among those who did not find the message about the office of the returning officer to be clear (n=417), the majority (61%) attributed this to not understanding the term 'returning officer.' Among those who did not find the message about voting at the local office of Elections Canada to be clear (n=167), approximately three in 10 said they are not familiar with this office (32%) or were not clear on when, where, or how electors can vote this way (29%). The full set of reasons offered can be found in Figure 5.
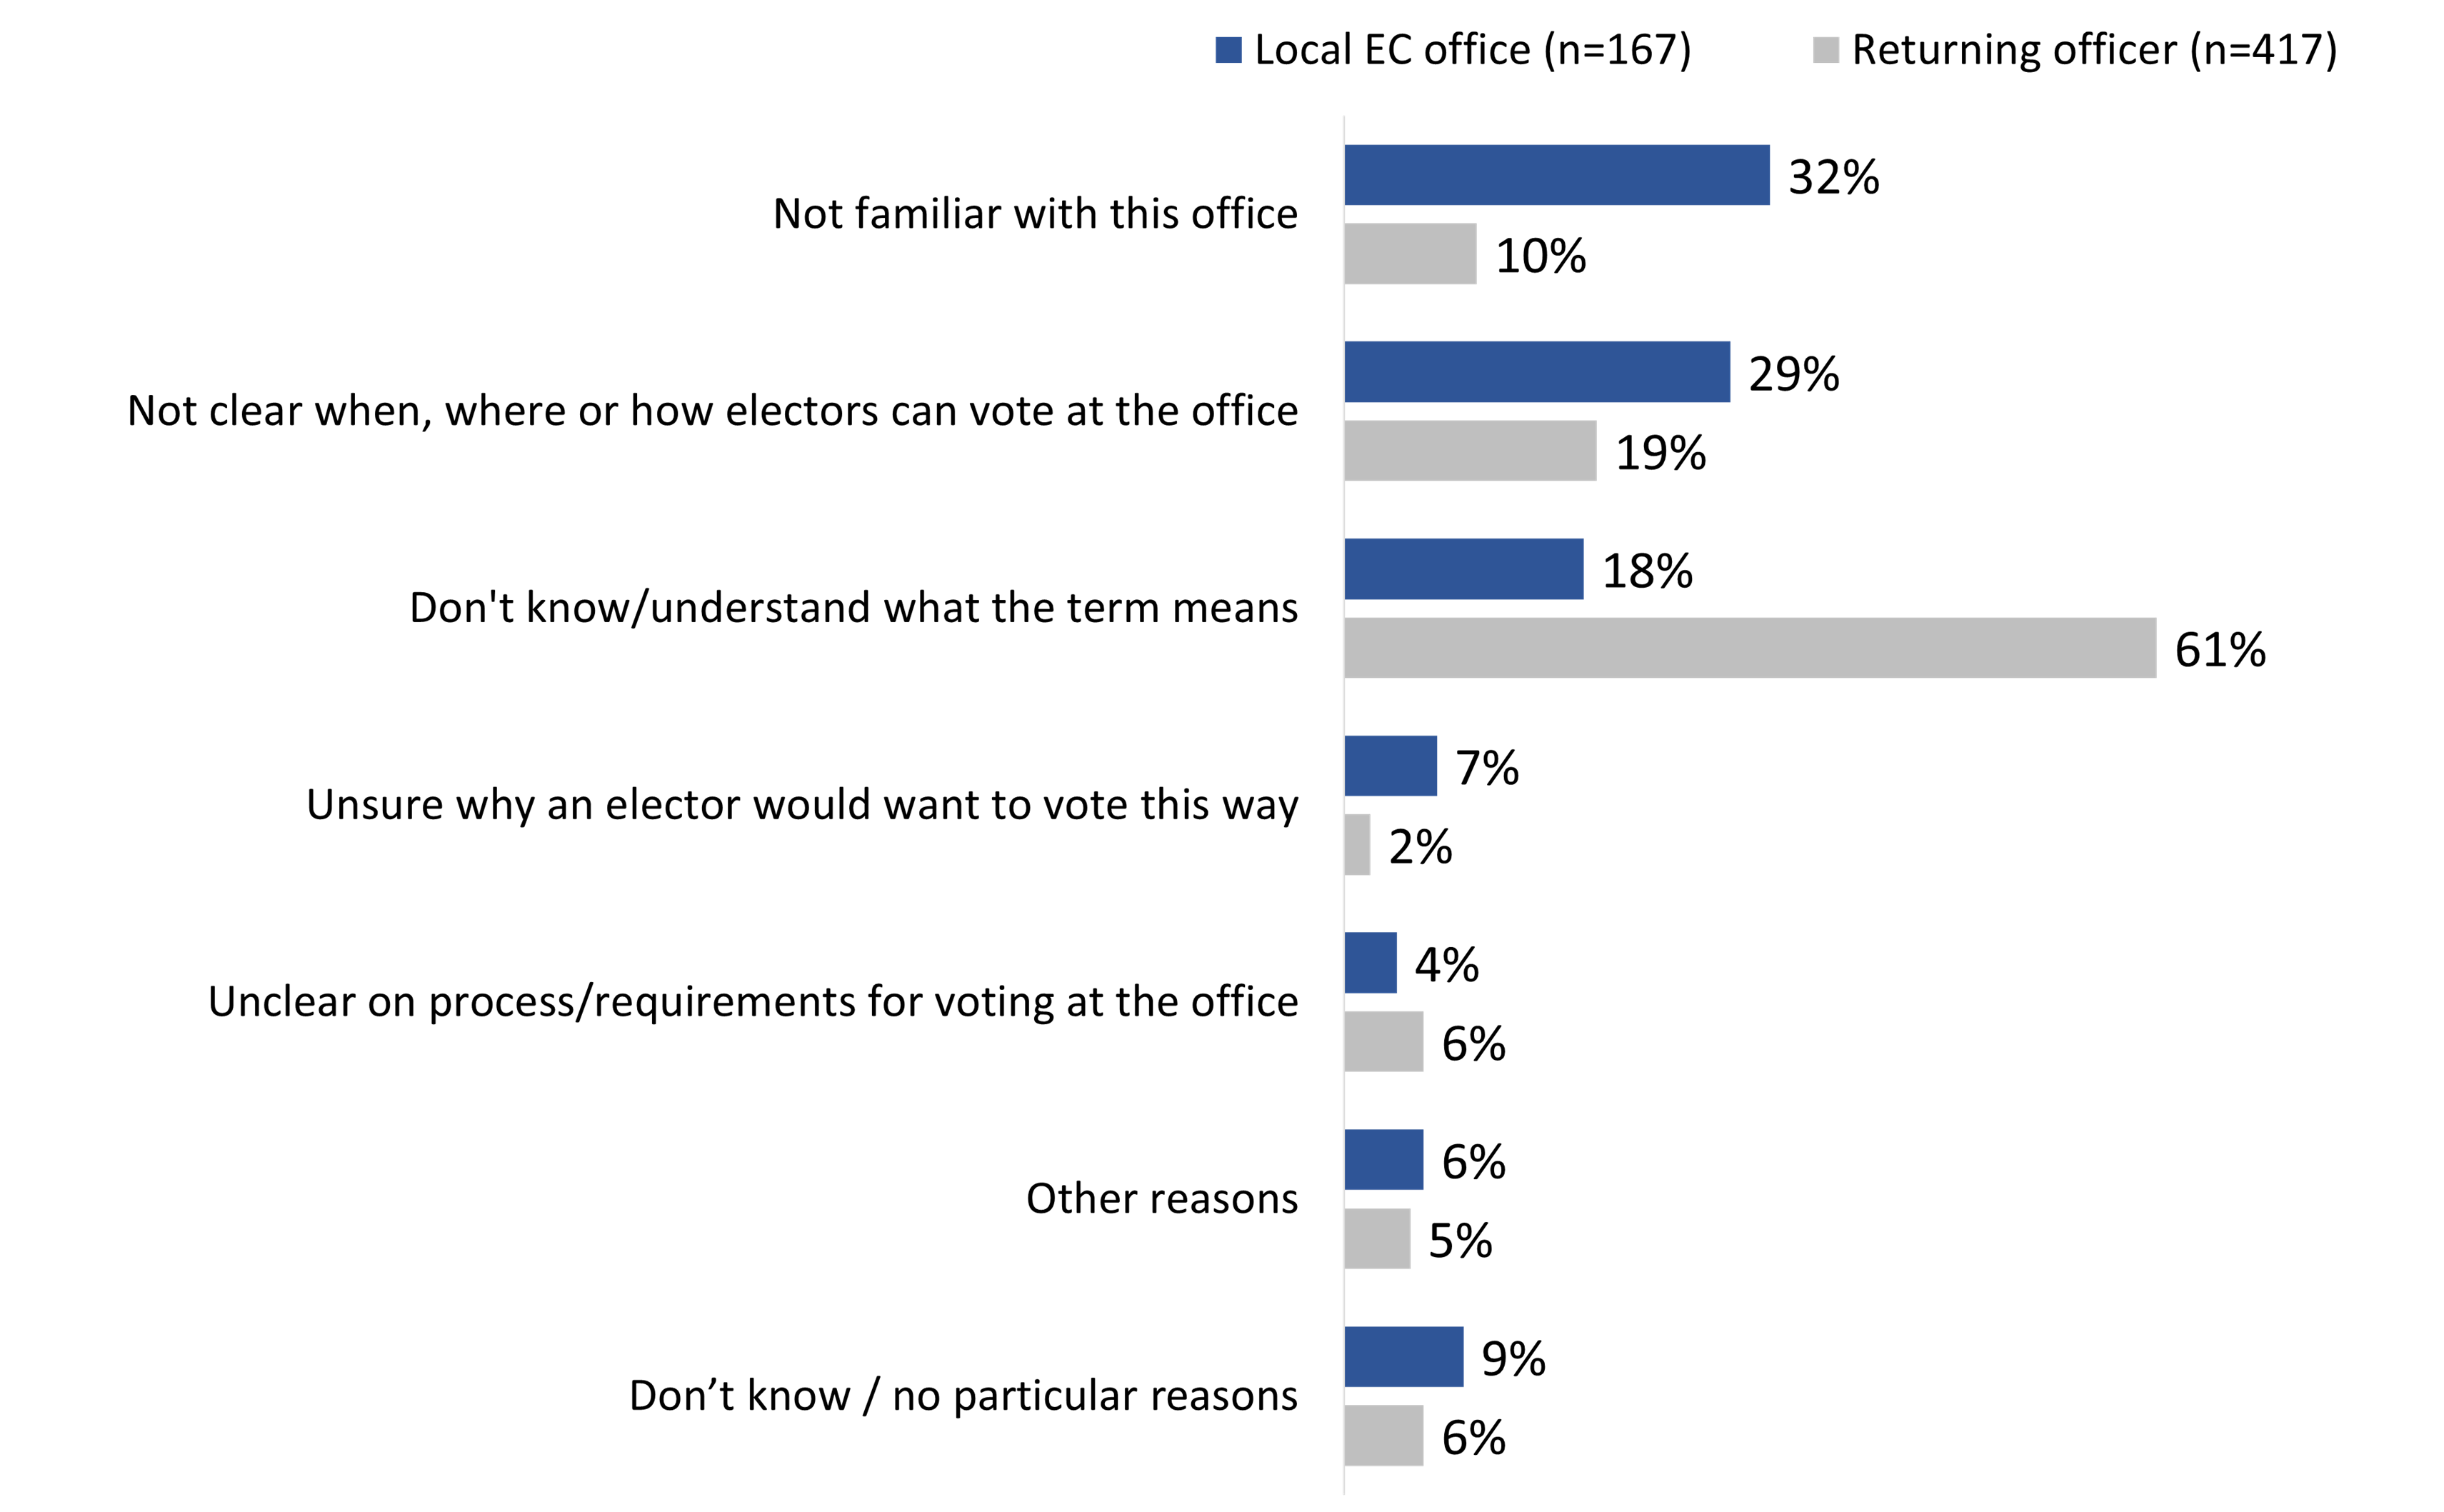
Q. What do you find unclear about the meaning of voting [at the office of the returning officer/at a local Elections Canada office]? (Multiple responses accepted) Base: those who somewhat or strongly disagreed with the statement: It is clear to you what voting [at the office of the returning officer/at a local Elections Canada office] means. [Nr: 1%; local EC office]
This horizontal chart shows the different reasons why respondents who disagreed that the message about the office of the returning officer was clear believed so. The breakdown is as follows:
Total
Compared to voting by mail, fewer electors have a clear understanding of what it means to vote by special ballot and have the impression that this is a convenient way to vote
Fewer than half (44%) of respondents agreed either strongly or somewhat that the meaning of voting "by special ballot" was clear; 40% disagreed and 16% said they did not know. In contrast, a large majority (87%) agreed that they were clear on the meaning of voting "by mail;" 11% disagreed and 2% said they did not know.
Like voting "at the office of the returning officer," uncertainty toward the meaning of voting "by special ballot" may have contributed to more negative or unsure impressions about the security and reliability and the ease and convenience of this voting method. While respondents agreed in nearly similar proportions that they would trust voting either "by special ballot" (58%) or "by mail" (63%), respondents were much more likely to say they did not know if they would trust voting "by special ballot" (20%) compared with "by mail" (1%). Respondents were much less likely to agree that voting "by special ballot" seems like it would be easy or convenient (53%) compared with voting "by mail" (75%), and they were much more likely to say they did not know whether voting by "special ballot would be easy or convenient (25%) compared with voting "by mail" (2%).
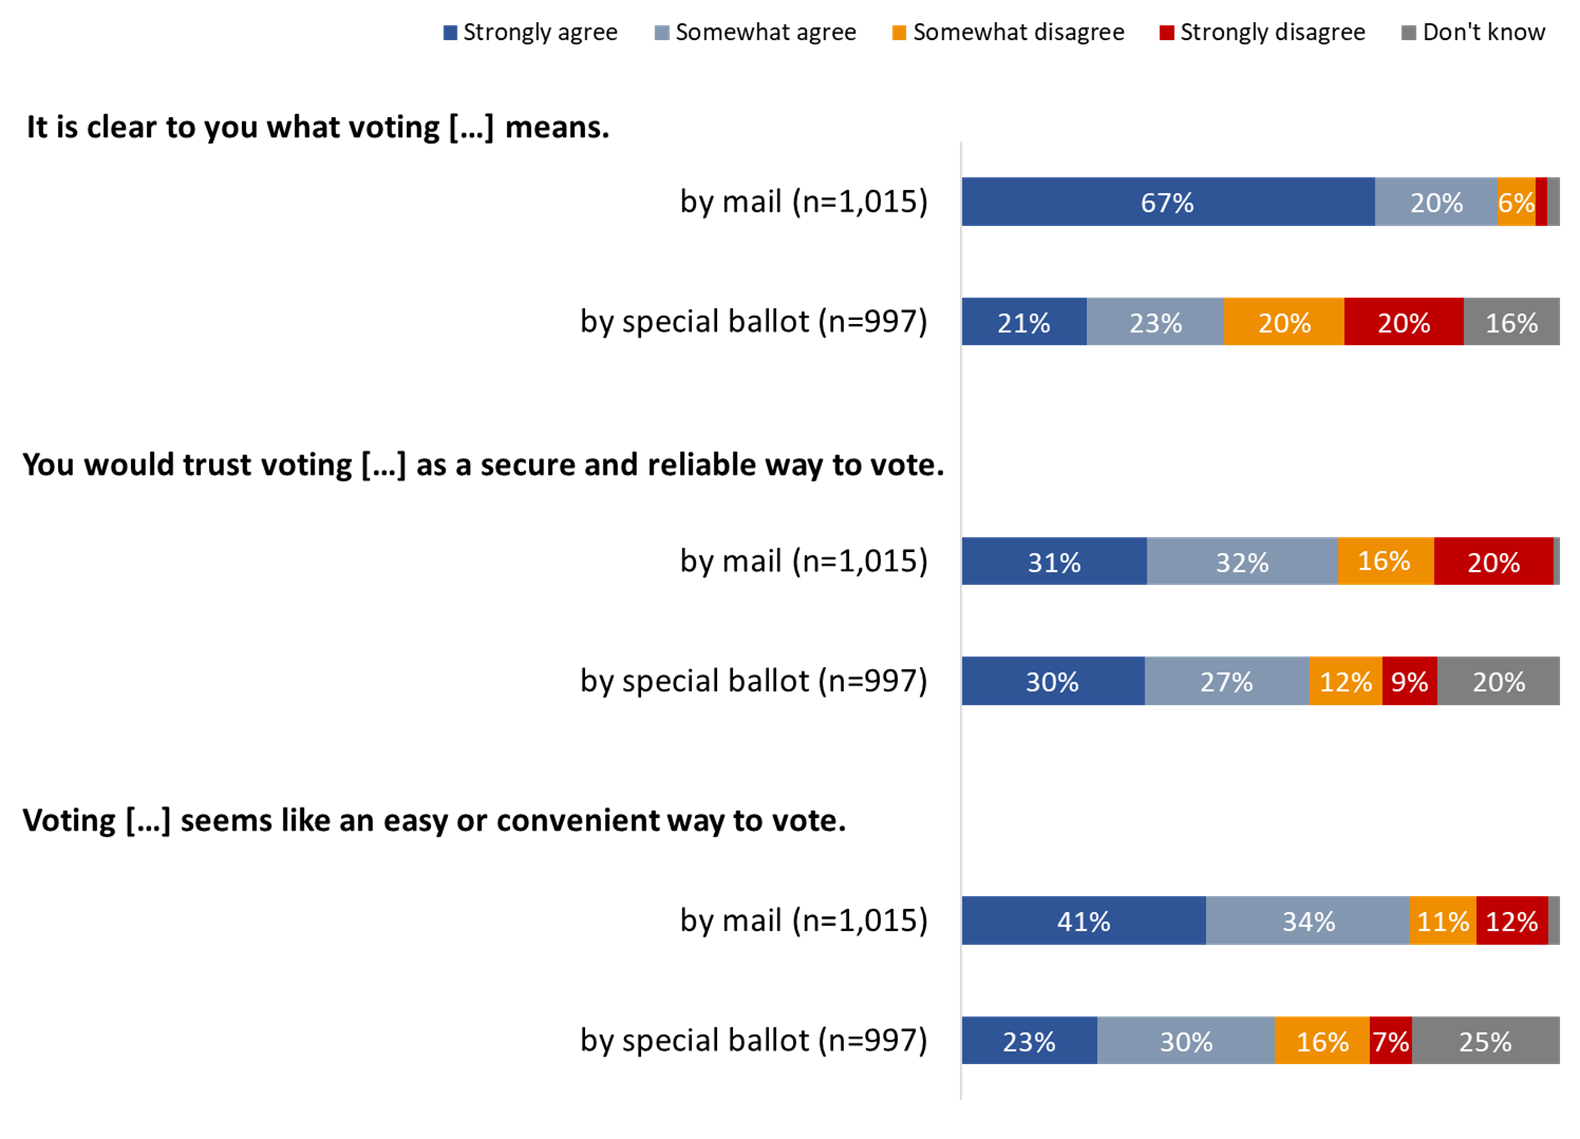
Values of less than 2% are not presented in the graph.
Q. Finally, do you strongly agree, somewhat agree, somewhat disagree or strongly disagree with the following statements about voting? Base: n=2,012; all respondents. Messages were randomly assigned to respondents, with approximately half each being presented the messages about voting "by mail" and "by special ballot."
This horizontal bar chart shows the levels of agreement with statements regarding clarity, trust, and ease/convenience regarding voting by mail or by special ballot. The breakdown is as follows:
Total
French respondents were less likely to agree that the meaning of the French equivalent for voting "by special ballot" was clear (27%) compared with English respondents (46%), while French and English respondents agreed in similar proportions that the meaning of voting "by mail" in their language was clear (85% and 87%, respectively).
Those who disagreed that the meaning of voting "by mail" or "by special ballot" was clear were asked to explain what they found unclear. Among those who found the meaning of voting "by mail" to be unclear (n=111), half (50%) expressed concerns about a lack of security or trust in voting by mail, while approximately one-quarter (24%) said they are unclear on the process or requirements for voting this way. Among those who found the meaning of voting "by special ballot" to be unclear (n=356), nearly seven in 10 (69%) said they do not understand what the term 'special ballot' means. The full set of reasons offered can be found in Figure 7.
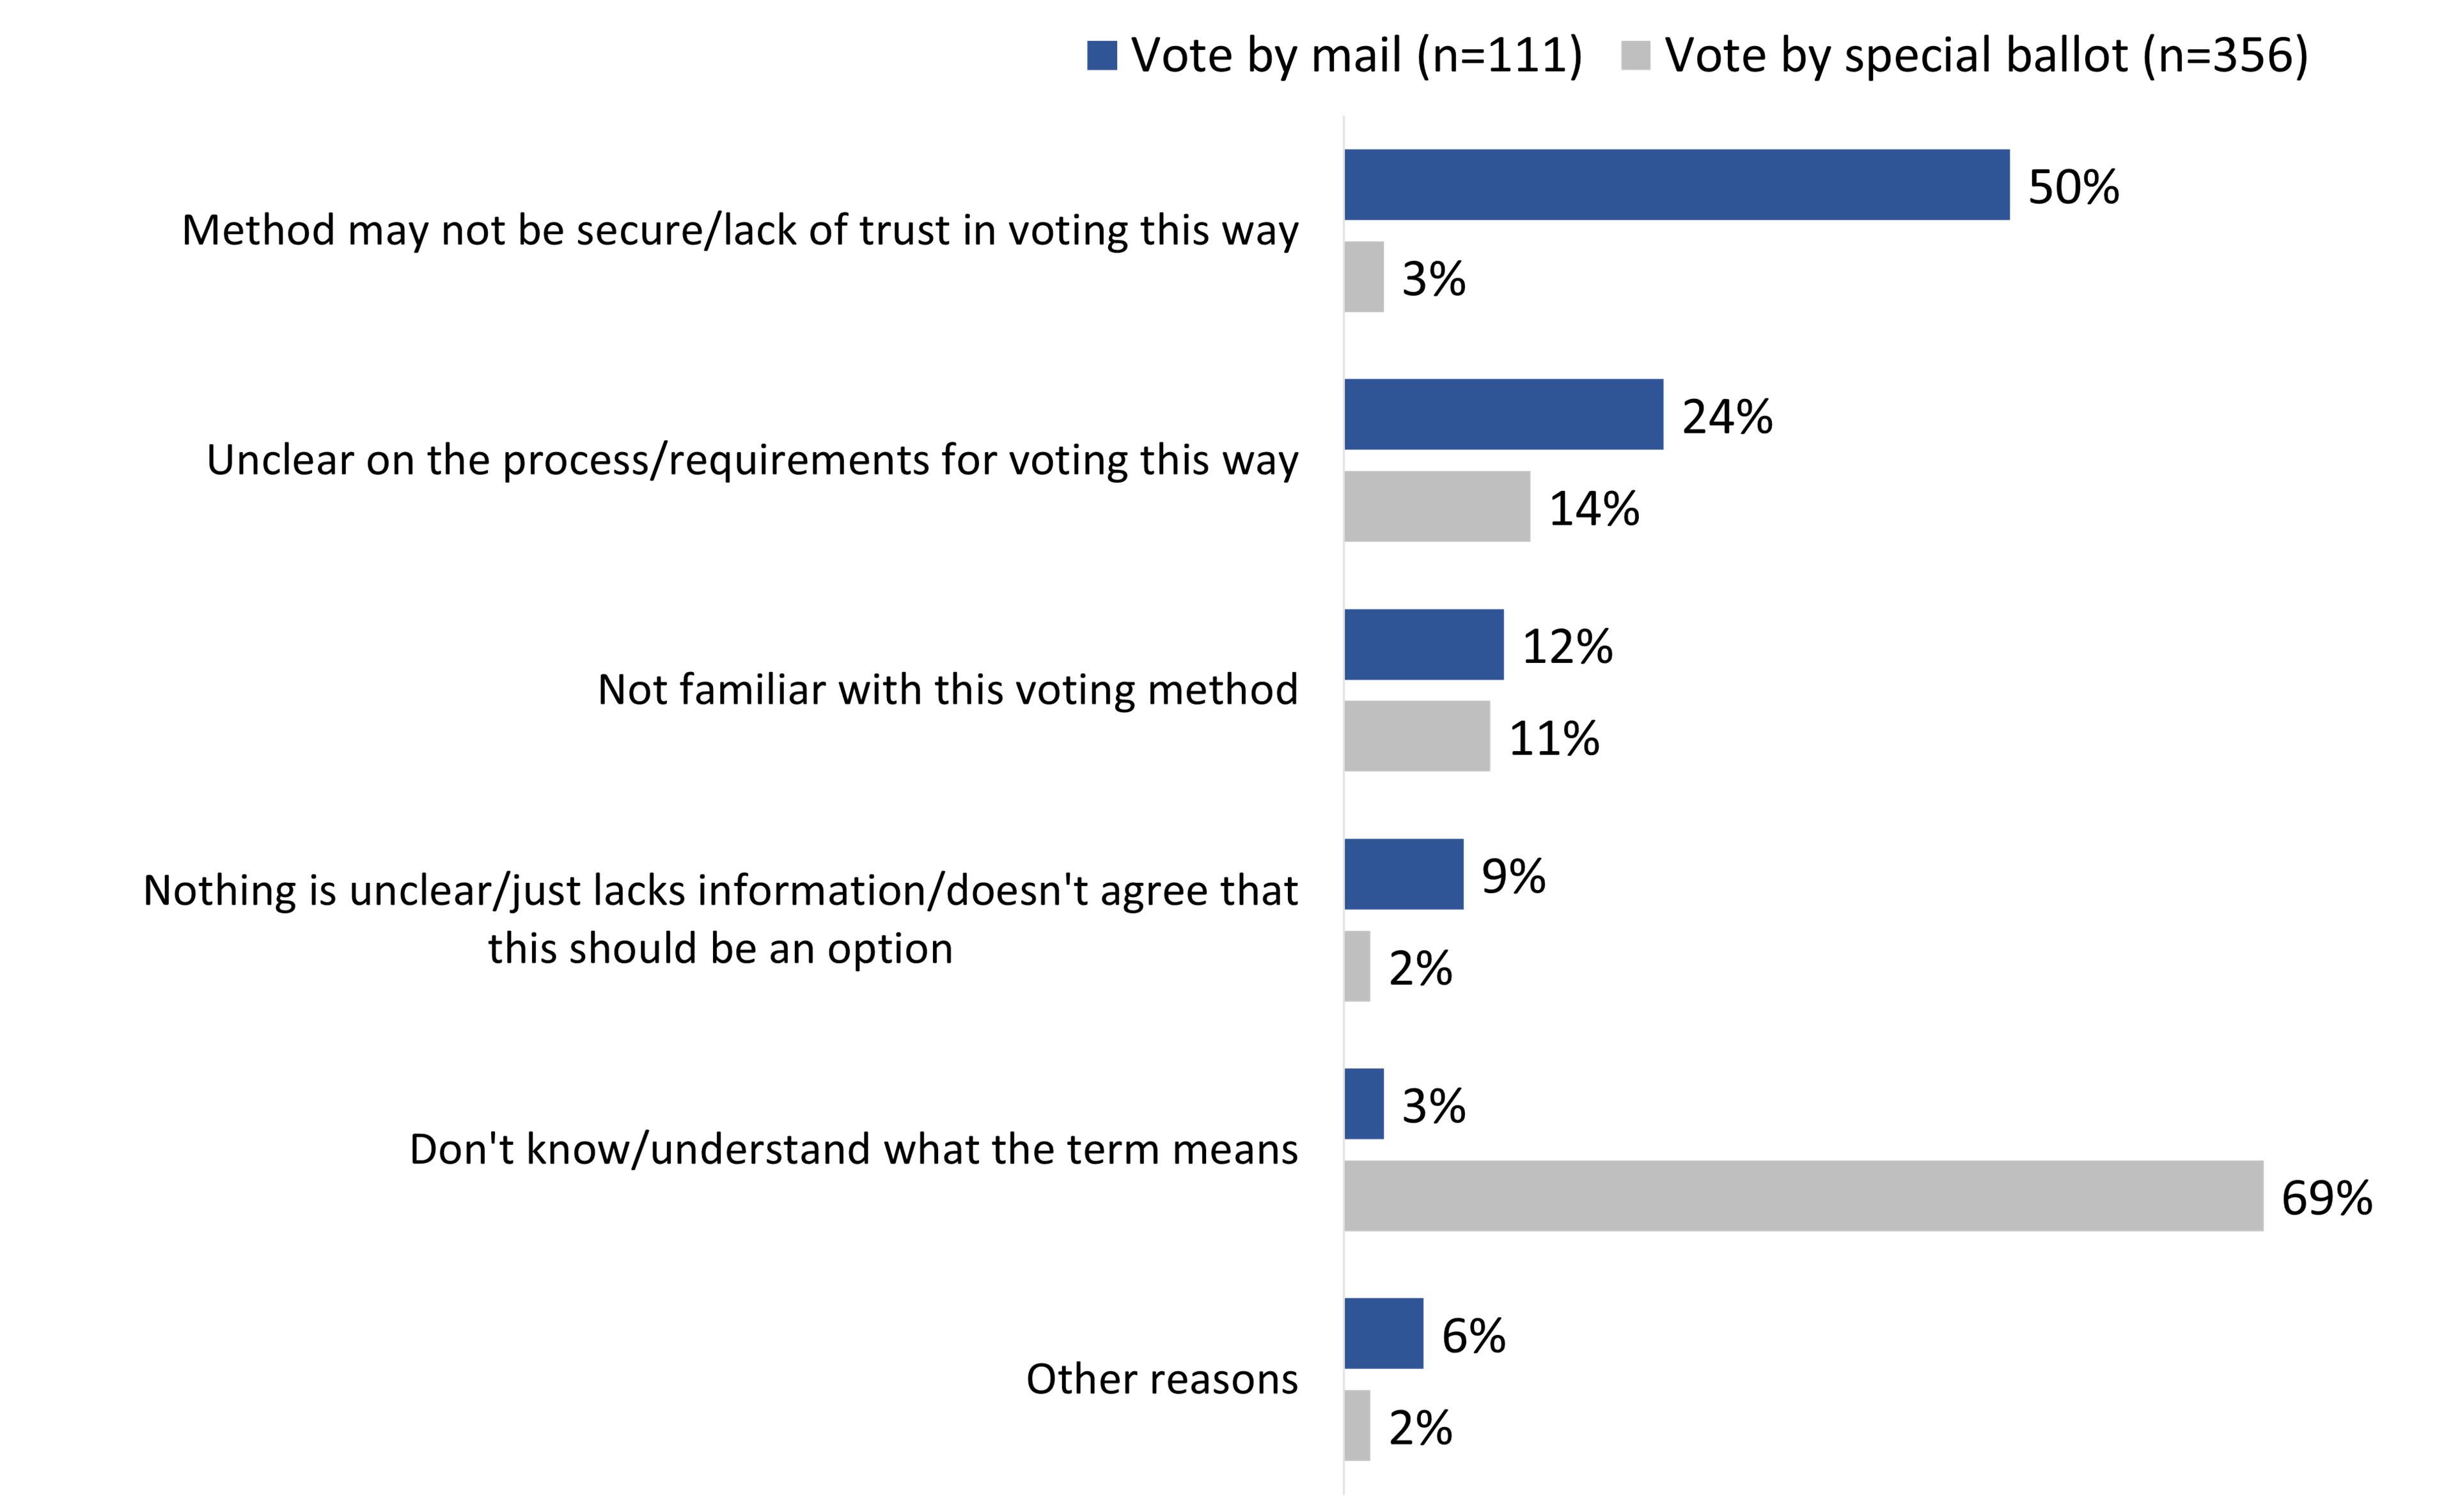
Q. What do you find unclear about the meaning of voting [by mail/special ballot]? (Multiple responses accepted) Base: those who somewhat or strongly disagreed with the statement): It is clear to you what voting [by mail/special ballot] means. [Dk: <0.5%; vote by special ballot]
This horizontal chart shows the different reasons why respondents who disagreed that the message about special ballots was clear believed so. The breakdown is as follows:
Total
Those who disagreed that voting "by mail" or "by special ballot" is a secure and reliable way to vote were asked to explain why. Among those who felt that voting "by mail" would not be secure or reliable (n=363), 46% thought that mail services might not be reliable and/or that there is a risk of ballots being lost in the mail or not arriving on time. Following this, 27% pointed to their concern that ballots submitted through the mail could be tampered with and/or intercepted, and 22% had an impression that there is a risk of voter fraud or impersonation. Among those who felt that voting by "special ballot" is not reliable (n=179), the single largest proportion (41%) said they are not familiar with this method of voting, followed by 14% who had concerns with the reliability of mail services. The full set of reasons offered can be found in Figure 8.
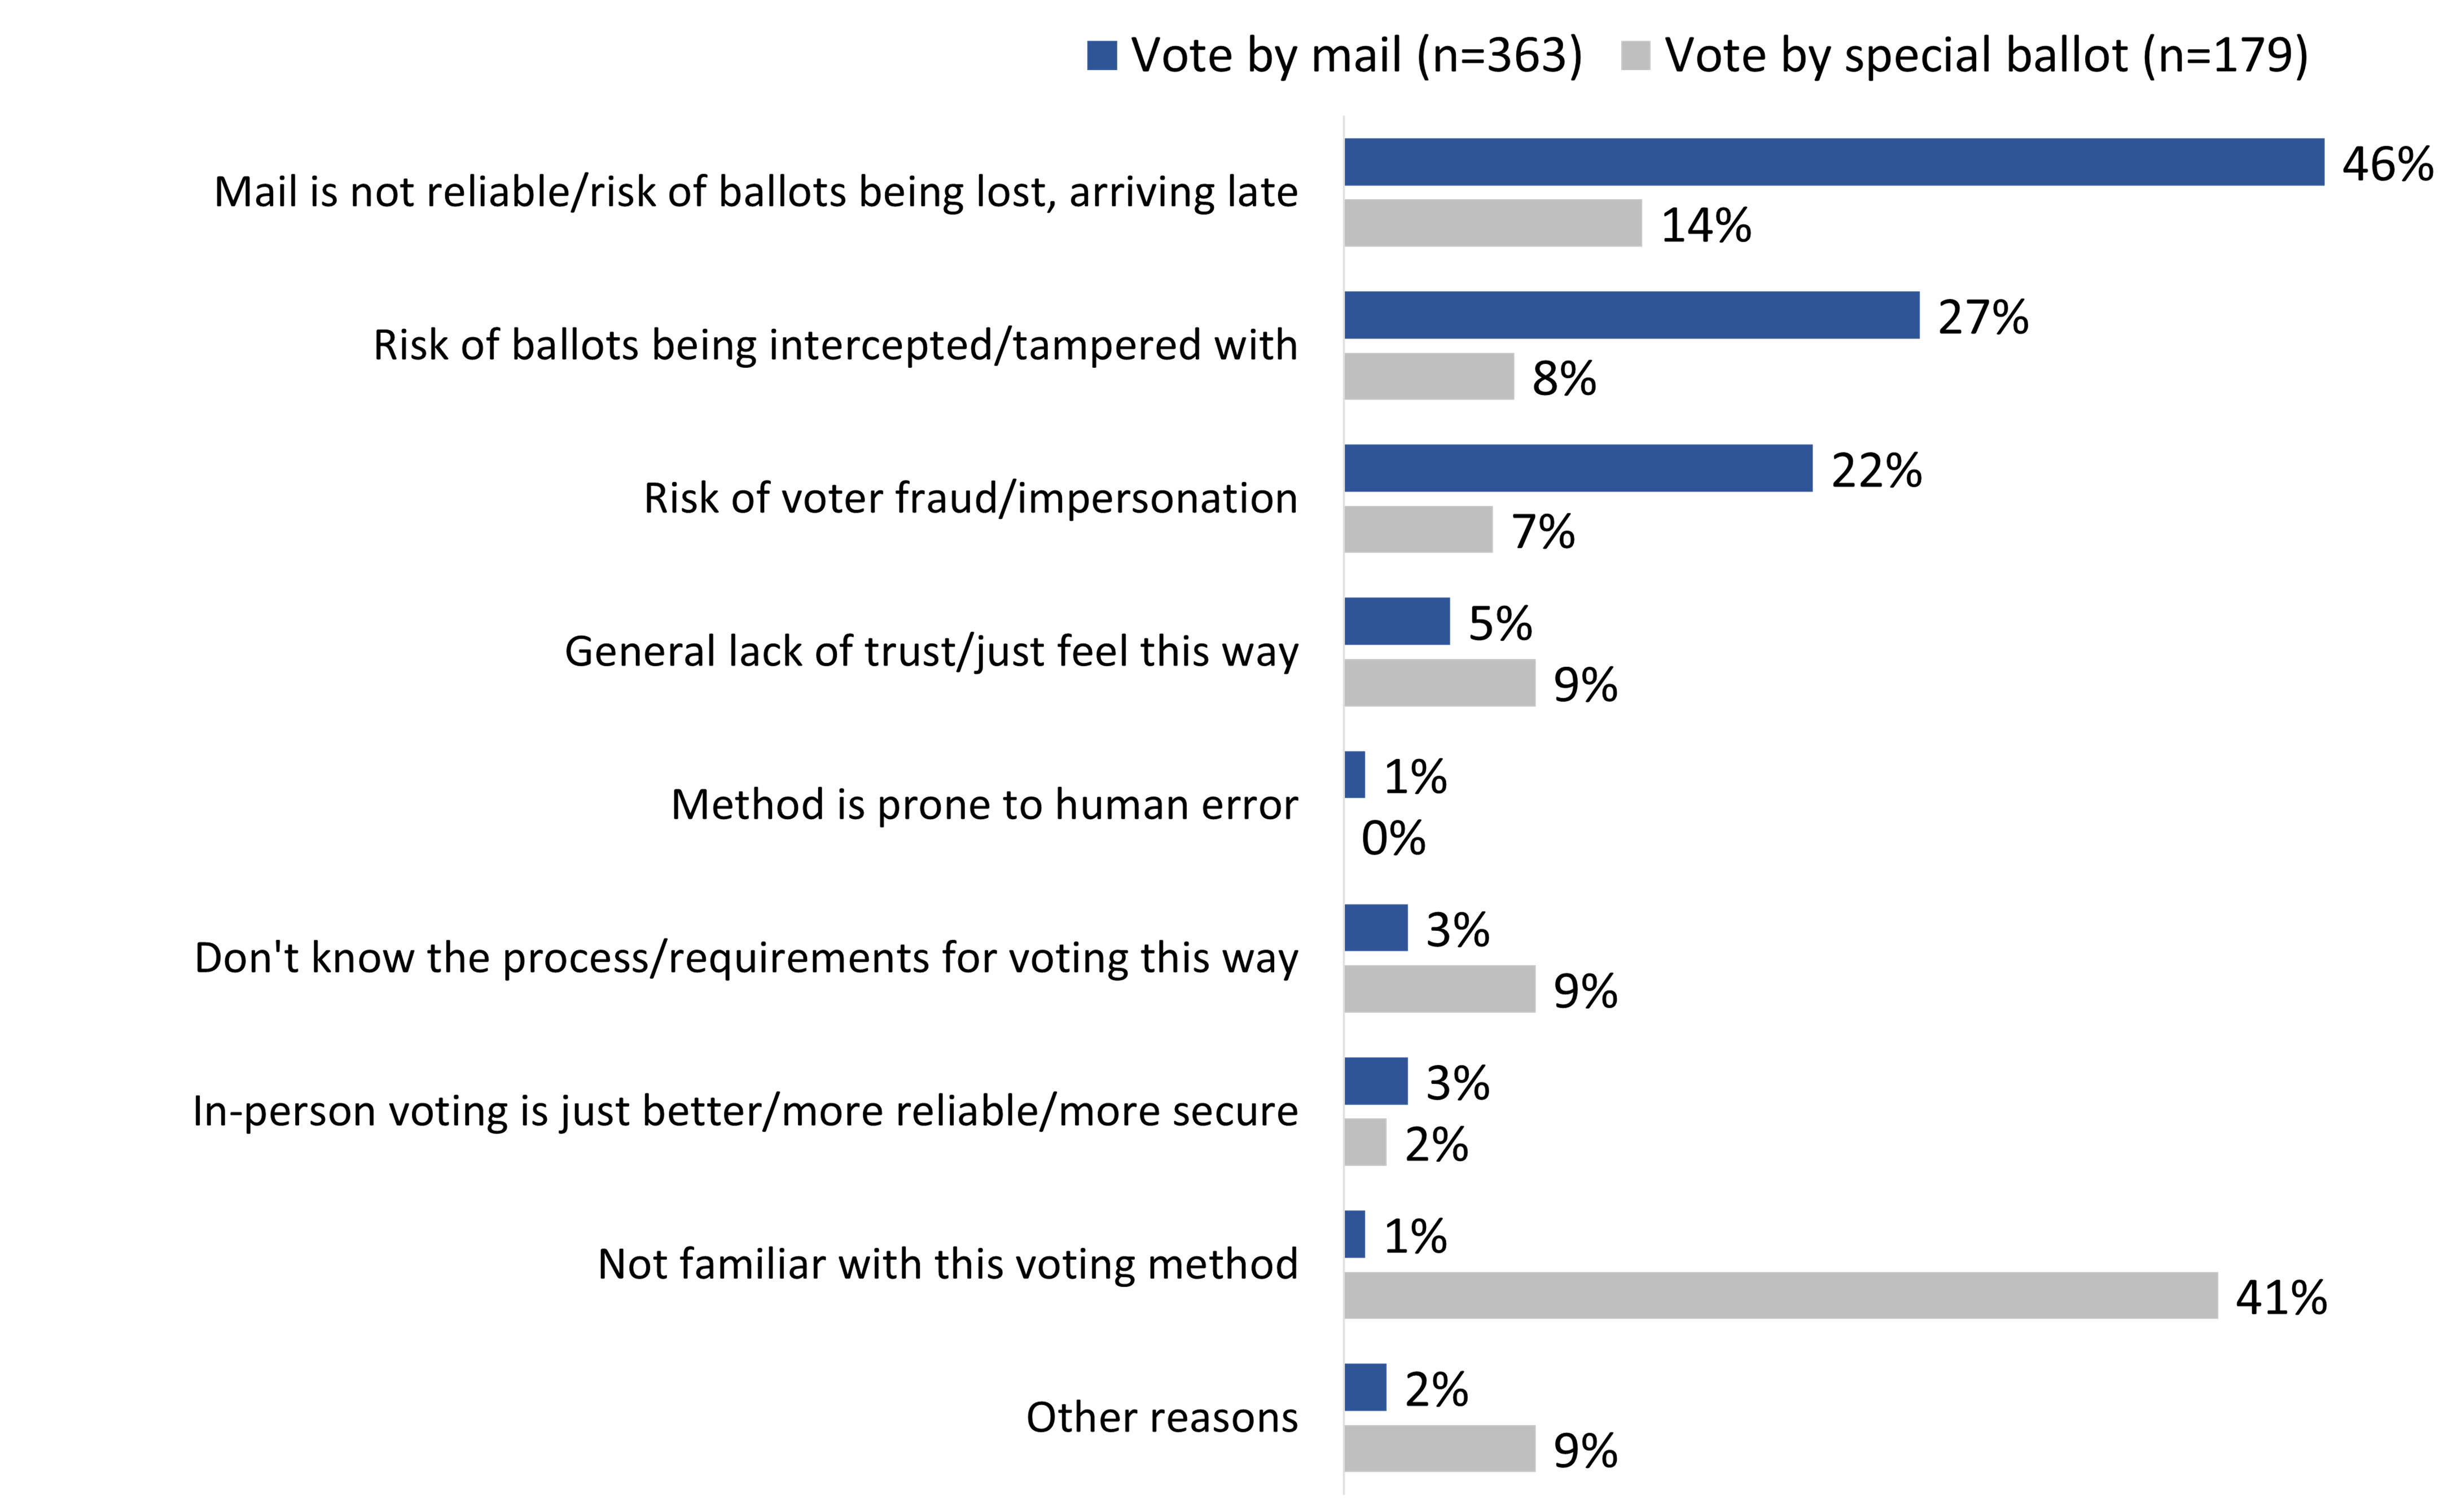
Q. What makes you think that voting [by mail/special ballot] would not be secure or reliable? (Multiple responses accepted) Base: those who somewhat or strongly disagreed with the statement: You would trust voting [by mail/special ballot] as a secure and reliable way to vote. [Dk: <1%; 2% respectively]
This horizontal bar chart shows the reasons why respondents disagree that they would trust voting by mail or by special ballot as a secure and reliable way to vote. The breakdown is as follows:
Total
The vast majority (90%) of electors aware of the federal by-election in their riding said they received a voter information card (VIC) addressed to them personally, which provided information about where and when to vote during the campaign. Electors from Portage-Lisgar (88%) were less likely than those from Oxford (93%) to say they received a VIC.
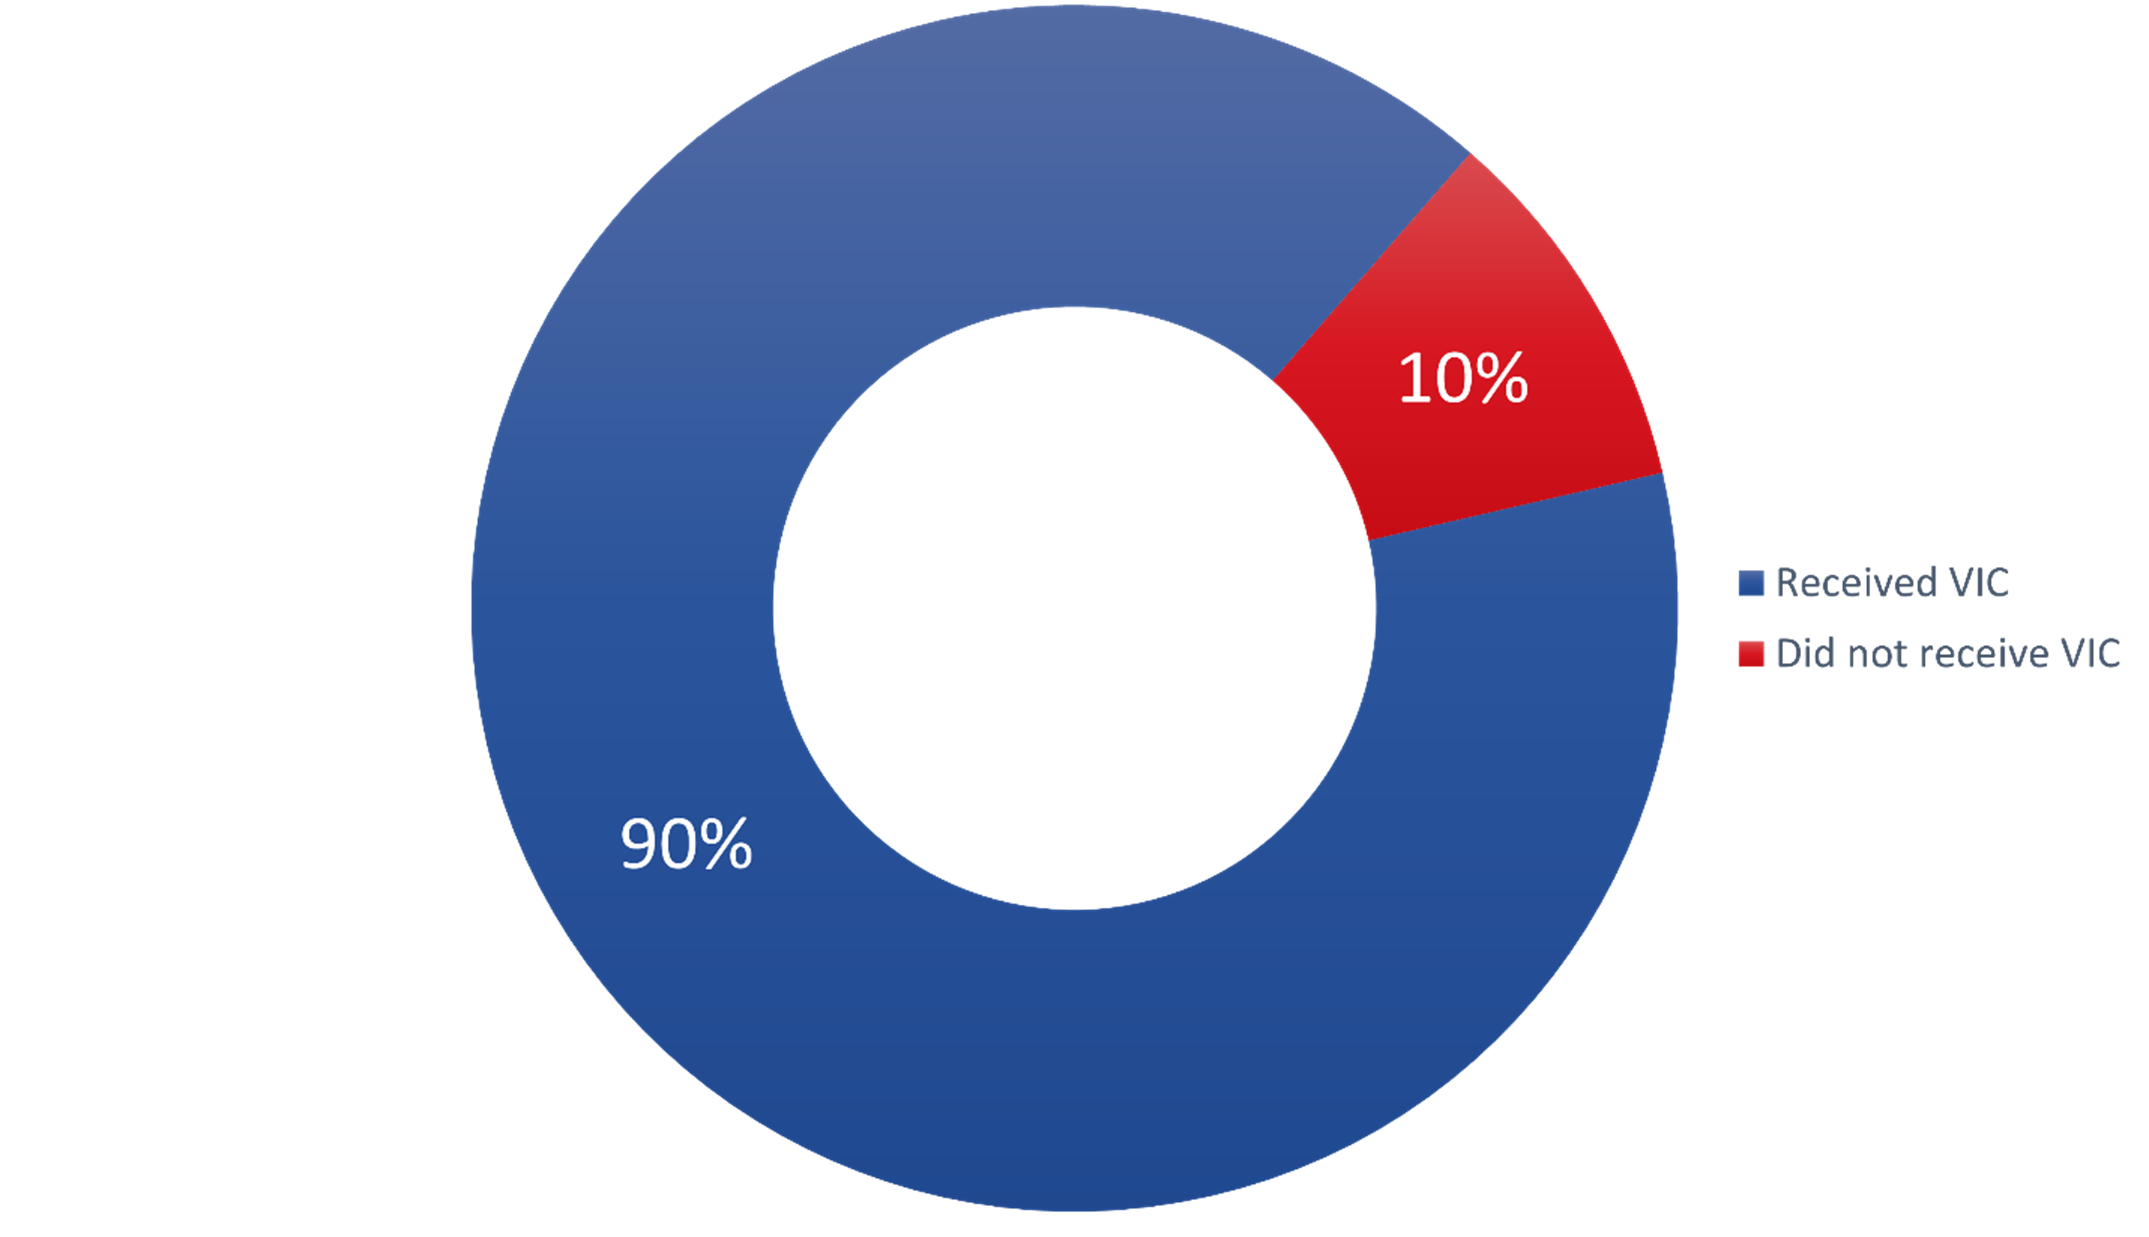
Q. During the campaign, did you receive a voter information card addressed to you personally and telling you where and when to vote? Base: n=1886; those aware of the by-election.
This pie chart shows the percentage of those who received their Voter Information Card, or VIC. Ninety percent received their VIC and 10 percent did not.
The following groups of electors were less likely to say they received a VIC:
Respondents aware of the by-election (n=1,886) were asked if they recalled seeing or hearing advertising from Elections Canada about where, when, and how to vote. Nearly three-quarters (73%) recalled advertising on at least one medium or format. Approximately one-third of electors recalled hearing advertising from EC on the radio or an audio platform (34%), and nearly three in 10 each recalled advertising on social media (28%) or when browsing the internet or on a mobile application (28%). Roughly one-quarter recalled advertising from EC when reading a local newspaper (24%).
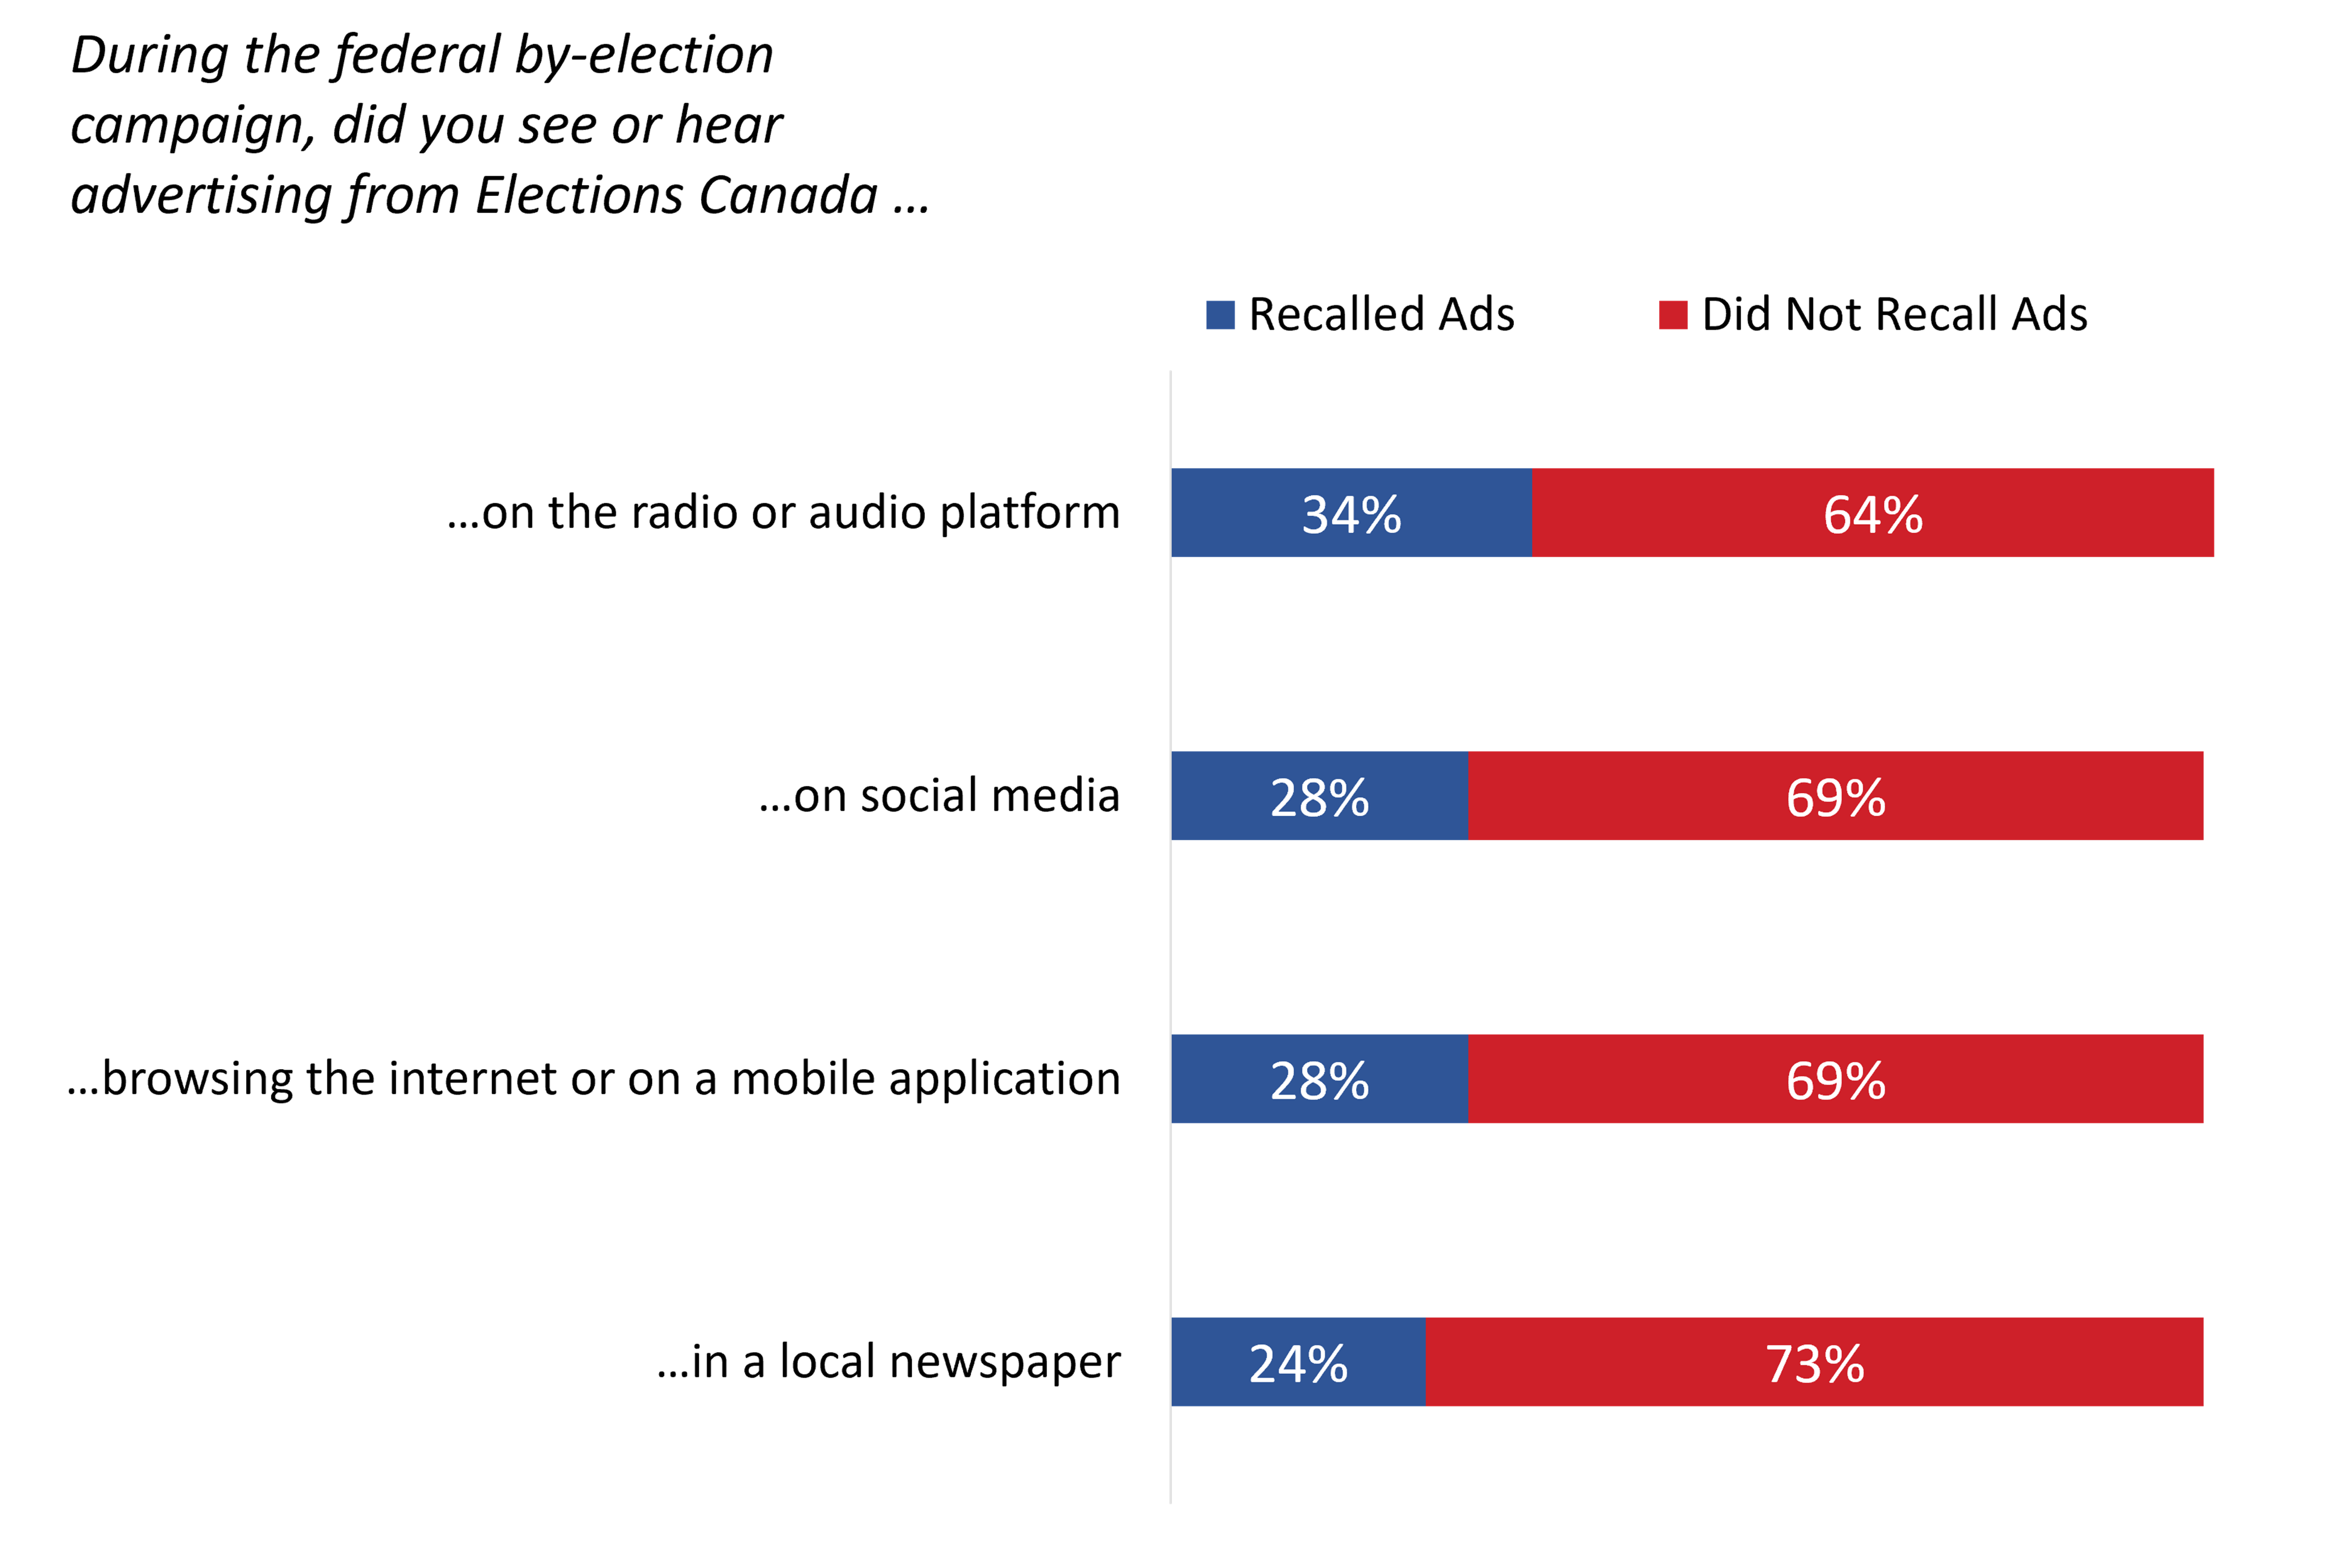
Q. During the federal by-election campaign, did you see or hear advertising from Elections Canada about where, when and how to vote? Base: n=1,886; those aware of the by-election. [Don't know (Dk)/no response (Nr): 3% or less]
The horizontal bar chart shows the percentage of respondents who saw or heard advertising from Elections Canada on social media, the radio or an audio platform, browsing or on a mobile application, and in a local newspaper. The breakdown is as follows:
Total
Notable subgroup differences include the following:
Nearly one-third (31%) of electors aware of the by-election said they recalled seeing or hearing advertisements from EC in other formats. Figure 11 lists the other formats or sources mentioned by respondentsfootnote 3. Sources are presented as a percentage of those aware of the by-election (rather than as a percentage of those that mentioned other formats).
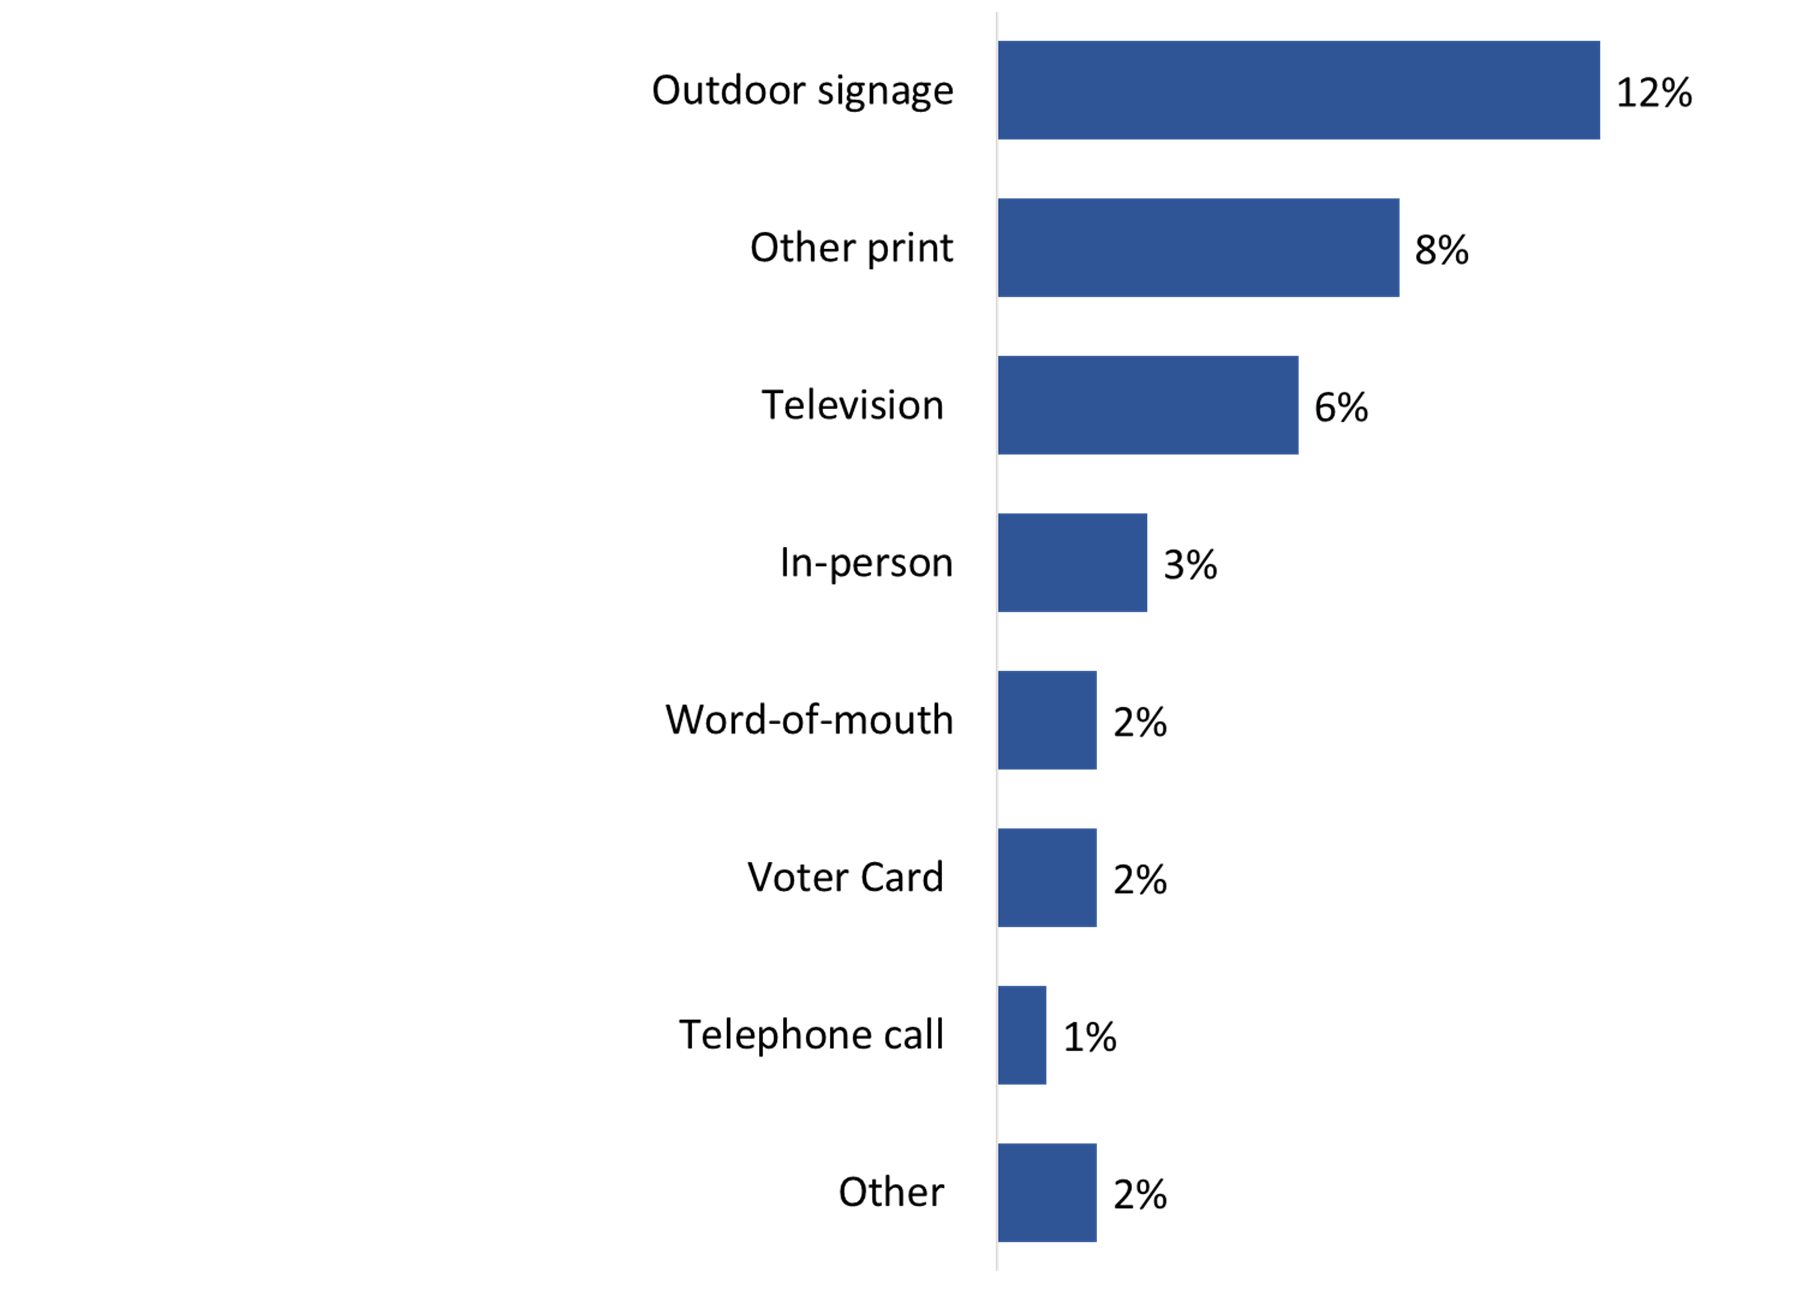
Q: What other format did you see or hear advertising from Elections Canada about where, when and how to vote during the by-election campaign? Base: n=1,886; those aware of the by-election.
The horizontal bar chart shows the percentage of respondents who saw or heard advertising from Elections Canada on other sources. The breakdown is as follows:
Total
Ninety-three percent (93%) of electors aware of the by-election felt informed about how, when, and where to vote for the June 19, 2023, and July 24, 2023, federal by-elections, with three-quarters (75%) saying they felt very informed. Electors from each riding were similarly likely to feel informed about the by-election held in their riding.
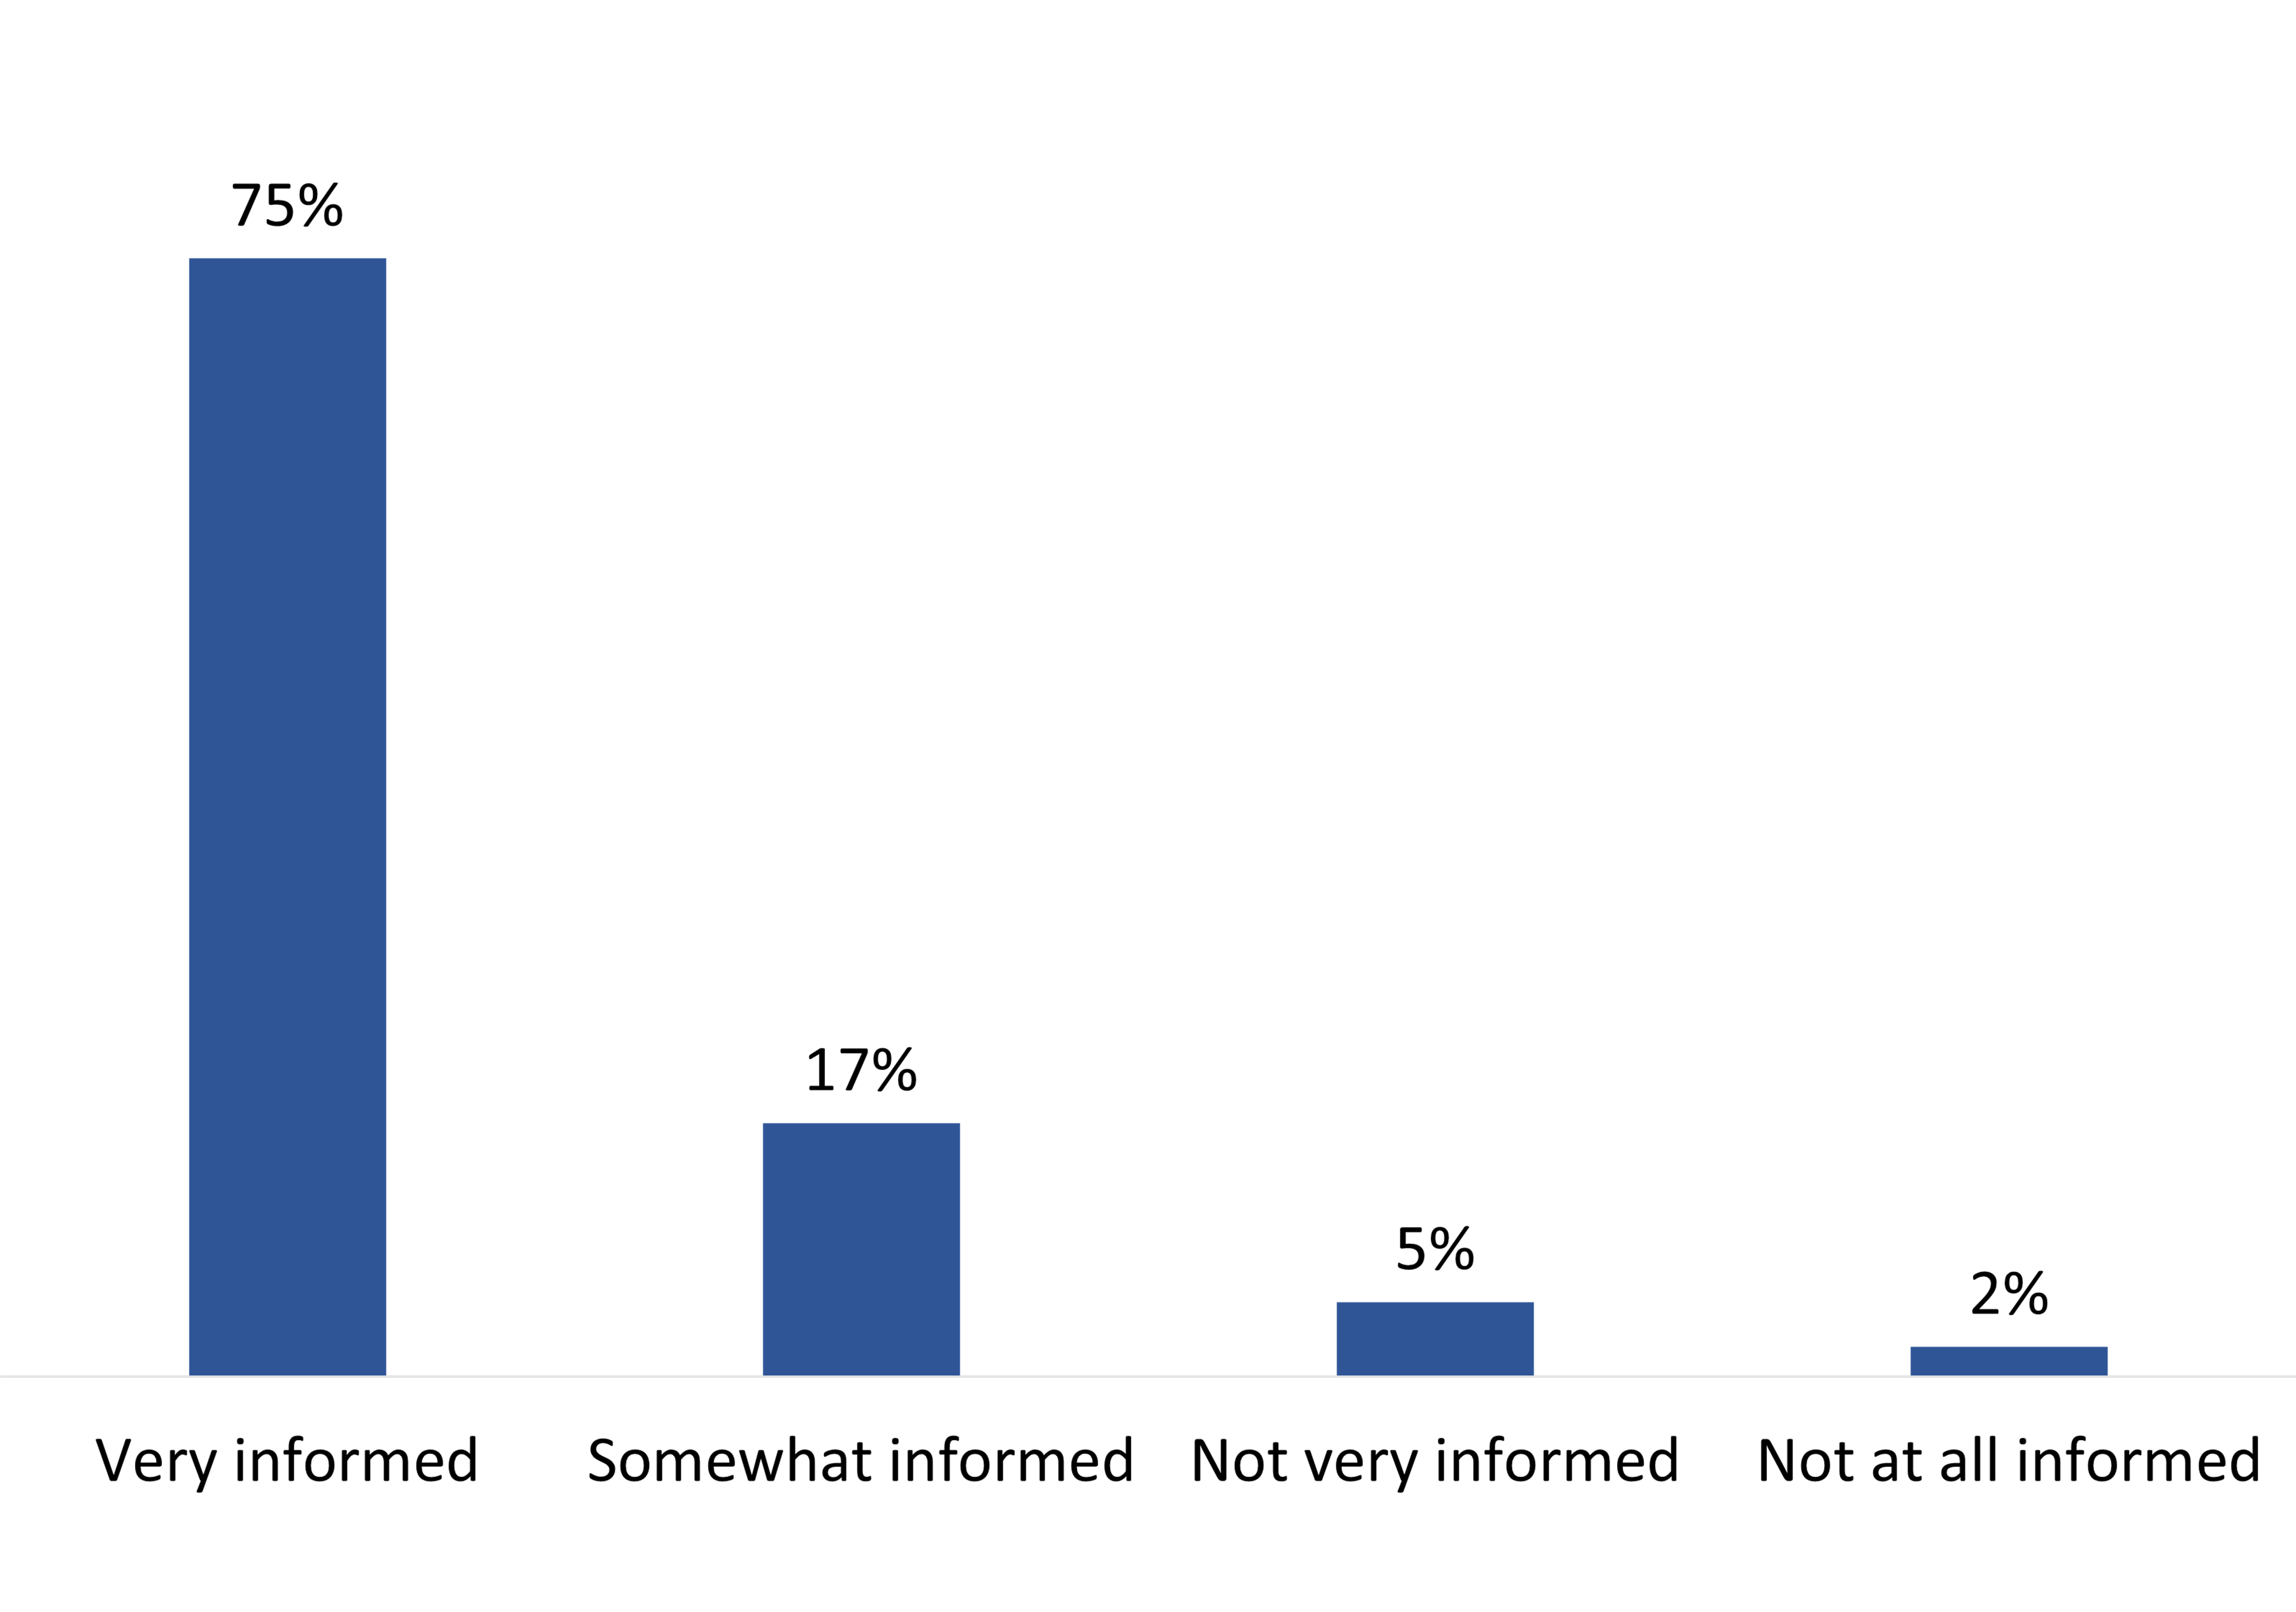
Q. Overall, how well informed do you feel you were about when, where, and how to vote in the by-election? Base: n=1,886; those who were aware of the by-election.
The vertical bar chart shows how well respondents felt they were informed about how, when, and where to vote. The breakdown is as follows:
Total
Those who voted in the by-election (98%) were more likely to feel informed about the by-election than those who did not vote in it (77%), as were those who voted in the 2021 federal election (95% versus 81% of those who did not) and those who received their VIC (98%) compared to those who did not (50%).
The following respondents were less likely to feel very informed:
Three-quarters (74%) of electors who were aware of the by-election held in their riding said they voted. Electors from Notre-Dame-de-Grâce-Westmount (66%) and Calgary-Heritage (69%) were less likely than electors from the ridings of Winnipeg South Centre (77%), Portage-Lisgar (77%), and Oxford (79%) to report having voted in the by-election.
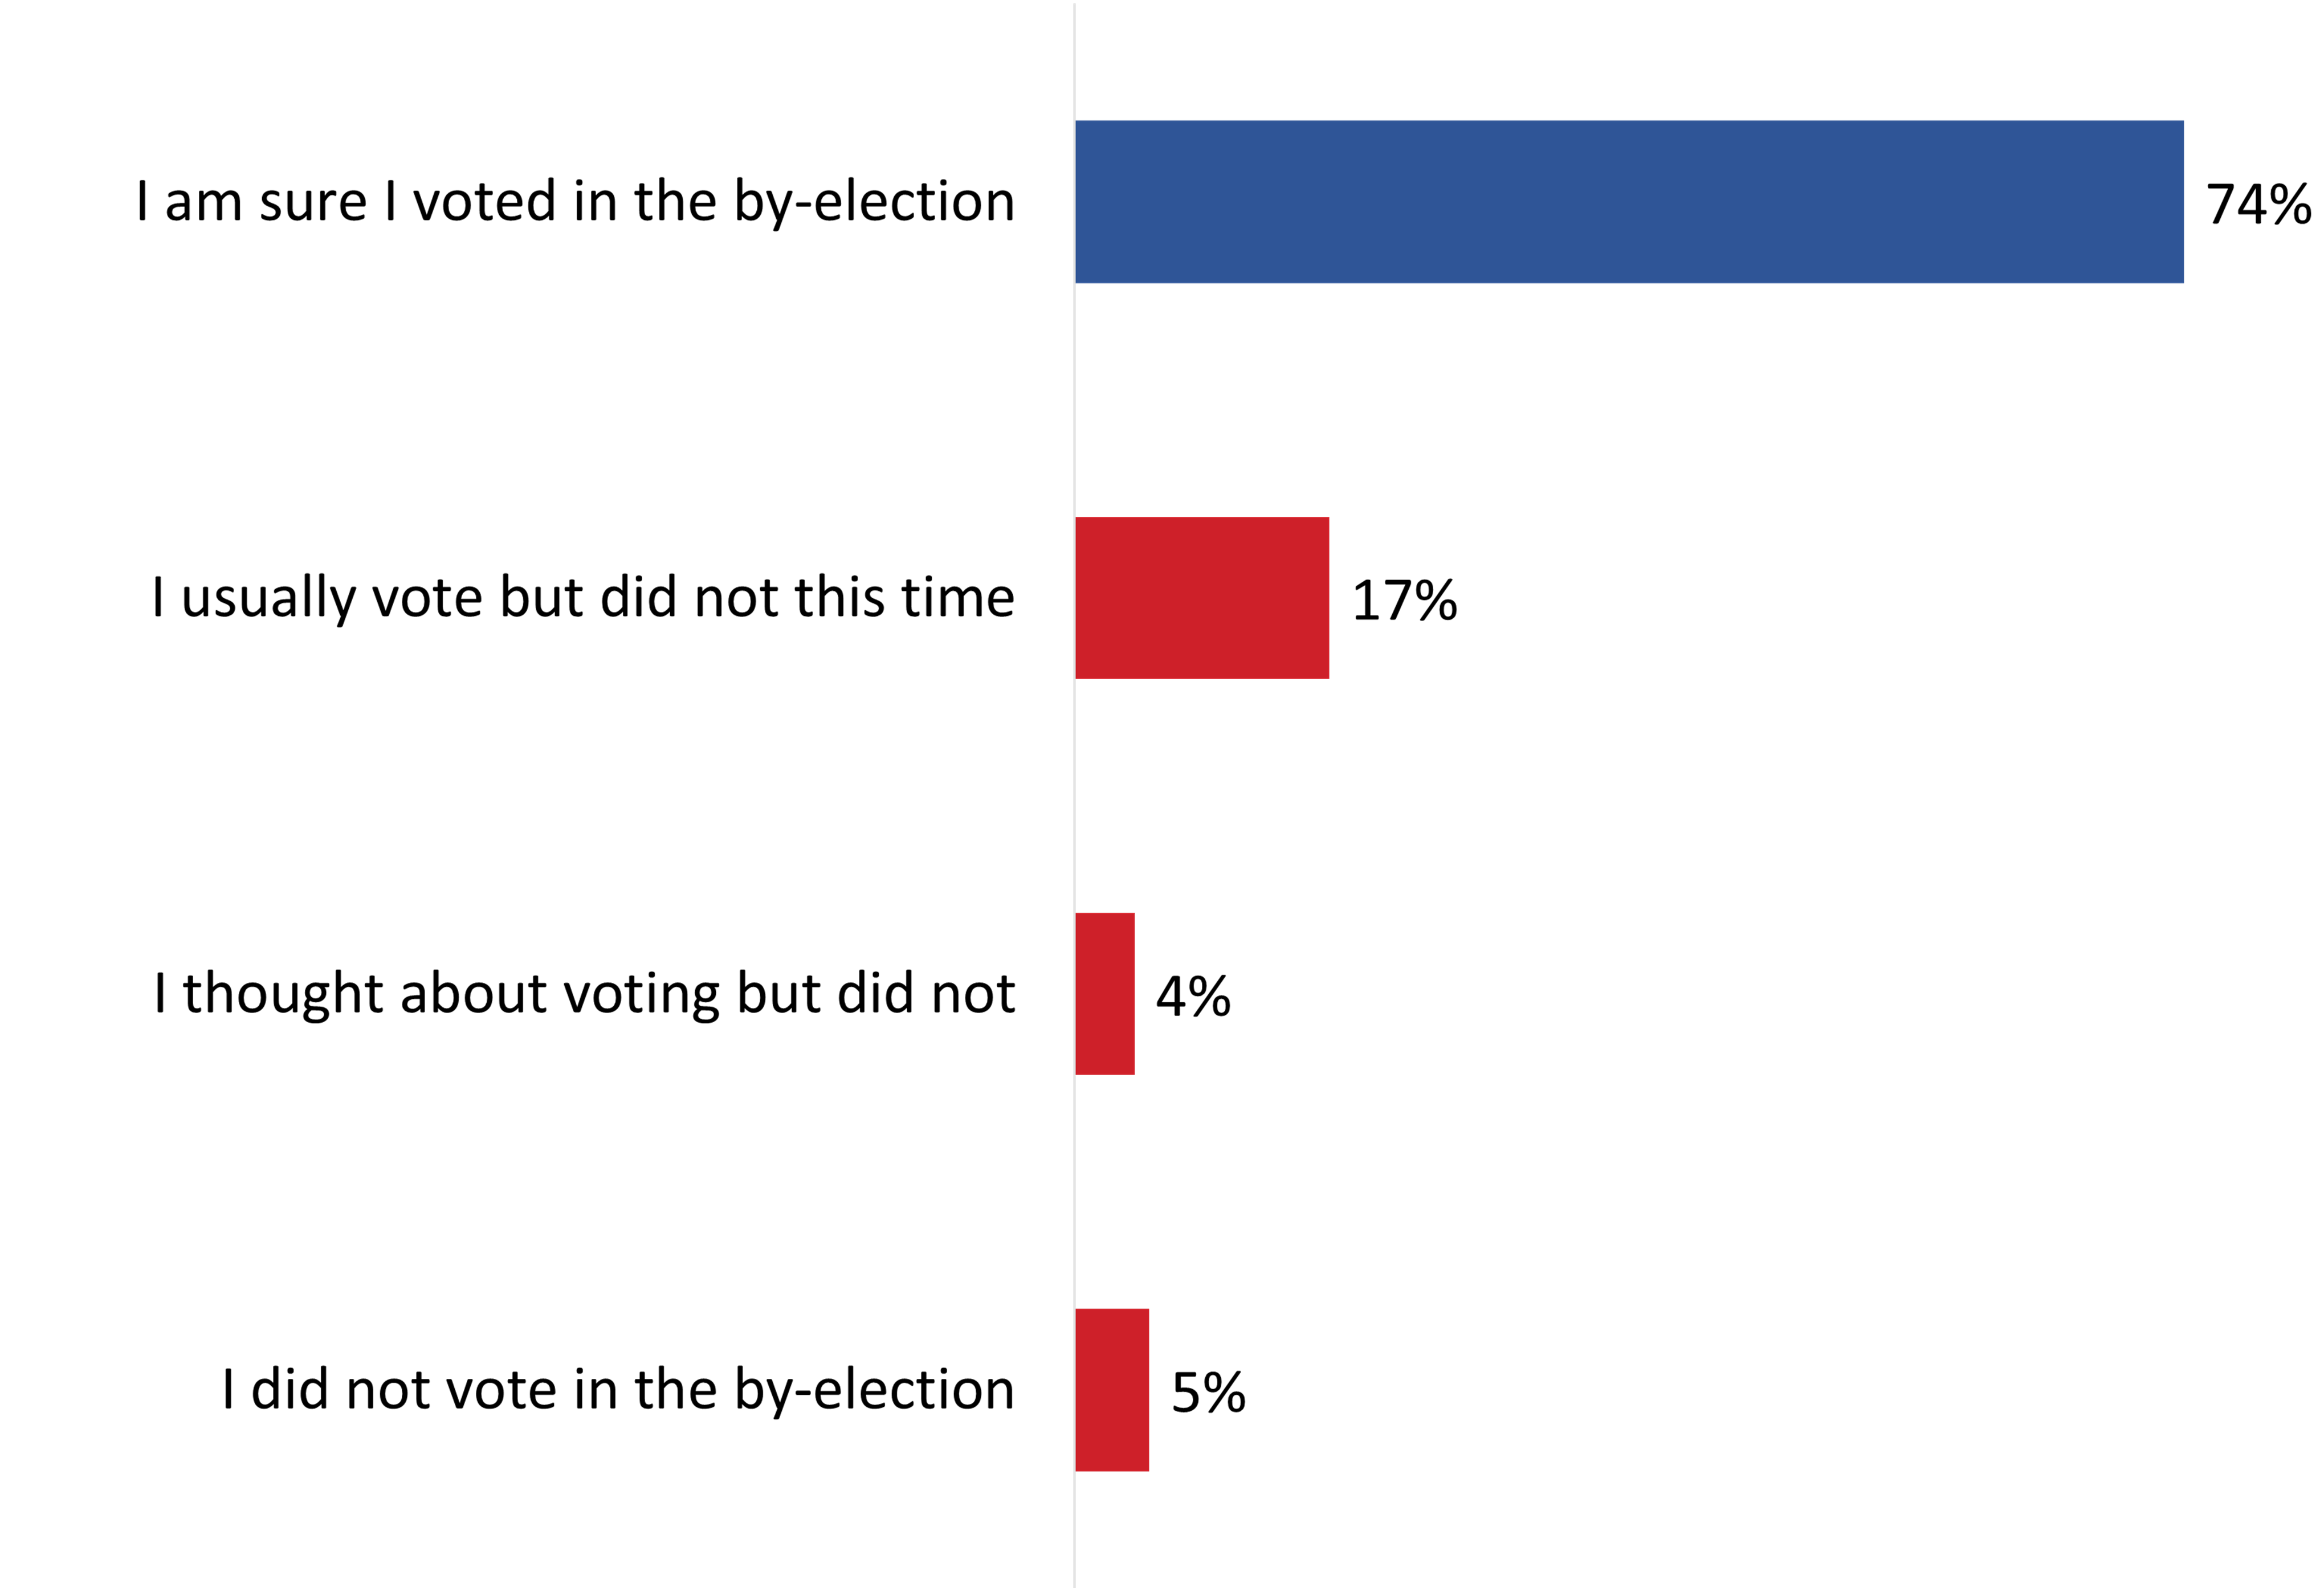
Q. Many people don't or can't vote for a variety of reasons. Which of the following statement describes you? Base: n=1,886; those who were aware of the by-election.
This horizontal bar chart shows the percentage of respondents who agreed with the statements about voting in the by-election. The breakdown is as follows:
Electors less likely to report that they voted include:
Among electors who said they did not vote (n=446), the most common reasons for not doing so were everyday life and health reasons (43%). Three in ten (30%) said they did not vote due to political reasons and 10% for reasons related to the electoral process. Other reasons (15%) mainly included forgetting to vote (7%).
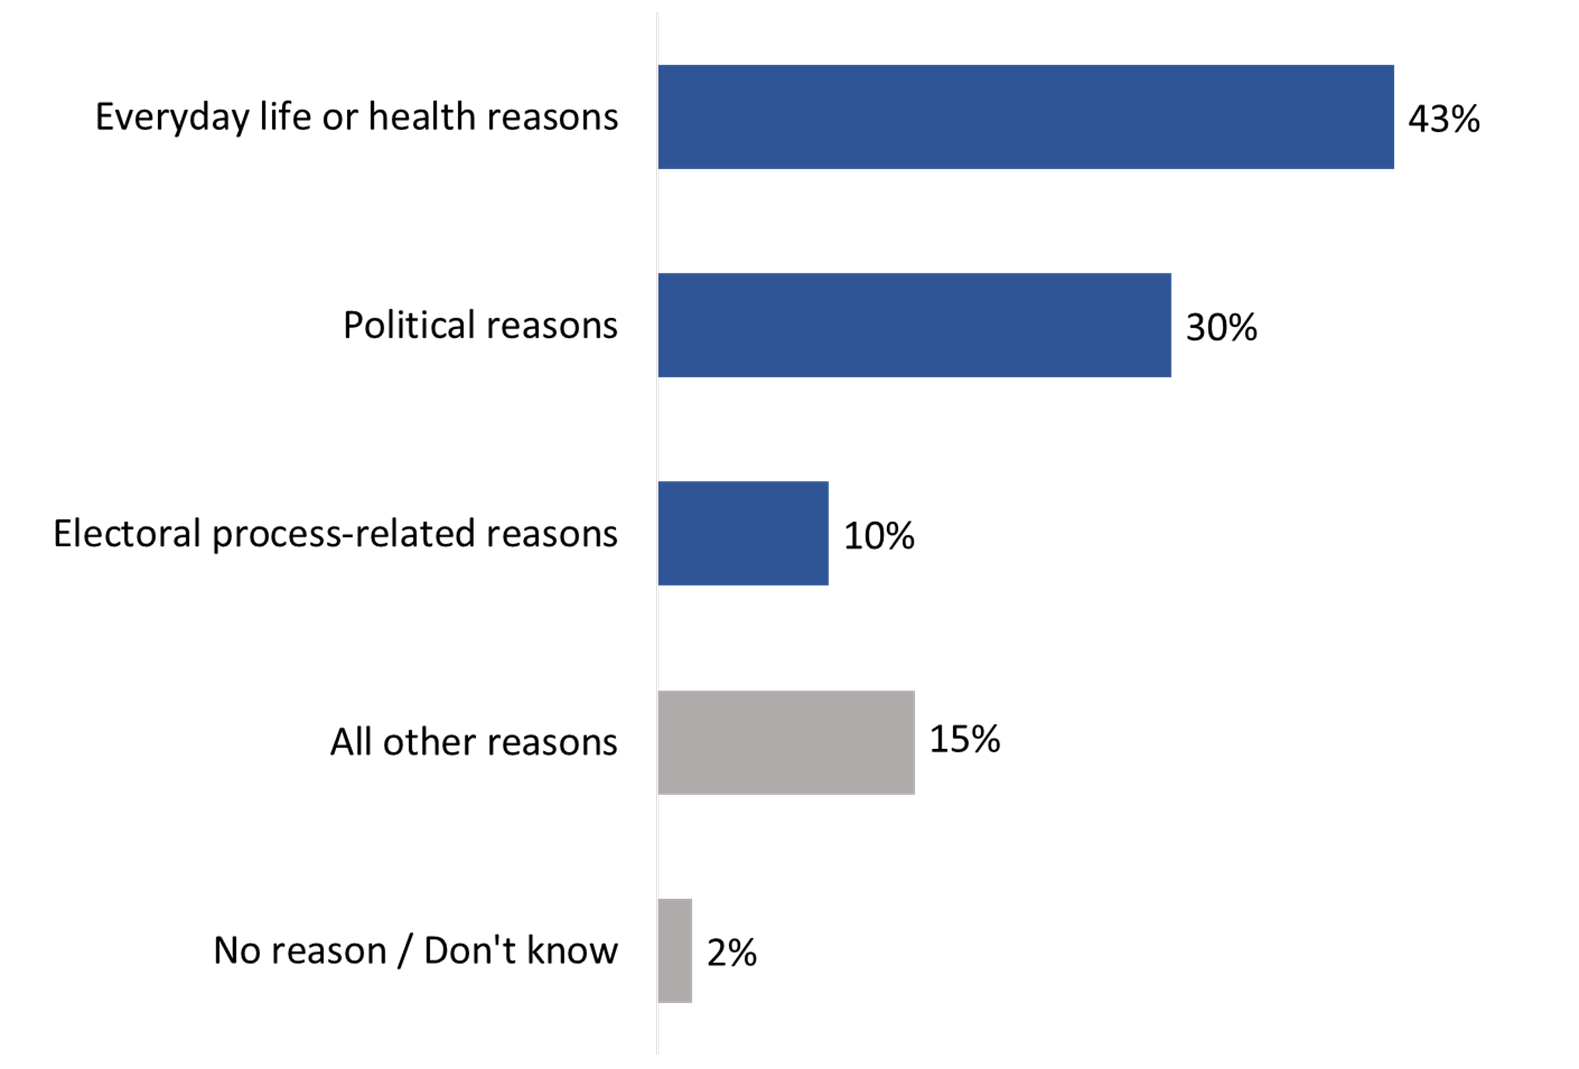
Q. What is the main reason you did not vote? Base: n=446; respondents who did not vote [Dk/nr: 2%]
This horizontal bar chart shows the percentage of respondents who selected each reason for not voting in the by-election. The breakdown is as follows:
Those who were eligible but did not vote in the 2021 federal general election were more likely to mention political reasons for not voting in the by-election (49% versus 26% of those who voted in 2021).
Those who did not receive a VIC for the by-election were more likely to say they did not vote due to electoral-process-related reasons (25% versus 4% among non-voters who received a VIC), including 17% who said that lack of information about the voting process was their main reason for not voting (compared with 2% of non-voters who received a VIC).
The table below provides a detailed breakdown of the reasons why surveyed electors did not vote during the June 19, 2023, and July 24, 2023 federal by-elections.
| Reasons for Not Voting | % |
|---|---|
| Everyday life or health reasons | 43% |
| Too busy | 24% |
| Out of town | 13% |
| Illness or disability | 6% |
| Political reasons | 30% |
| Felt voting would not make a difference | 8% |
| Lack of information about campaign issues and parties' positions | 8% |
| Did not like candidates/parties/campaign | 7% |
| Not interested in politics | 3% |
| Did not know who to vote for | 2% |
| Do not trust politicians/politics | 2% |
| Electoral-process–related reasons | 10% |
| Lack of information about voting process (e.g., when/where to vote) | 6% |
| Transportation problem/polling station too far/not accessible | 2% |
| Issues with VIC and identification (e.g., could not prove identity) | 2% |
| Issues with process (e.g., did not receive mail ballot, process not accessible) | <0.5% |
| Other reasons | 15% |
| Forgot to vote | 7% |
| Other reasons | 8% |
No particular reason: 1%
[Dk/nr: 1%]
Among electors who did not vote because they were too busy (n=85), half (51%) said they had other priorities that day. Following this, approximately one-quarter (26%) had something come up that required them to change their plans, and 15% said they do not have time in their normal schedule to vote.
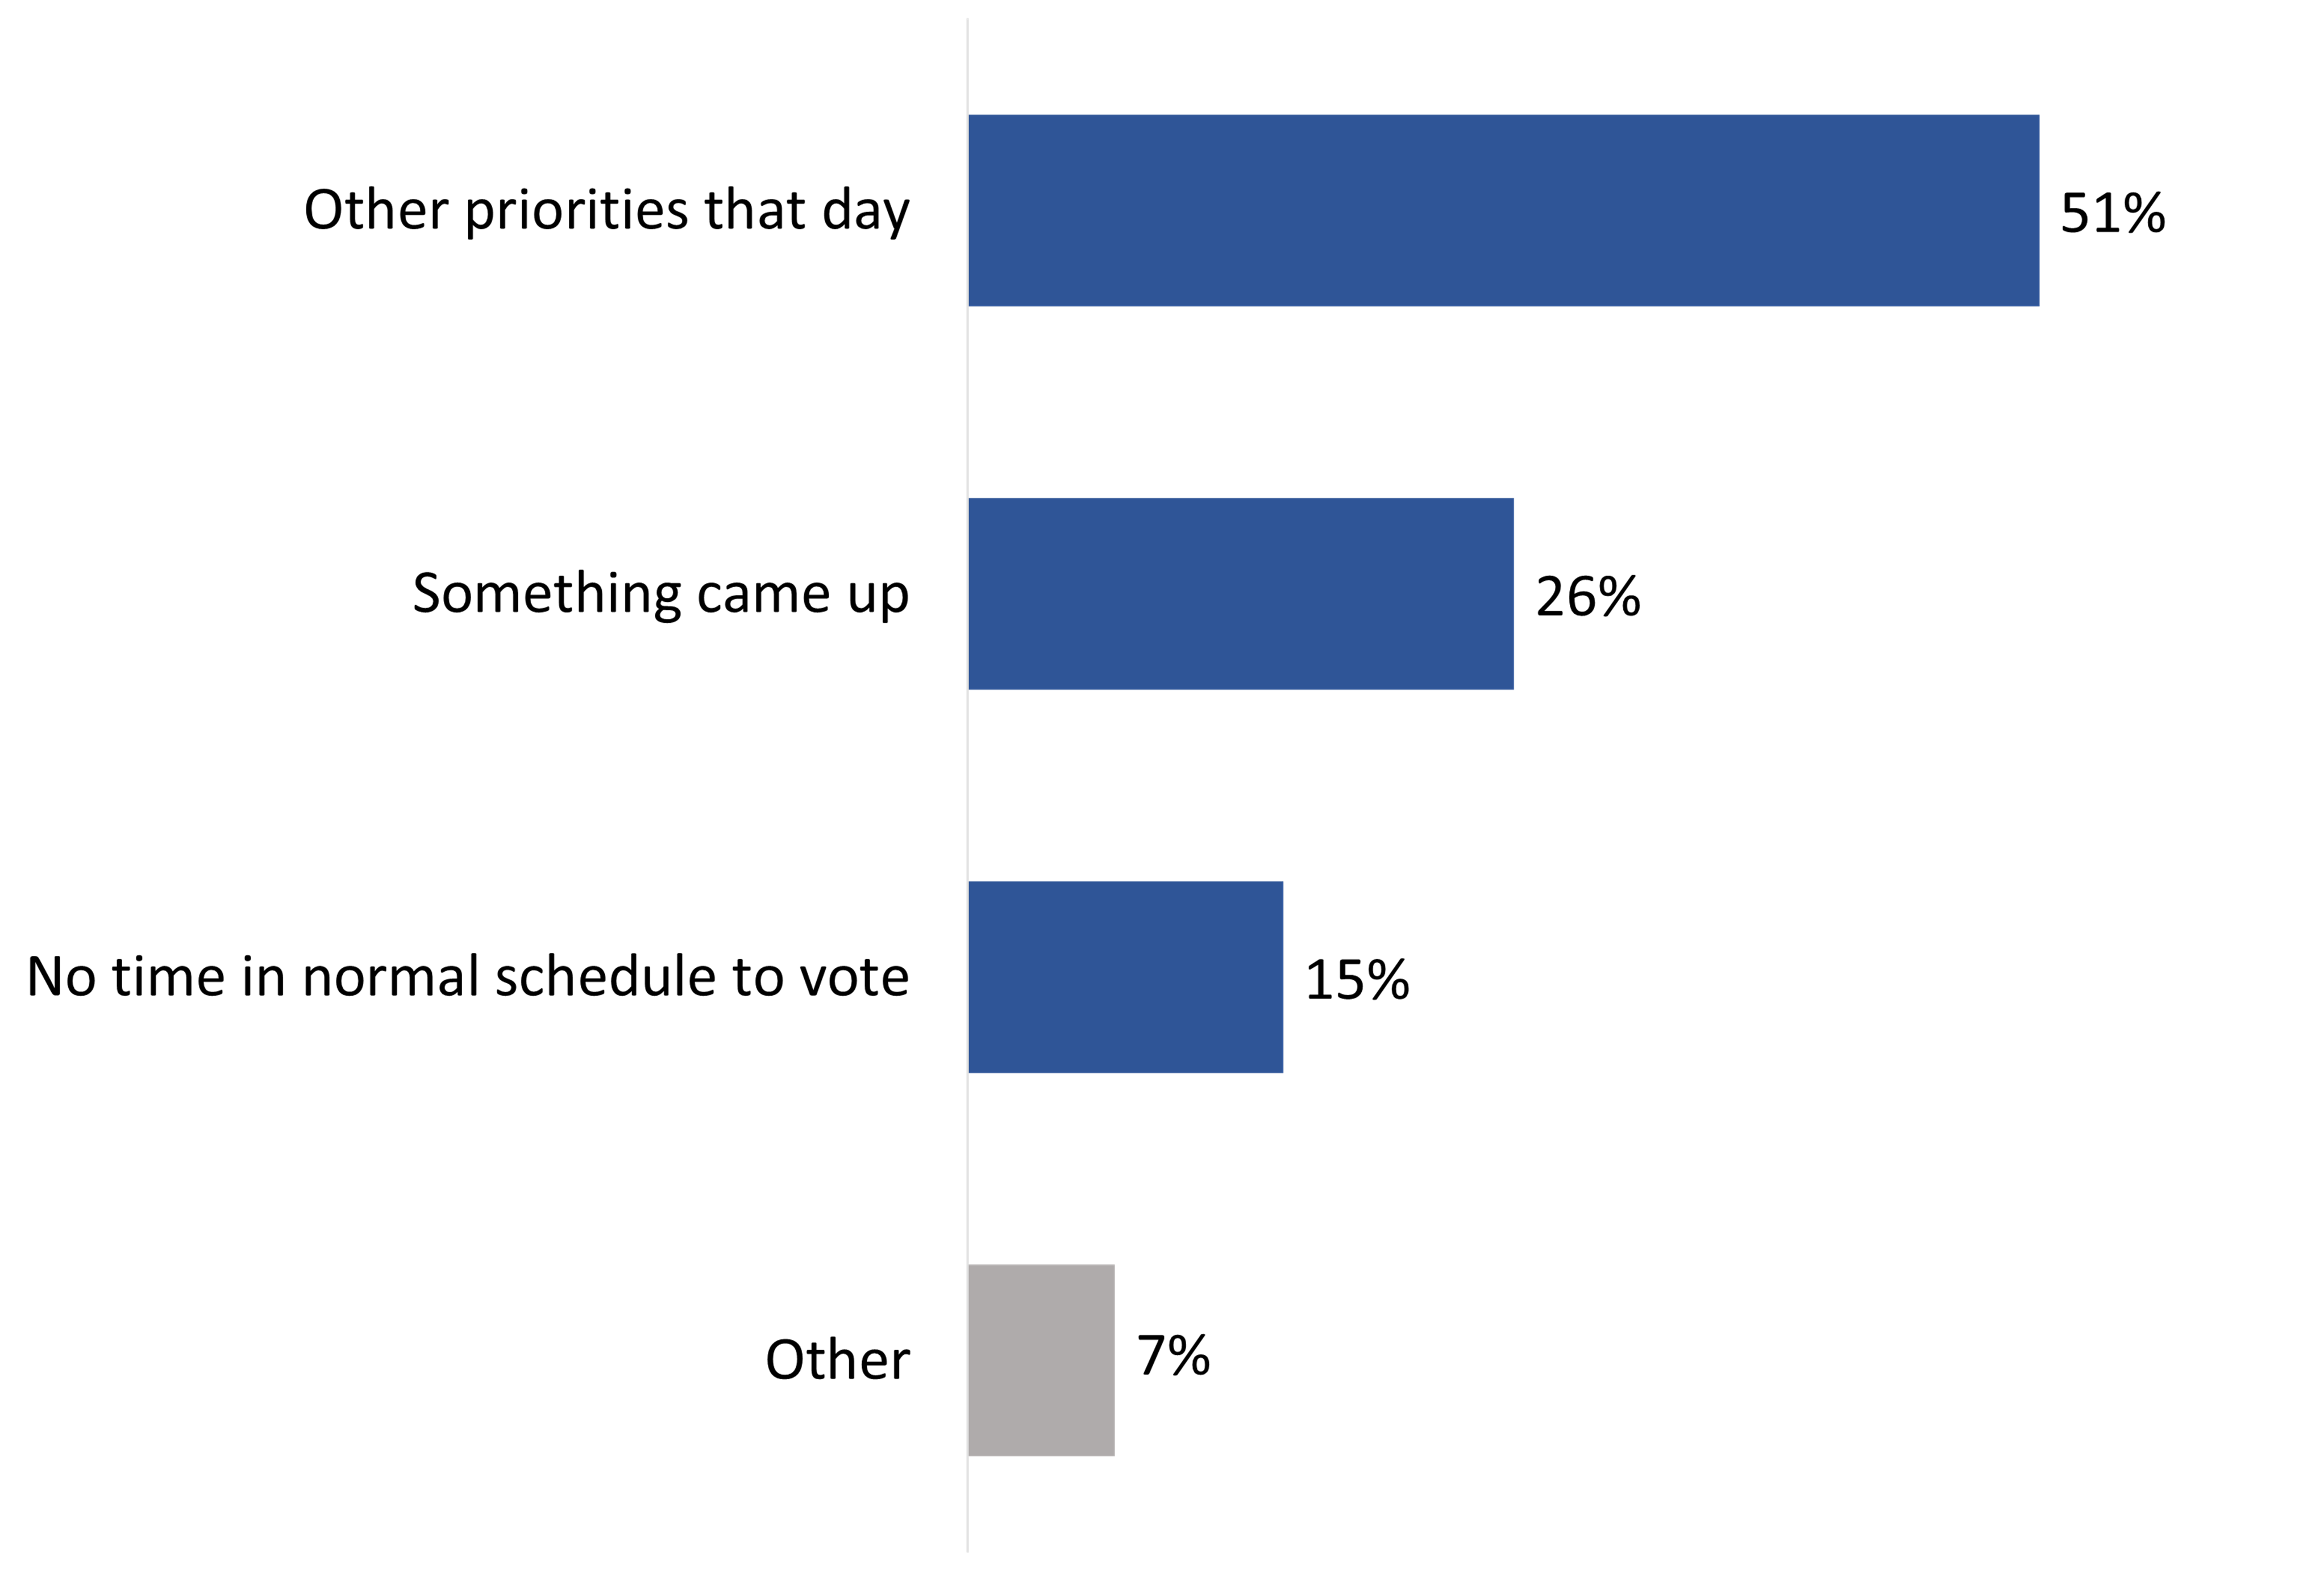
Q. You said you were too busy to vote. If you had to choose, which of the following most closely reflects your situation? Would it be? Base: n=85; respondents who were too busy to vote [Dk/nr: 2%]
This horizontal bar chart shows the reasons for not voting among respondents who mentioned being too busy to vote as their main reason. The breakdown is as follows:
Total
Six in 10 (61%) electors who said they voted in the by-election reported doing so at a polling station on election day, while just over one-third (36%) reported going to an advance polling station to vote. Very few reported voting at a local Elections Canada office (2%) or by mail (1%). Voters in the riding of Notre-Dame-de-Grâce-Westmount (42%) were more likely than those from the ridings of Oxford (32%) and Portage-Lisgar (33%) to have gone to an advance polling station to vote in the by-election.
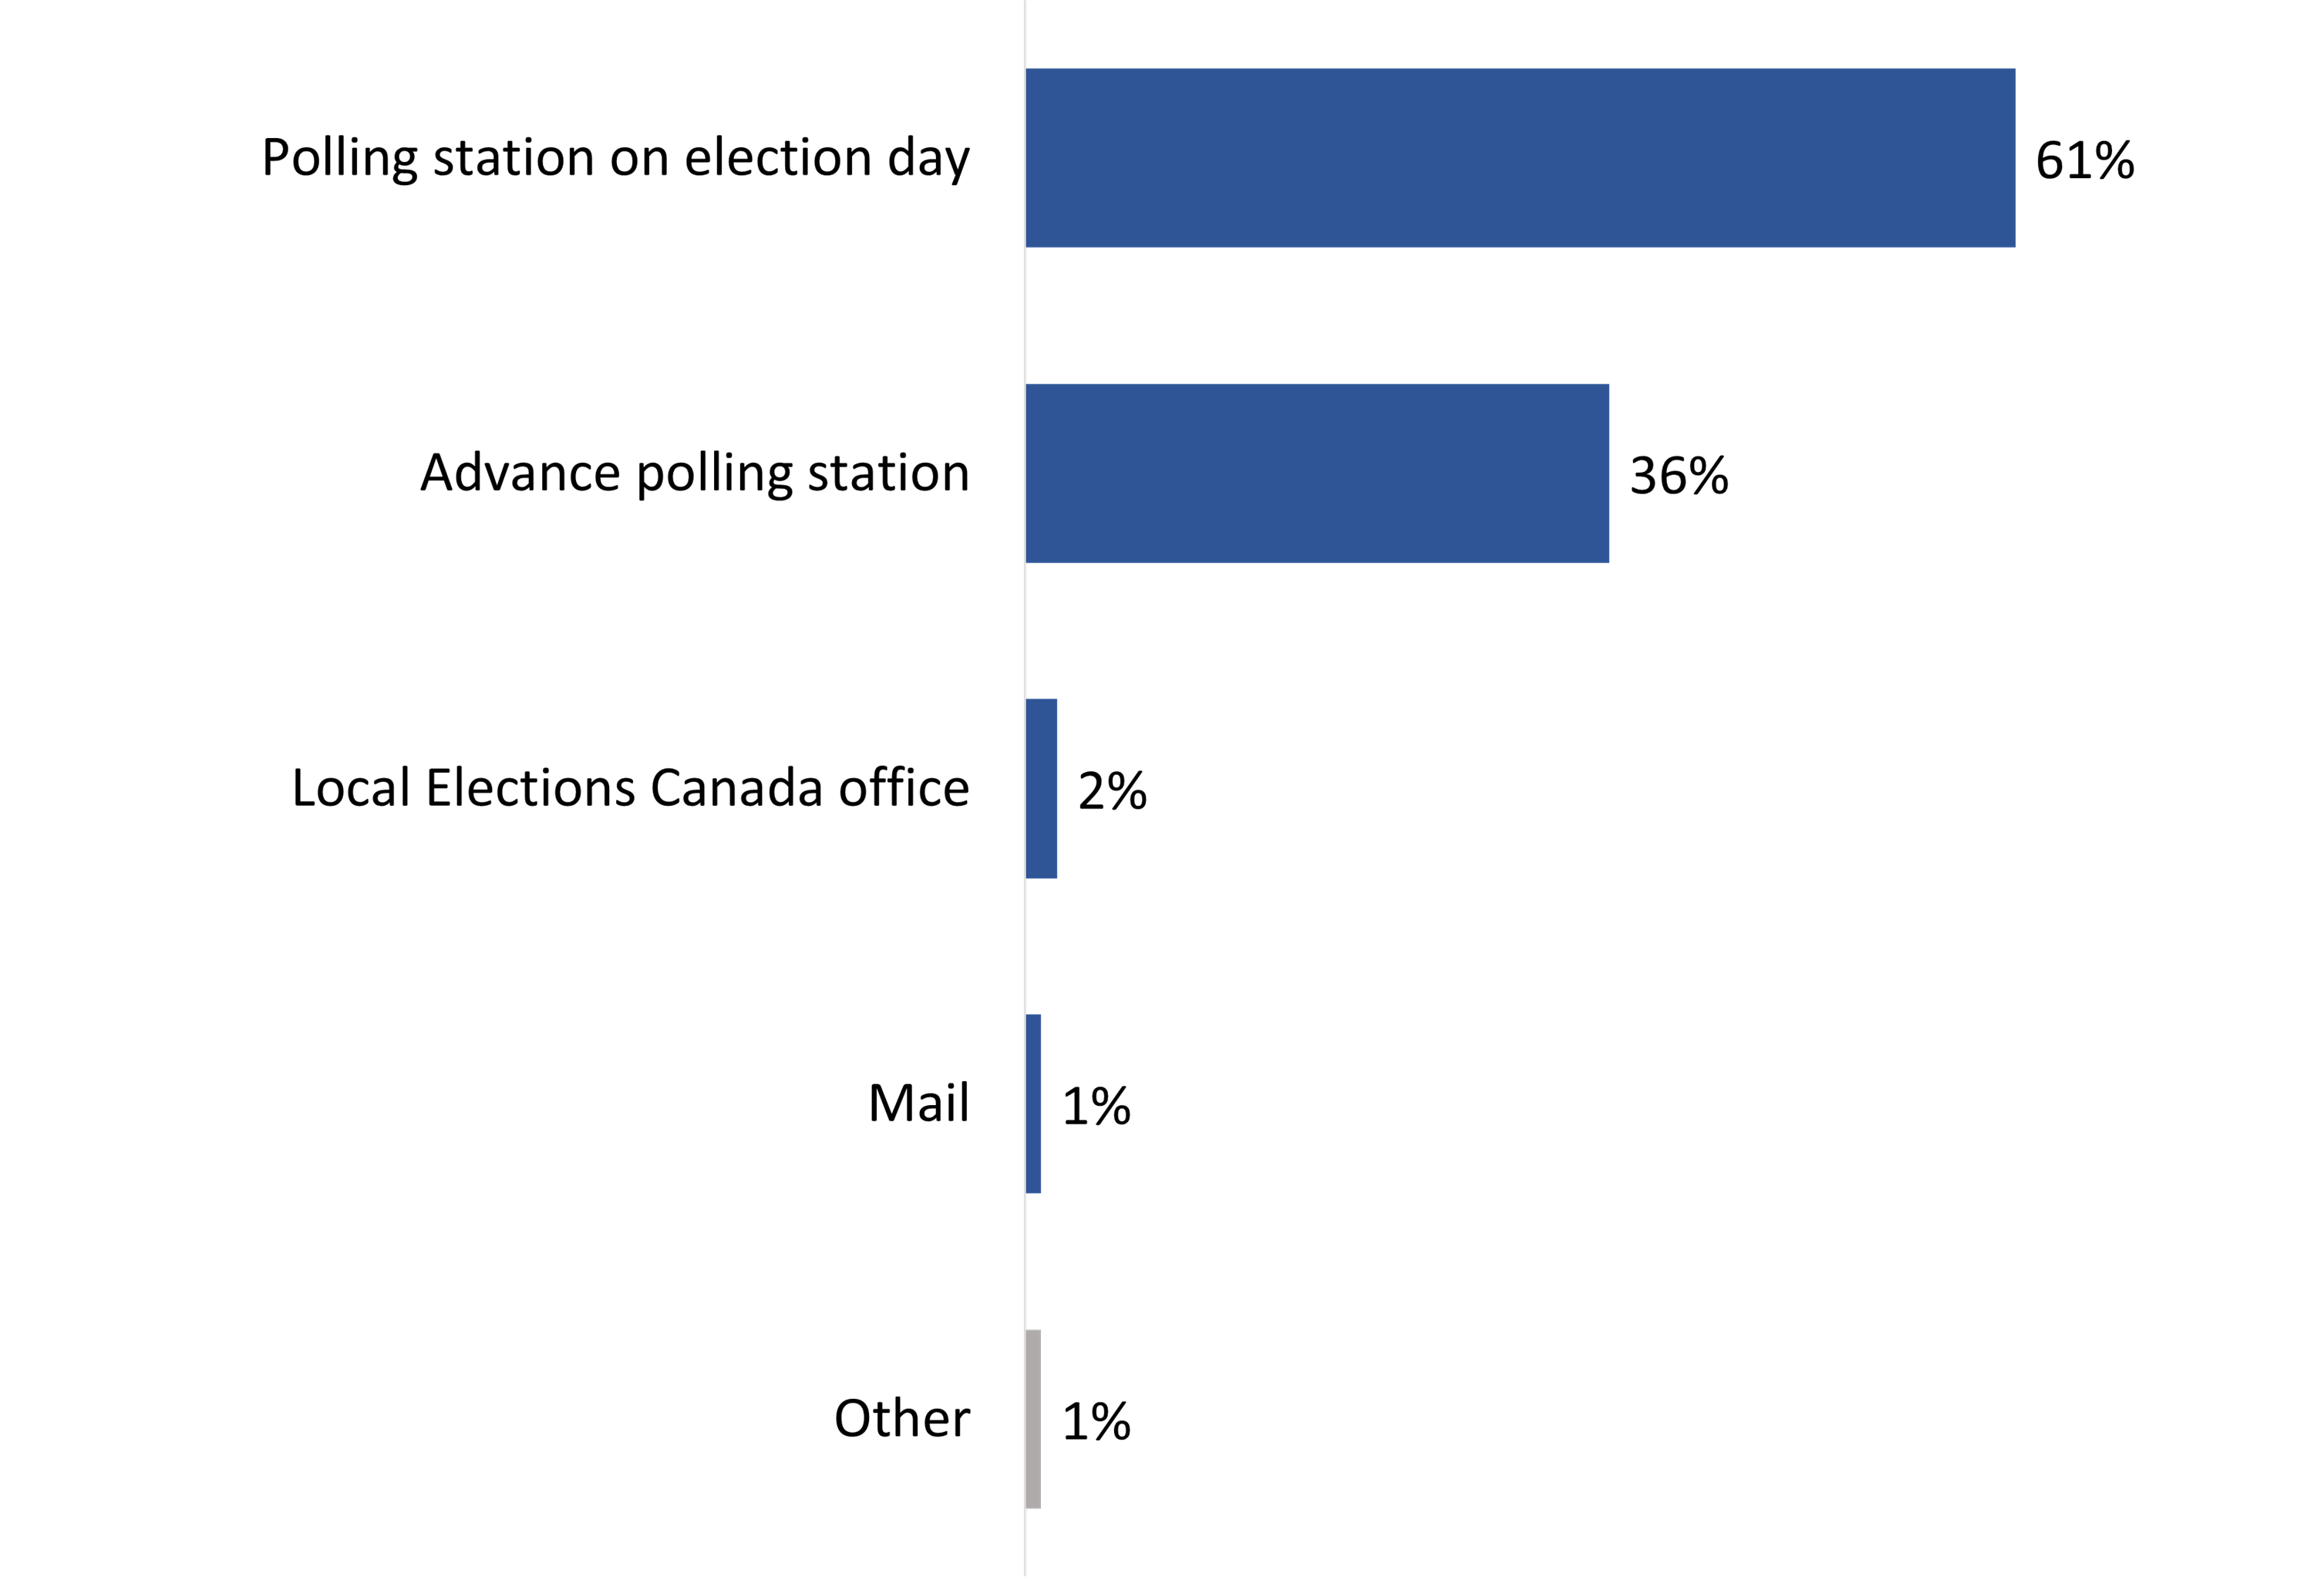
Q. Which method did you use to vote? Was it? Base: n=1,435; respondents who voted.
This horizontal bar chart shows the percentage of respondents who used a method to vote. The breakdown is as follows:
Total
Electors aged 18 to 34 were more likely to have voted on election day (73% versus 65% of 35–54-year-olds and 53% of those aged 55+), while those who are retired were more likely to have voted at advance polls (48% versus 31% of electors that are employed). University graduates (41%) were more likely to have voted at advance polls than electors with less education (29% of those with high school or less and 33% of those with some post-secondary education or college).
Seven in 10 (70%) of those who said they voted in personfootnote 4 (n=1,409) reported doing so between noon and 9:00 p.m., 29% between noon and 4 p.m., and 41% between 4 p.m. and the closing of the polls.
Of the voters who voted on election day (n=826), almost one-quarter each reported voting in the morning from the opening of the polls until noon (23%), or in the afternoon between noon and 4 p.m. (24%). Approximately half (49%) reported voting in the evening (from 4 p.m. until the closing of the polls). The rest (3%) could not recall what time it was when they went to vote.
Three in 10 of those who voted at an advance polling station (n=550) reported doing so in the morning (30%) or in the evening (30%). Just over one-third (35%) reported voting in the afternoon, while six percent could not recall what time it was when they went to vote.
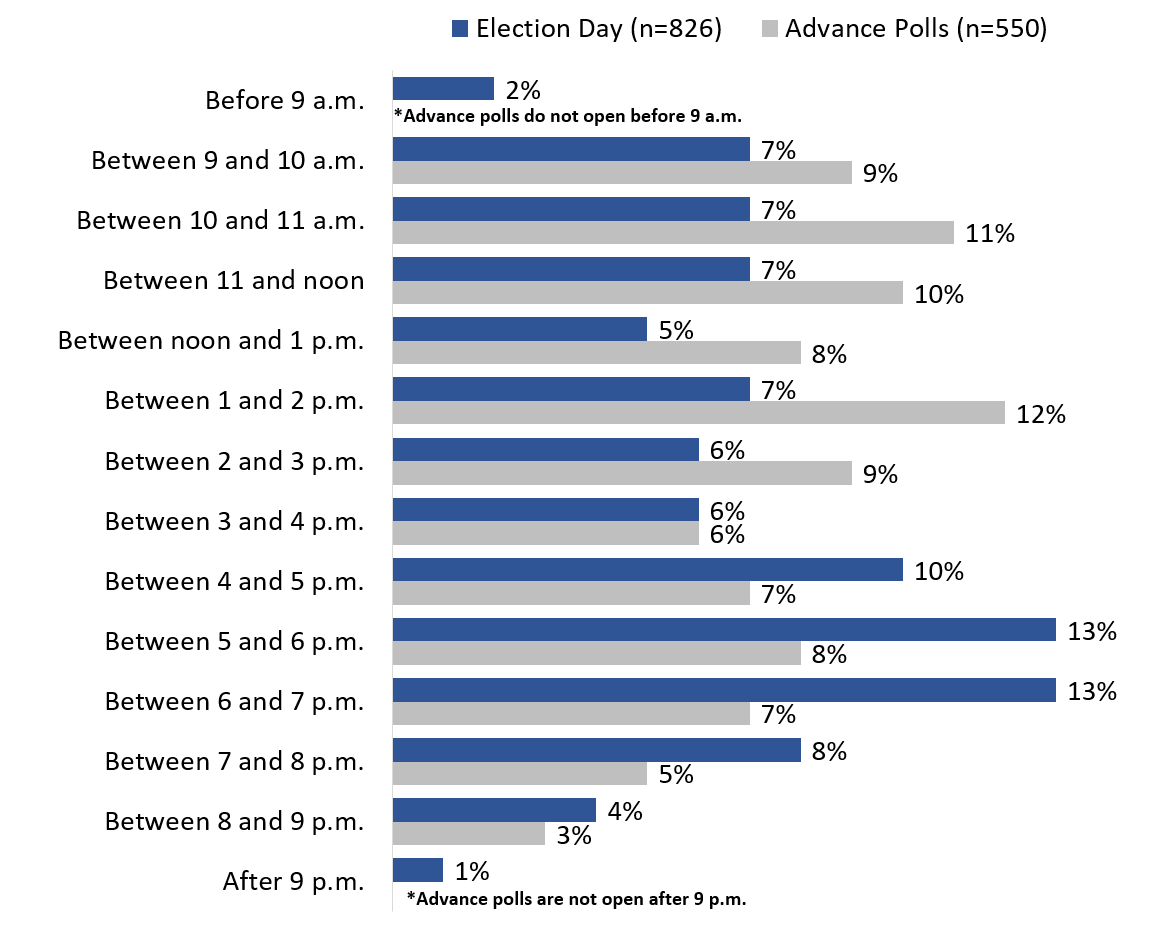
Q. Do you remember approximately what time it was when you went to vote at the [polling station/advance polling station/local Elections Canada office]? Base for the graph: respondents who voted in person on Election Day or at an advance poll.
The horizontal bar chart shows the time of day that electors went to vote, comparing those who voted on Election Day (the blue or top bar) to those who voted at advance polls (grey or the bottom bar). The breakdown is as follows:
Total
Among those who voted in person (n=1,409)footnote 5, six in 10 (60%) said it took five minutes or less to travel to the polling station, advance polling station, or local Elections Canada office, while nearly three in 10 (28%) said it took between six and 10 minutes. Few reported that it took more than 10 minutes for them to travel to the polling place.
Voters in the riding of Notre-Dame-de-Grâce-Westmount (46%) were less likely to report a travel time of five minutes or less compared to voters in the ridings of Portage-Lisgar (71%), Calgary Heritage (66%), and Winnipeg South Centre (60%).
Figure 19 presents reported travel time broken out by voting place: to a polling station on election day or to an advance polling station. Those who voted at a polling station on election day (63%) were more likely than those that voted at an advance polling station (57%) to say it took them five minutes or less to travel to the polling place.
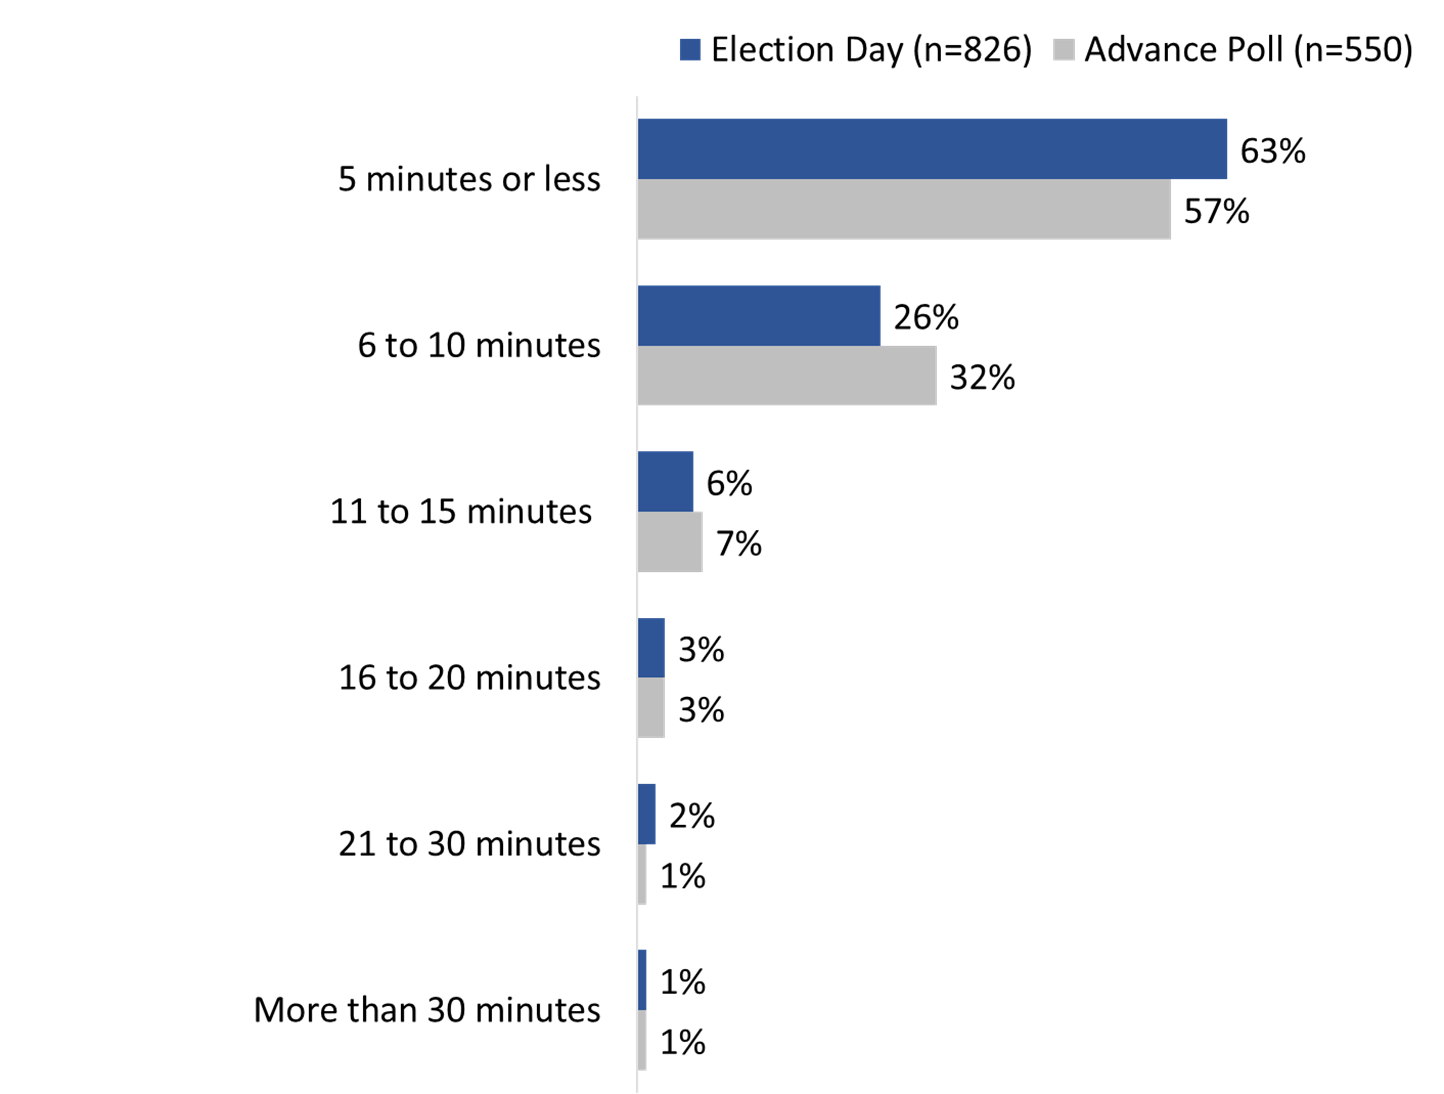
Q. To the best of your knowledge, how long did it take you to travel to the [polling station/advance polling station/local Elections Canada office]? Base for the graph: respondents who voted in person on Election Day or at an Advance Poll.
This horizontal bar chart shows how long it took respondents to travel to vote, comparing voting on Election Day (blue or top bar) to voting at advance polls (grey or bottom bar). The breakdown is as follows:
Ninety-eight percent of voters said the distance to the polling station from their home was at least somewhat reasonable, with 88% saying the distance was very reasonable. Voters in the ridings of Oxford (83%) and Notre-Dame-de-Grâce-Westmount (87%) were less likely than voters from the riding of Portage-Lisgar (94%) to say the polling station was a very reasonable distance from their home.
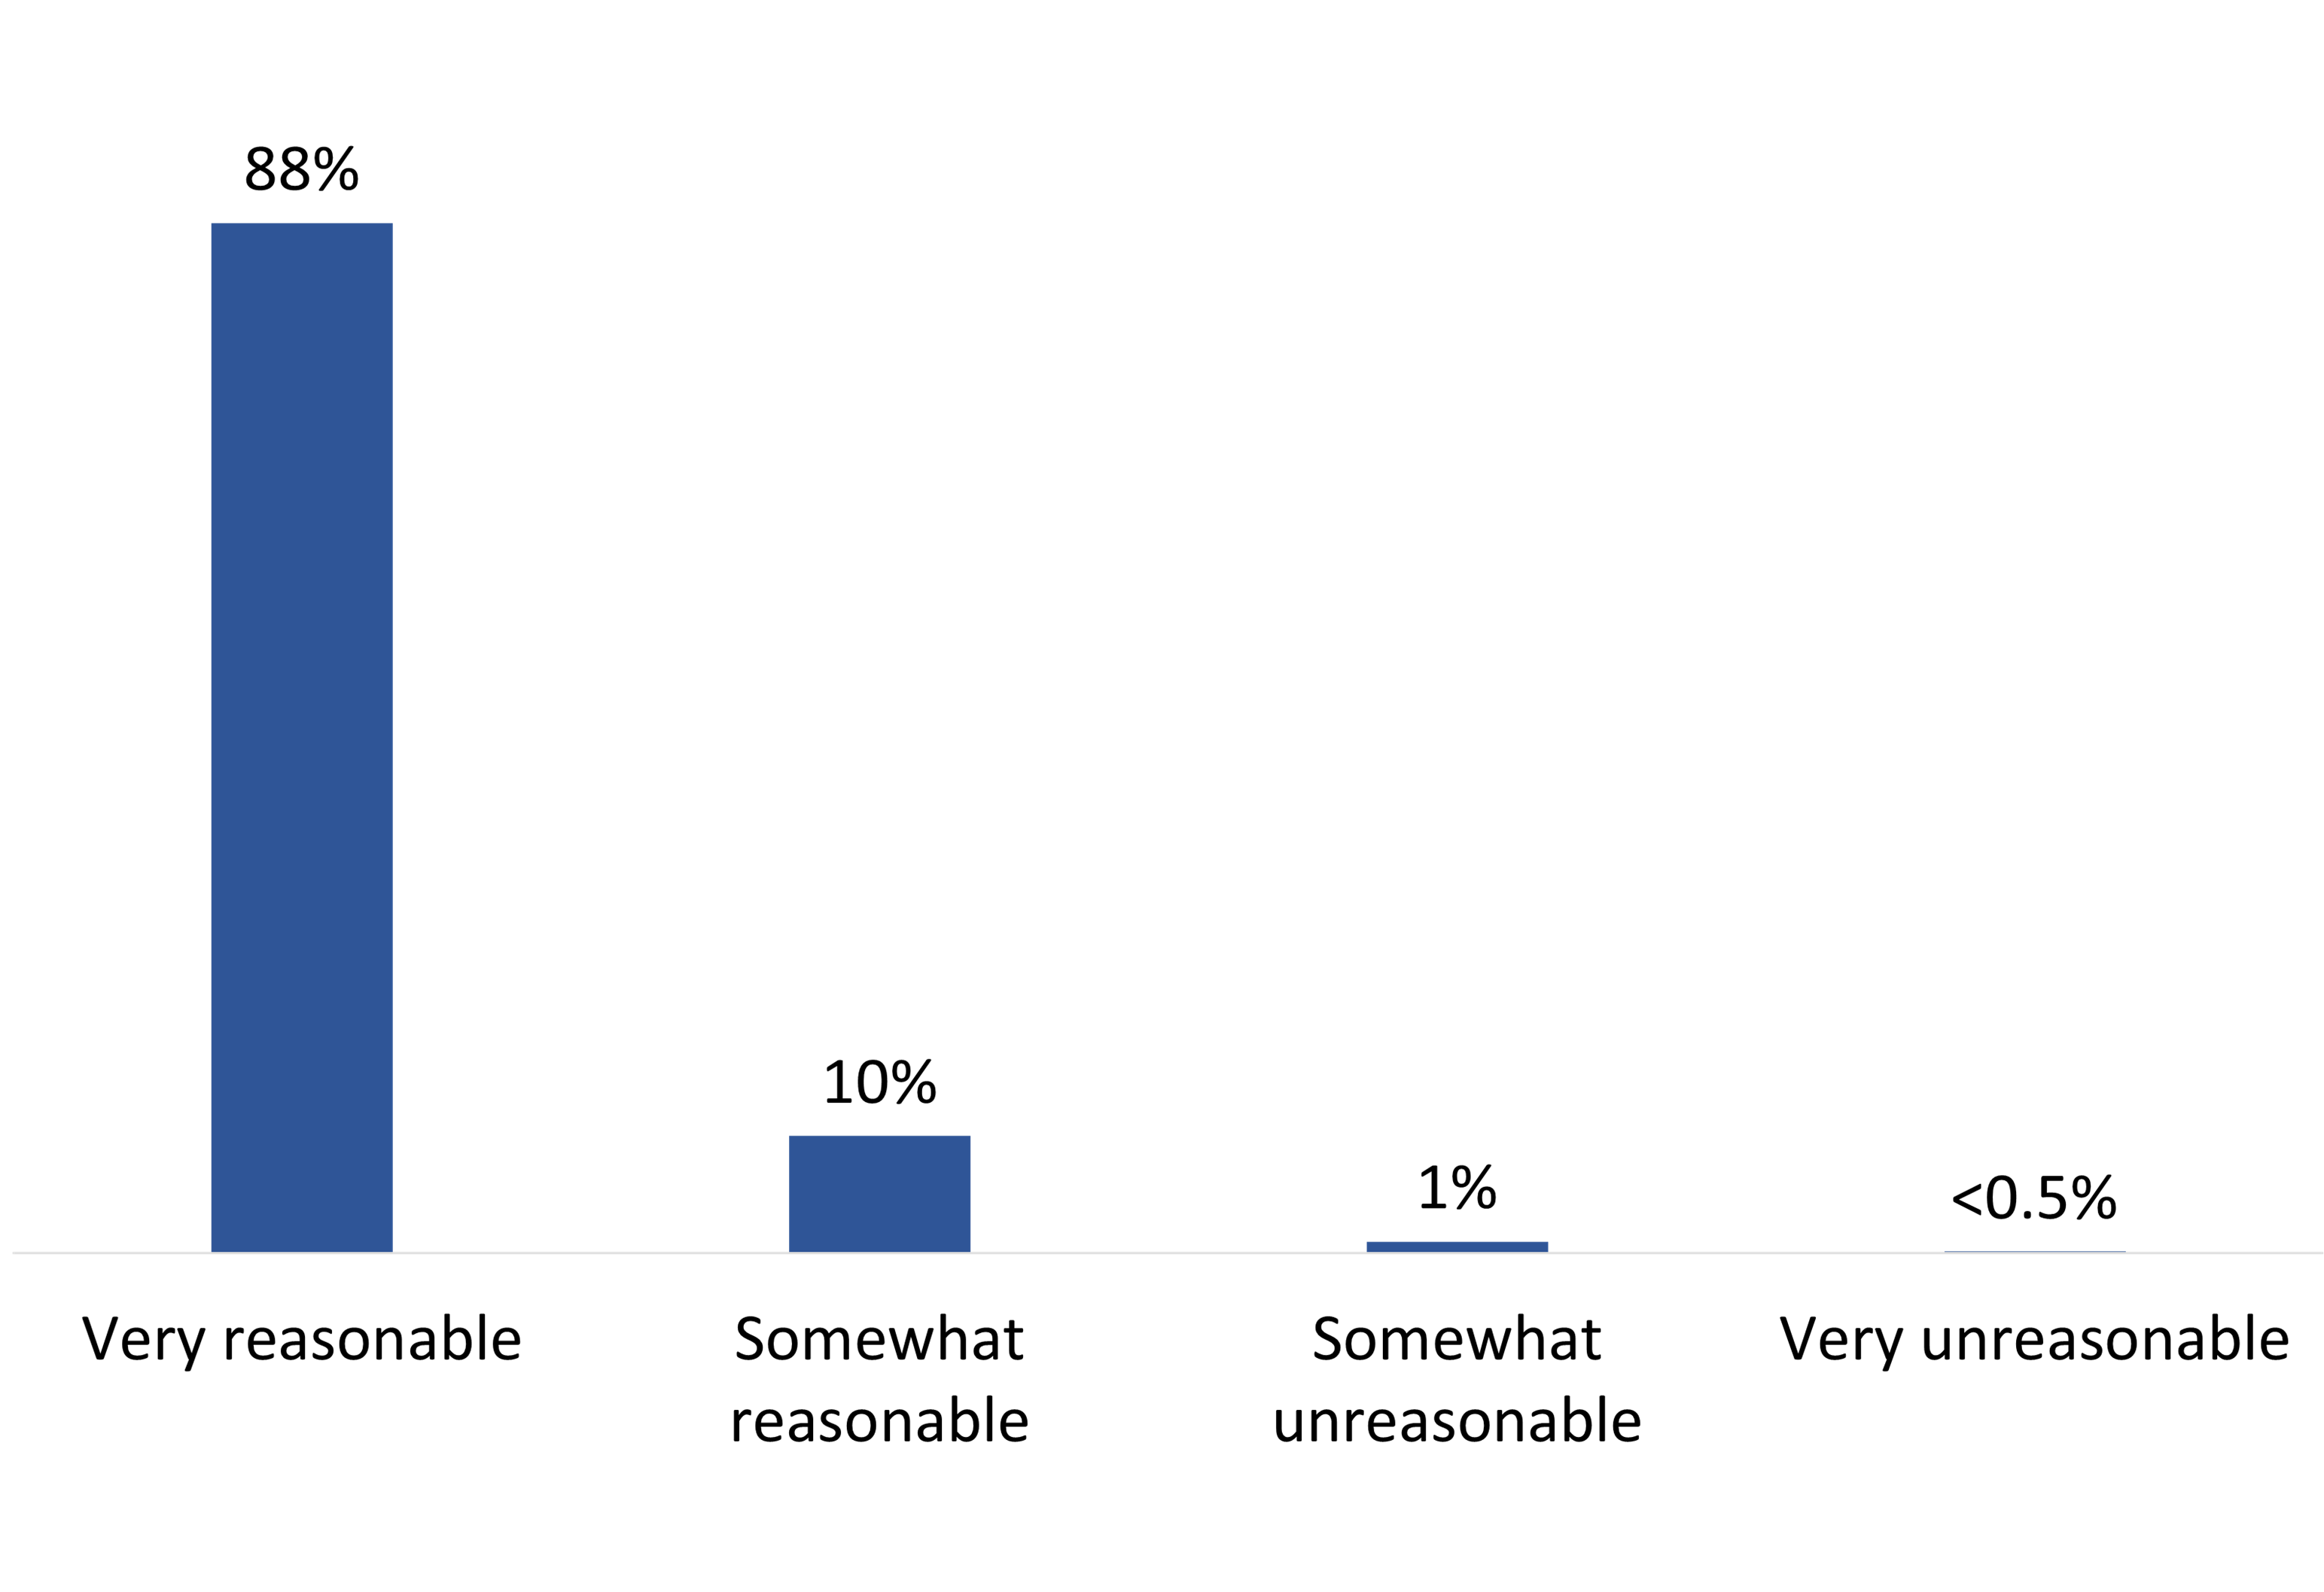
Q. Was the [polling station/advance polling station/local Elections Canada office] a very reasonable, somewhat reasonable, somewhat unreasonable, or very unreasonable distance from your home? Base: n=1,409; respondents who voted in person. [Dk/nr: 2%]
This horizontal bar chart shows the percentage of respondents who found the travel time to vote at their polling station to be reasonable. The breakdown is as follows:
Total
Electors less likely to report that the distance to the polling station was very reasonable included 18- to 34-year-olds (83% compared to 90% of those aged 35+) and men (86% compared to 90% of women).
Nearly everyone (97%) who voted at a polling station, advance polling station, or local Elections Canada office said the building where they voted was at least somewhat suitable, with 85% saying it was very suitable. Those who voted in the electoral district of Portage-Lisgar were the most likely to say the building was very suitable (94% versus 76% of electors from Winnipeg South Centre, 81% from Notre-Dame-de-Grâce-Westmount, 86% from Oxford, and 87% from Calgary Heritage).
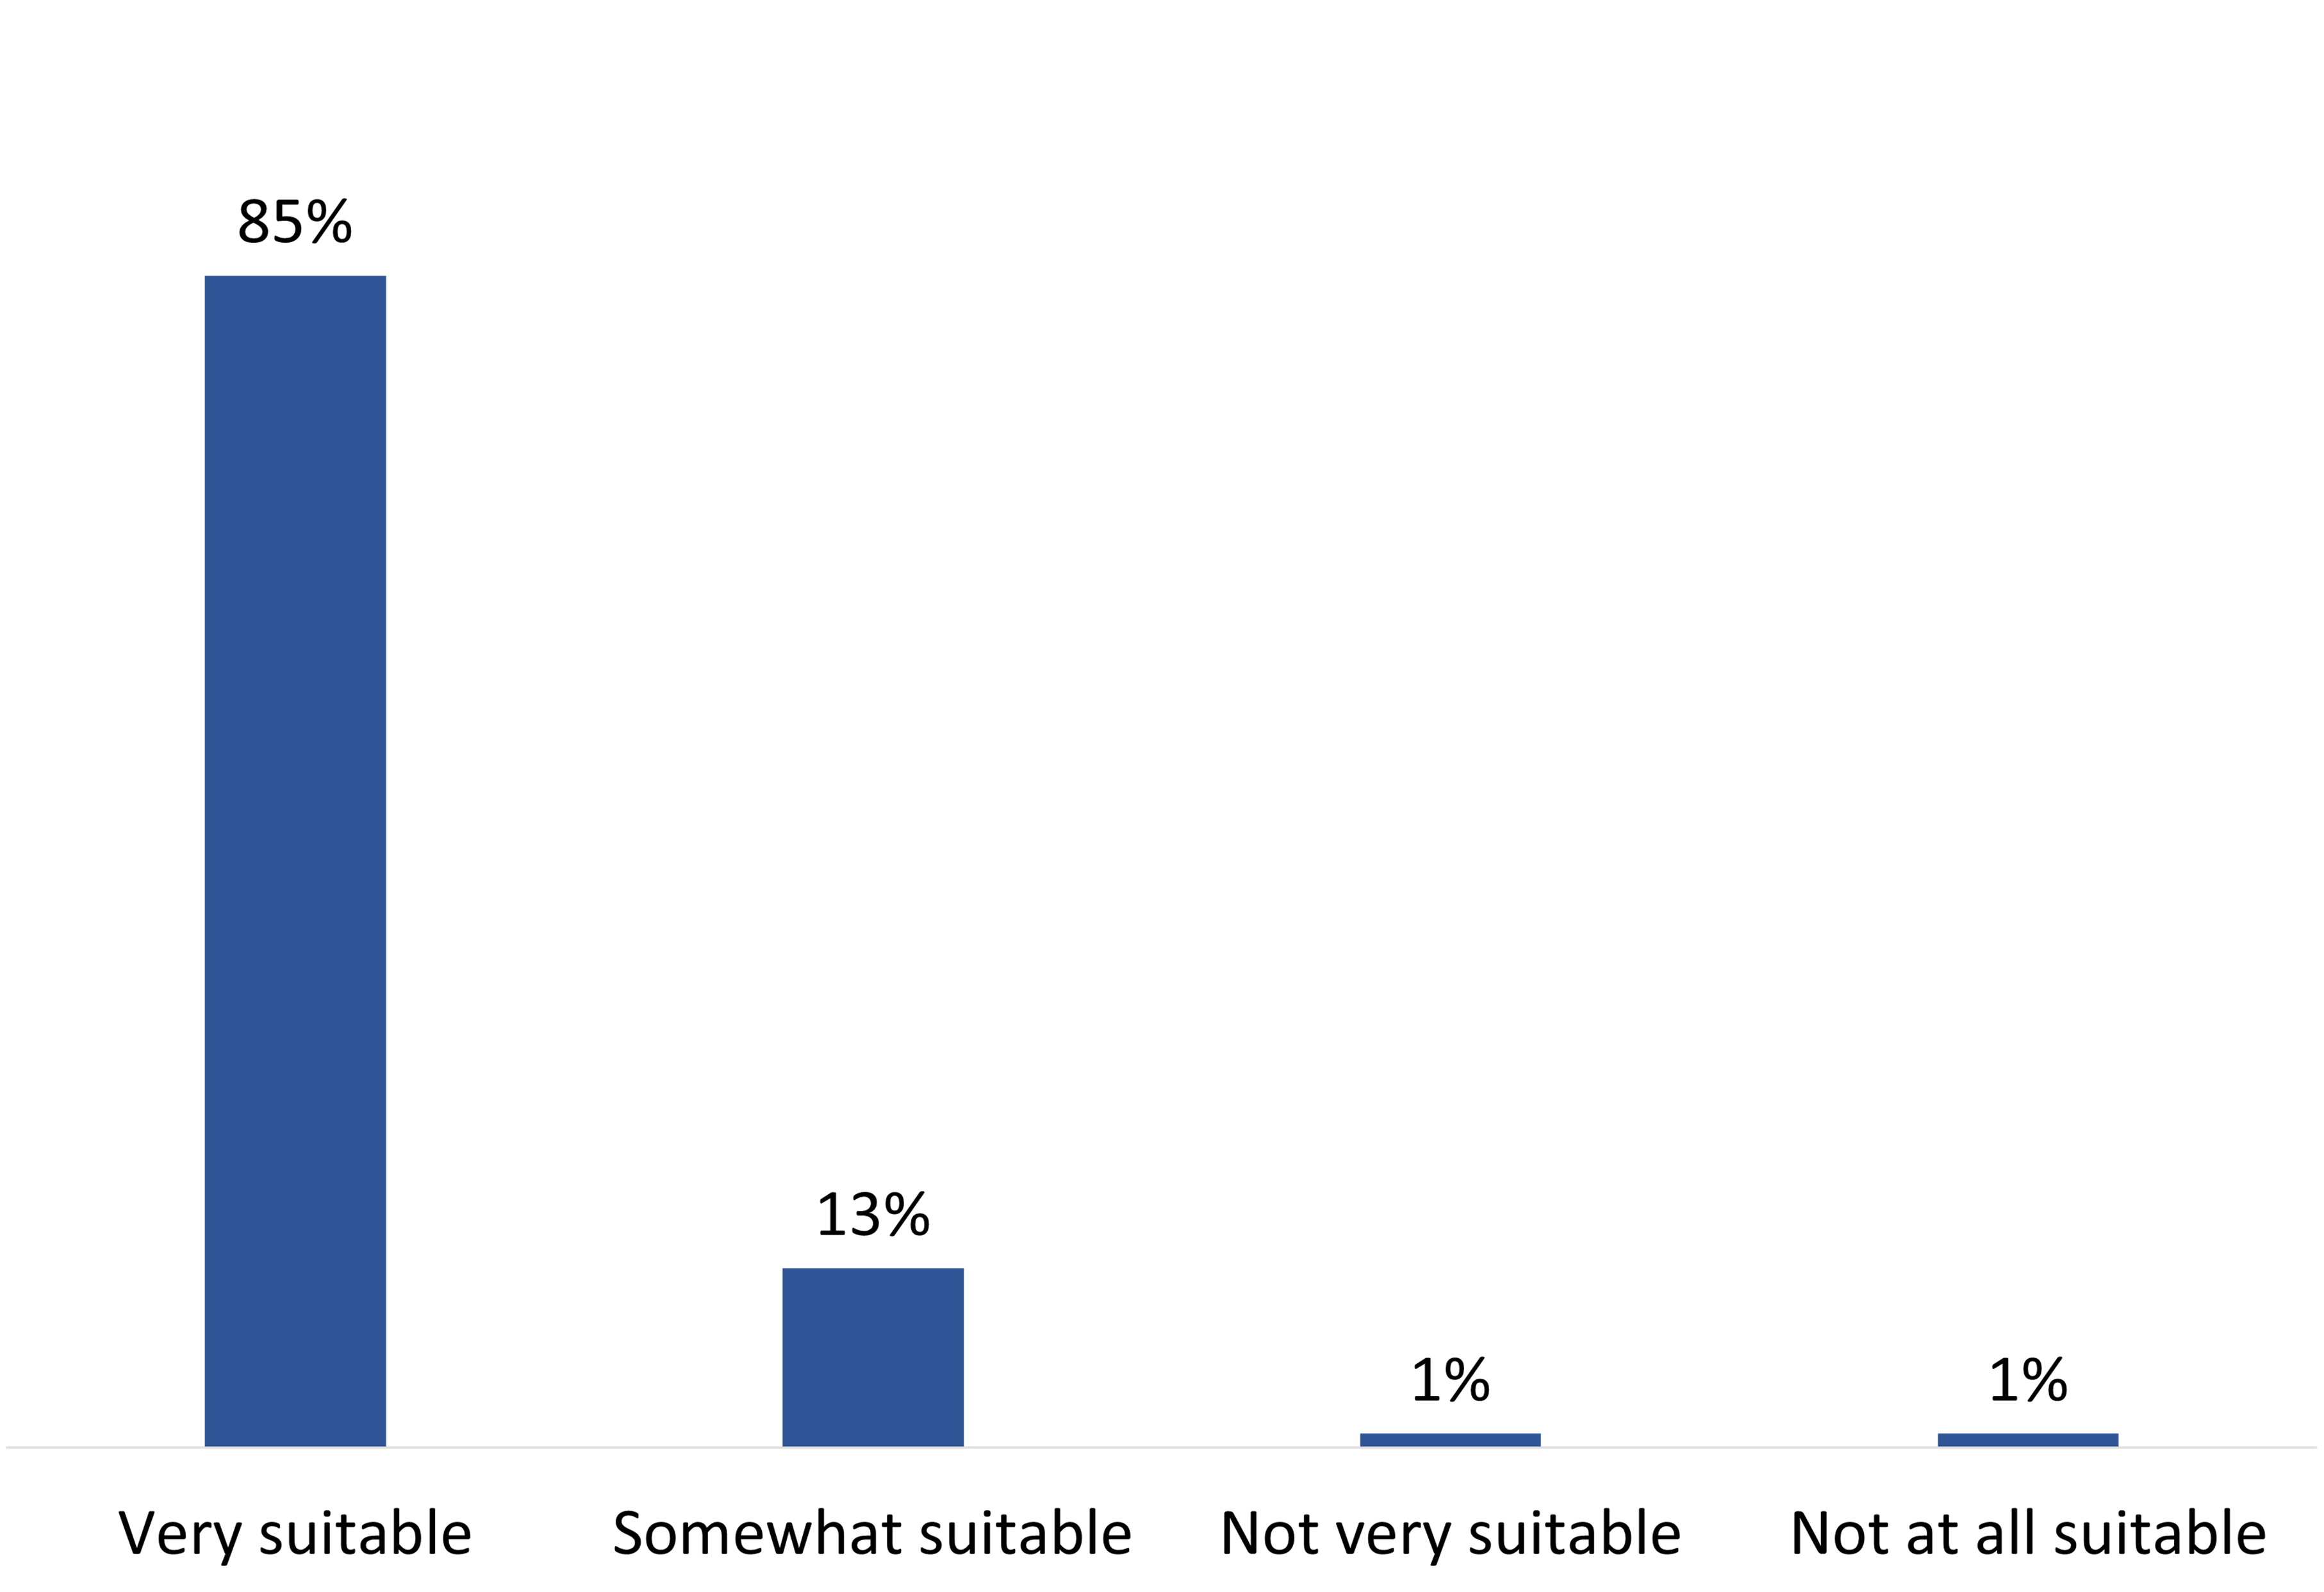
Q. Would you say that the building where you voted was...? Base: n=1,409; respondents who voted in person.
This vertical bar chart shows the percentage of respondents who found the voting facilities suitable. The breakdown is as follows:
Voters less likely to report that the building was very suitable included 18- to 34-year-olds (80% compared to 87% of those aged 35+) and those who often or always (78%) or sometimes (84%) must limit their daily activities due to a physical condition, sensory impairment, pain, or mental health issue (compared to 87% of those who never have to limit their activities).
Nearly two-thirds of those who voted in the by-election said voting took them five minutes or less (65%), with most of the rest saying it took them between six and 15 minutes (30%). Four percent reported taking more than 15 minutes to vote. Voters from the riding of Winnipeg South Centre (54%) were least likely to report taking five minutes or less to vote (versus 67% of voters from each of Notre-Dame-de-Grâce-Westmount and Oxford, 69% from Portage-Lisgar and 70% from Calgary Heritage).
As presented in Figure 22, there were virtually no differences between the estimated amount of time it took to vote once electors arrived at a polling station on either election day or an advance voting day.
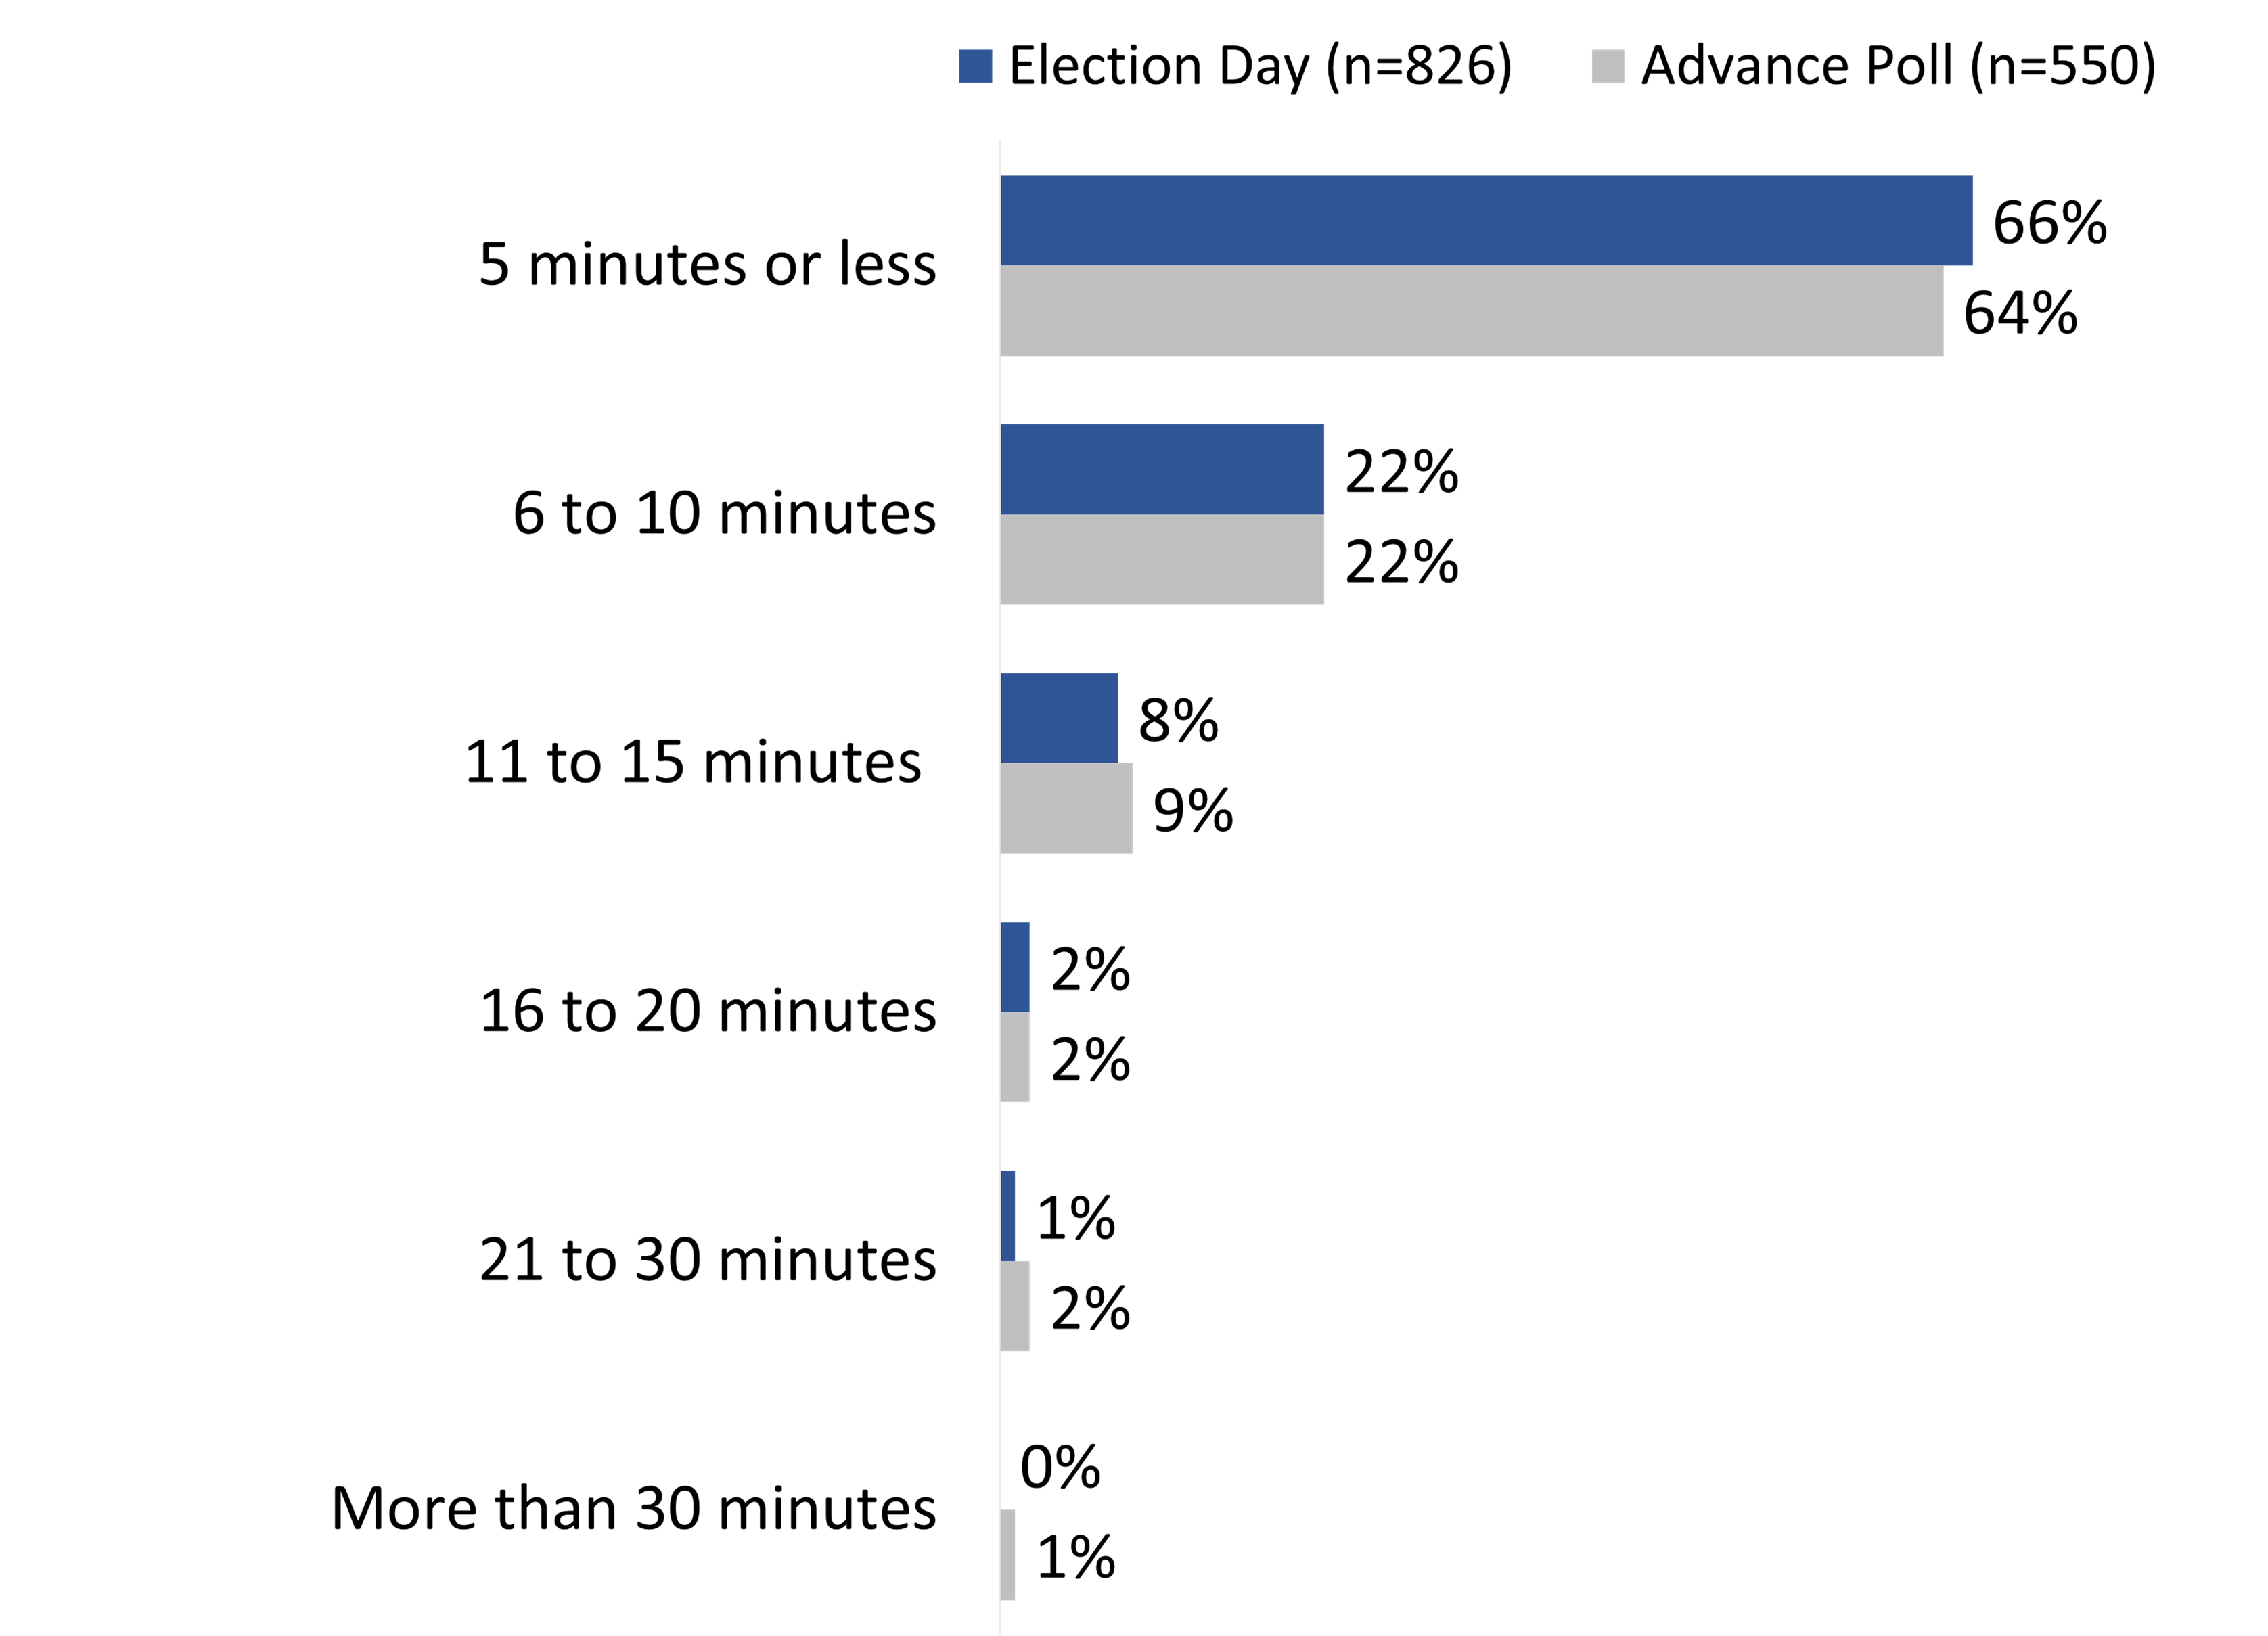
Q. To the best of your knowledge, how long did it take you to vote once you arrived at the [polling station/advance polling station/local Elections Canada office]? Base: n=1,403; respondents who voted in person on election day or at advance polls.
This horizontal bar chart shows how long it took respondents to vote, comparing Election Day (blue or the top bar) to Advance polls (grey or bottom bar). The breakdown is as follows:
Total
Those who never have to limit their activities due to a physical condition, sensory impairment, pain, or mental health issue (68%) were more likely than those who sometimes need to limit activities (60%) to report having spent five minutes or less voting.
Virtually all voters (97%) noted that voting took a reasonable amount of time. Voters from the riding of Winnipeg South Centre were least likely to say that the time it took for them to vote was reasonable: 92% compared to 97% of voters in the riding of Notre-Dame-de-Grâce-Westmount and 98% of voters in each of Oxford, Portage-Lisgar, and Calgary Heritage.
Among electors who received their voter information card and voted in person (n=1,356), eighty-nine percent said they brought their VIC with them to the voting location. Voters in the riding of Calgary-Heritage were the least likely to have brought their VIC to vote (79%). In contrast, at least nine in 10 voters in the other ridings reported bringing their VIC: Winnipeg South Centre (93%), Oxford (92%), Notre-Dame-de-Grâce-Westmount (91%), and Portage-Lisgar (90%).
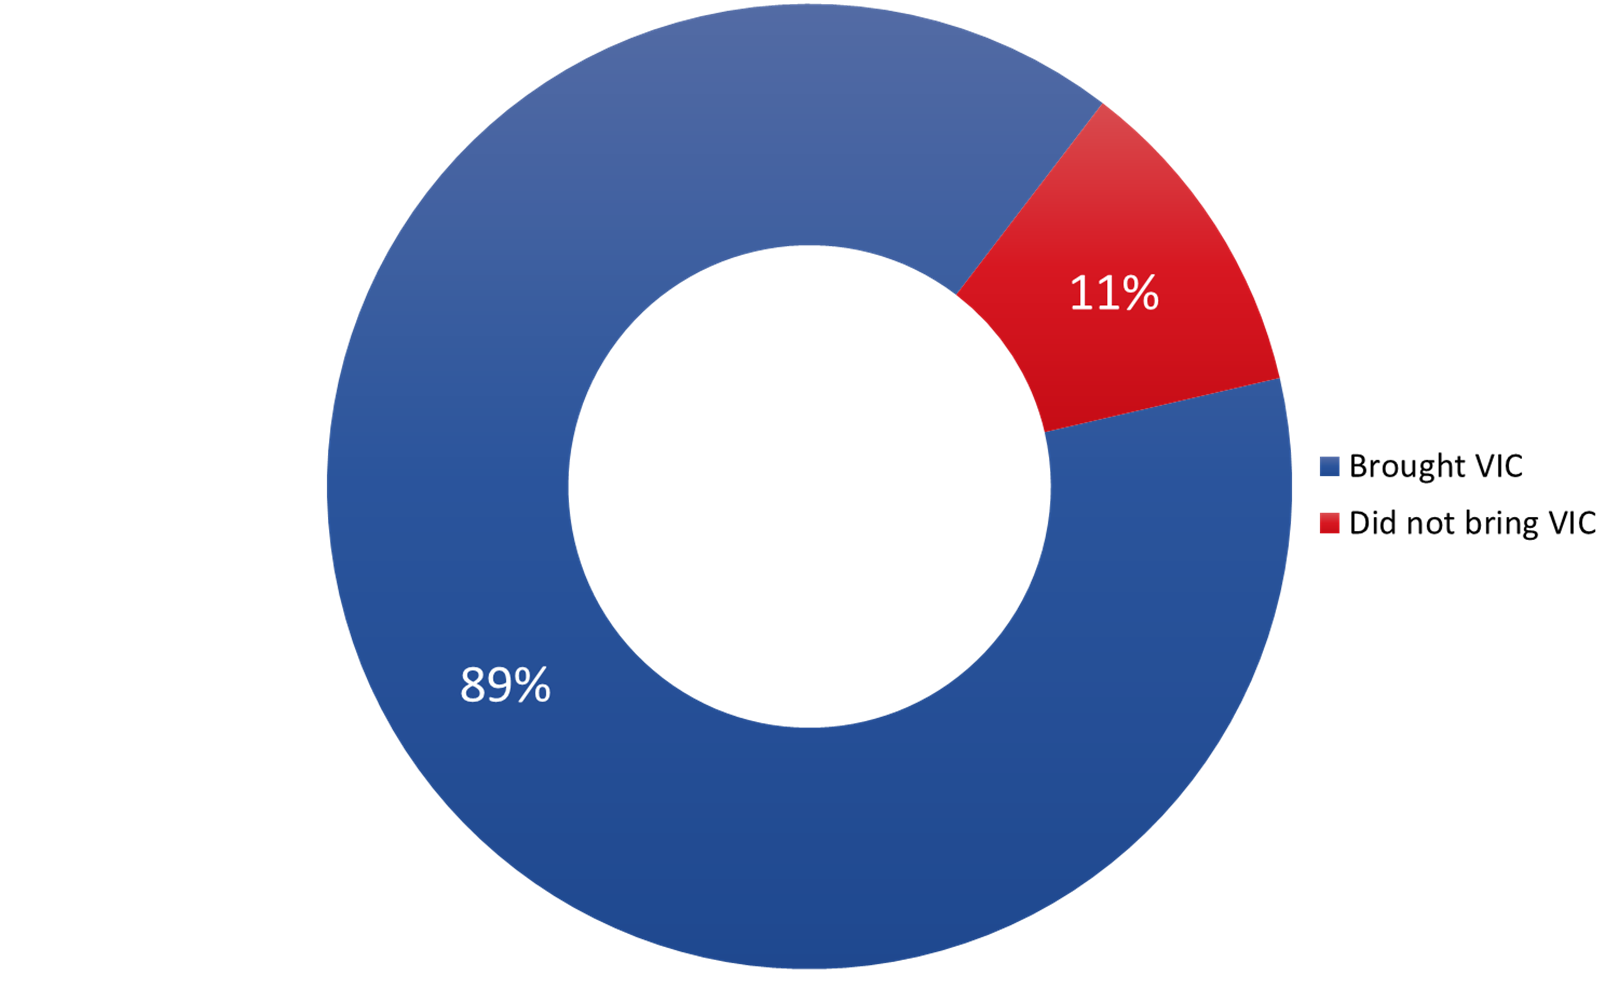
Q. Did you bring your voter information card with you to the [polling station/advance polling station/local Elections Canada office]? Base: n=1,356; respondents who got their VIC and voted.
This pie chart shows the percentage of those who voted who brought their voter information card, or VIC, to vote. Eighty-nine percent brought their VIC, while 11 percent did not bring their VIC.
Virtually all (99%) respondents who voted in the by-election found it easy to meet the identification requirements, with 95% describing it as very easy.
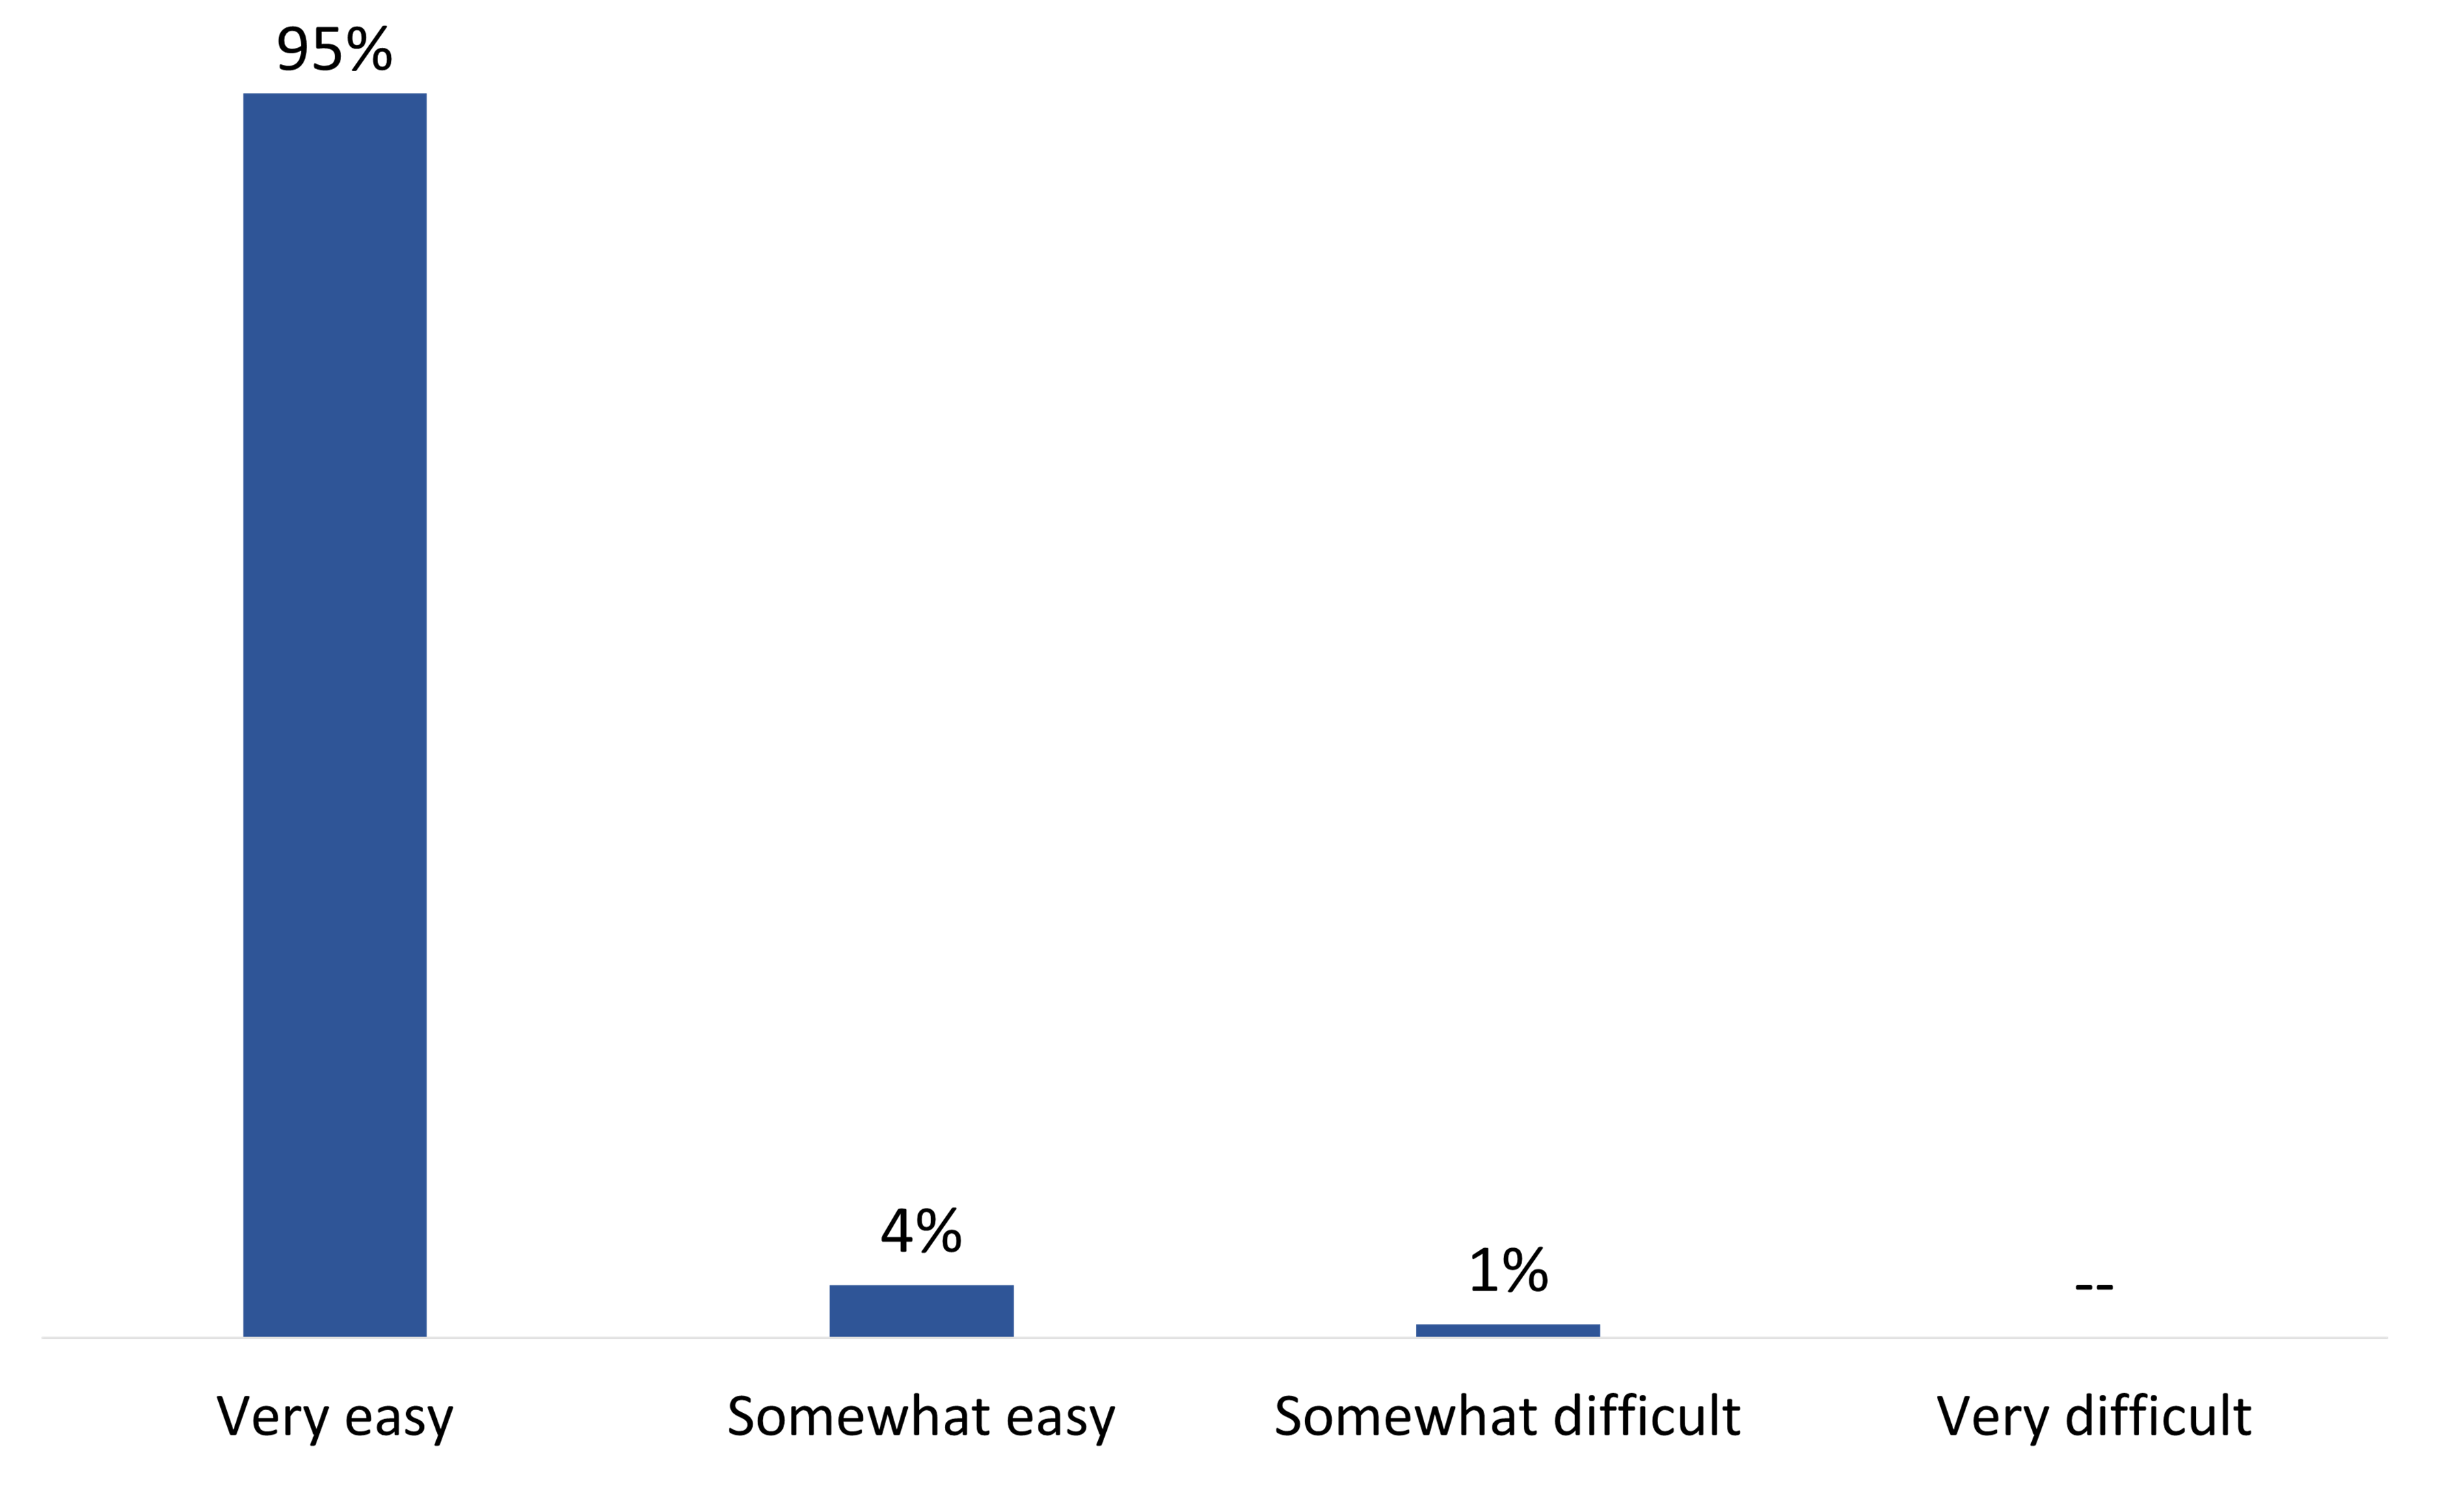
Q. Overall, was it very easy, somewhat easy, somewhat difficult or very difficult to meet the identification requirements when you voted? Base: n=1,435; respondents who voted.
This vertical bar chart shows the reported ease of meeting identification requirements for voters at polling stations by percentage. The breakdown is as follows:
Total
Ninety-six percent of respondents who voted in the by-election said the paper ballot was at least somewhat easy to complete, including 88% who said it was very easy. Very few (5%) said it was at least somewhat difficult to complete the ballot. Voters from Winnipeg South Centre were less likely than voters in the other ridings to have found the ballot easy to complete (83%) compared to virtually all voters in Portage-Lisgar (98%), Oxford (98%), Calgary Heritage (99%), and Notre-Dame-de-Grâce-Westmount (99%). In Winnipeg South Centre, there was a total of 48 candidates in the by-election, which required Elections Canada to use a modified large-format ballot paper with two columns of candidate names.
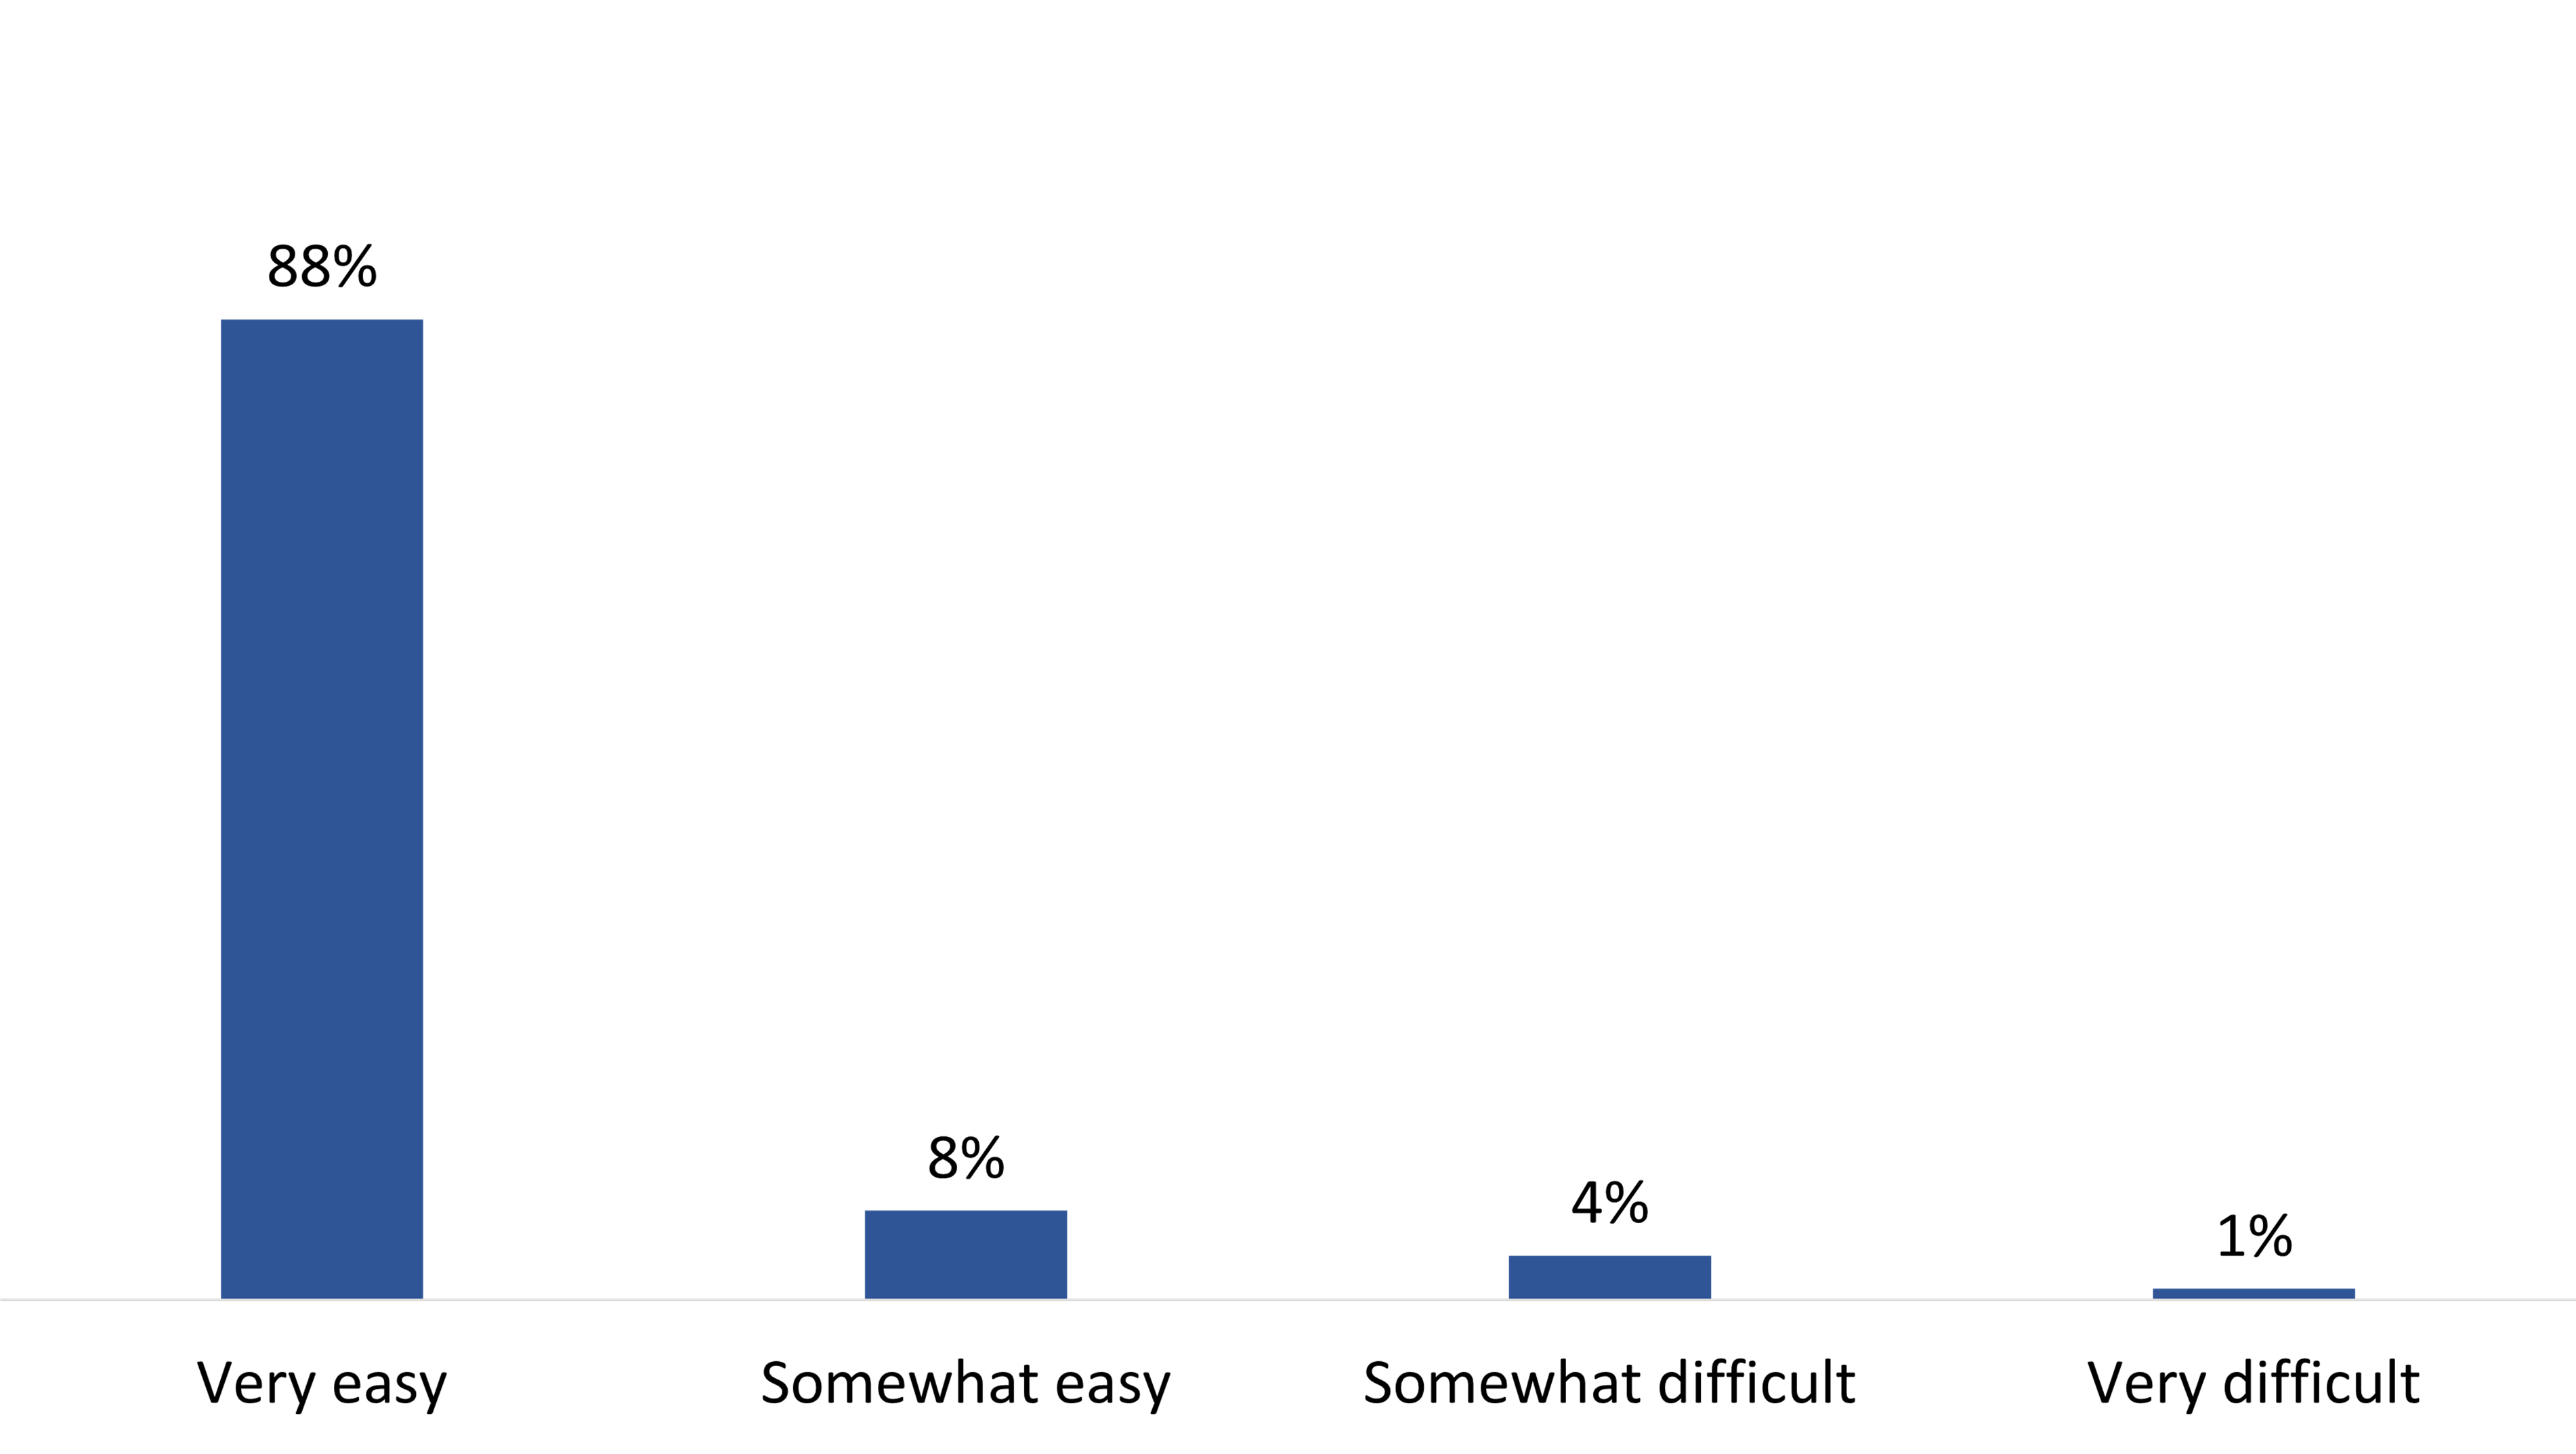
Q. Thinking about the paper ballot you used to vote in the by-election, was it very easy, somewhat easy, somewhat difficult or very difficult to complete your ballot? Base: n=1,435; respondents who voted.
This vertical bar chart shows how easy respondents said it was to use the paper ballot. The breakdown is as follows:
Total
Electors who reported that they often or always limit their daily activities due to a physical condition, a sensory impairment, pain, or a mental health issue were less likely to say it was easy to complete their ballot (90%) than those who limit their activities sometimes (96%) or never (97%).
Among those who found it difficult to complete the ballot (n=53, of whom 79% were from Winnipeg South Centre), seven in 10 (71%) attributed this to the list of candidates being too long or having difficulty finding their choice of candidate on the list; thirteen percent mentioned the ballot paper being too large to handle or difficult to fold.
Nearly everyone (98%) who said they voted in the by-election found it at least somewhat easy to vote, with over nine in 10 (92%) saying it was very easy. Voters from Winnipeg South Centre were less likely than voters in the other electoral districts to have found it easy to vote (95% compared to between 99% and 100% of voters in Notre-Dame-de-Grâce-Westmount, Oxford, Portage-Lisgar, and Calgary Heritage).
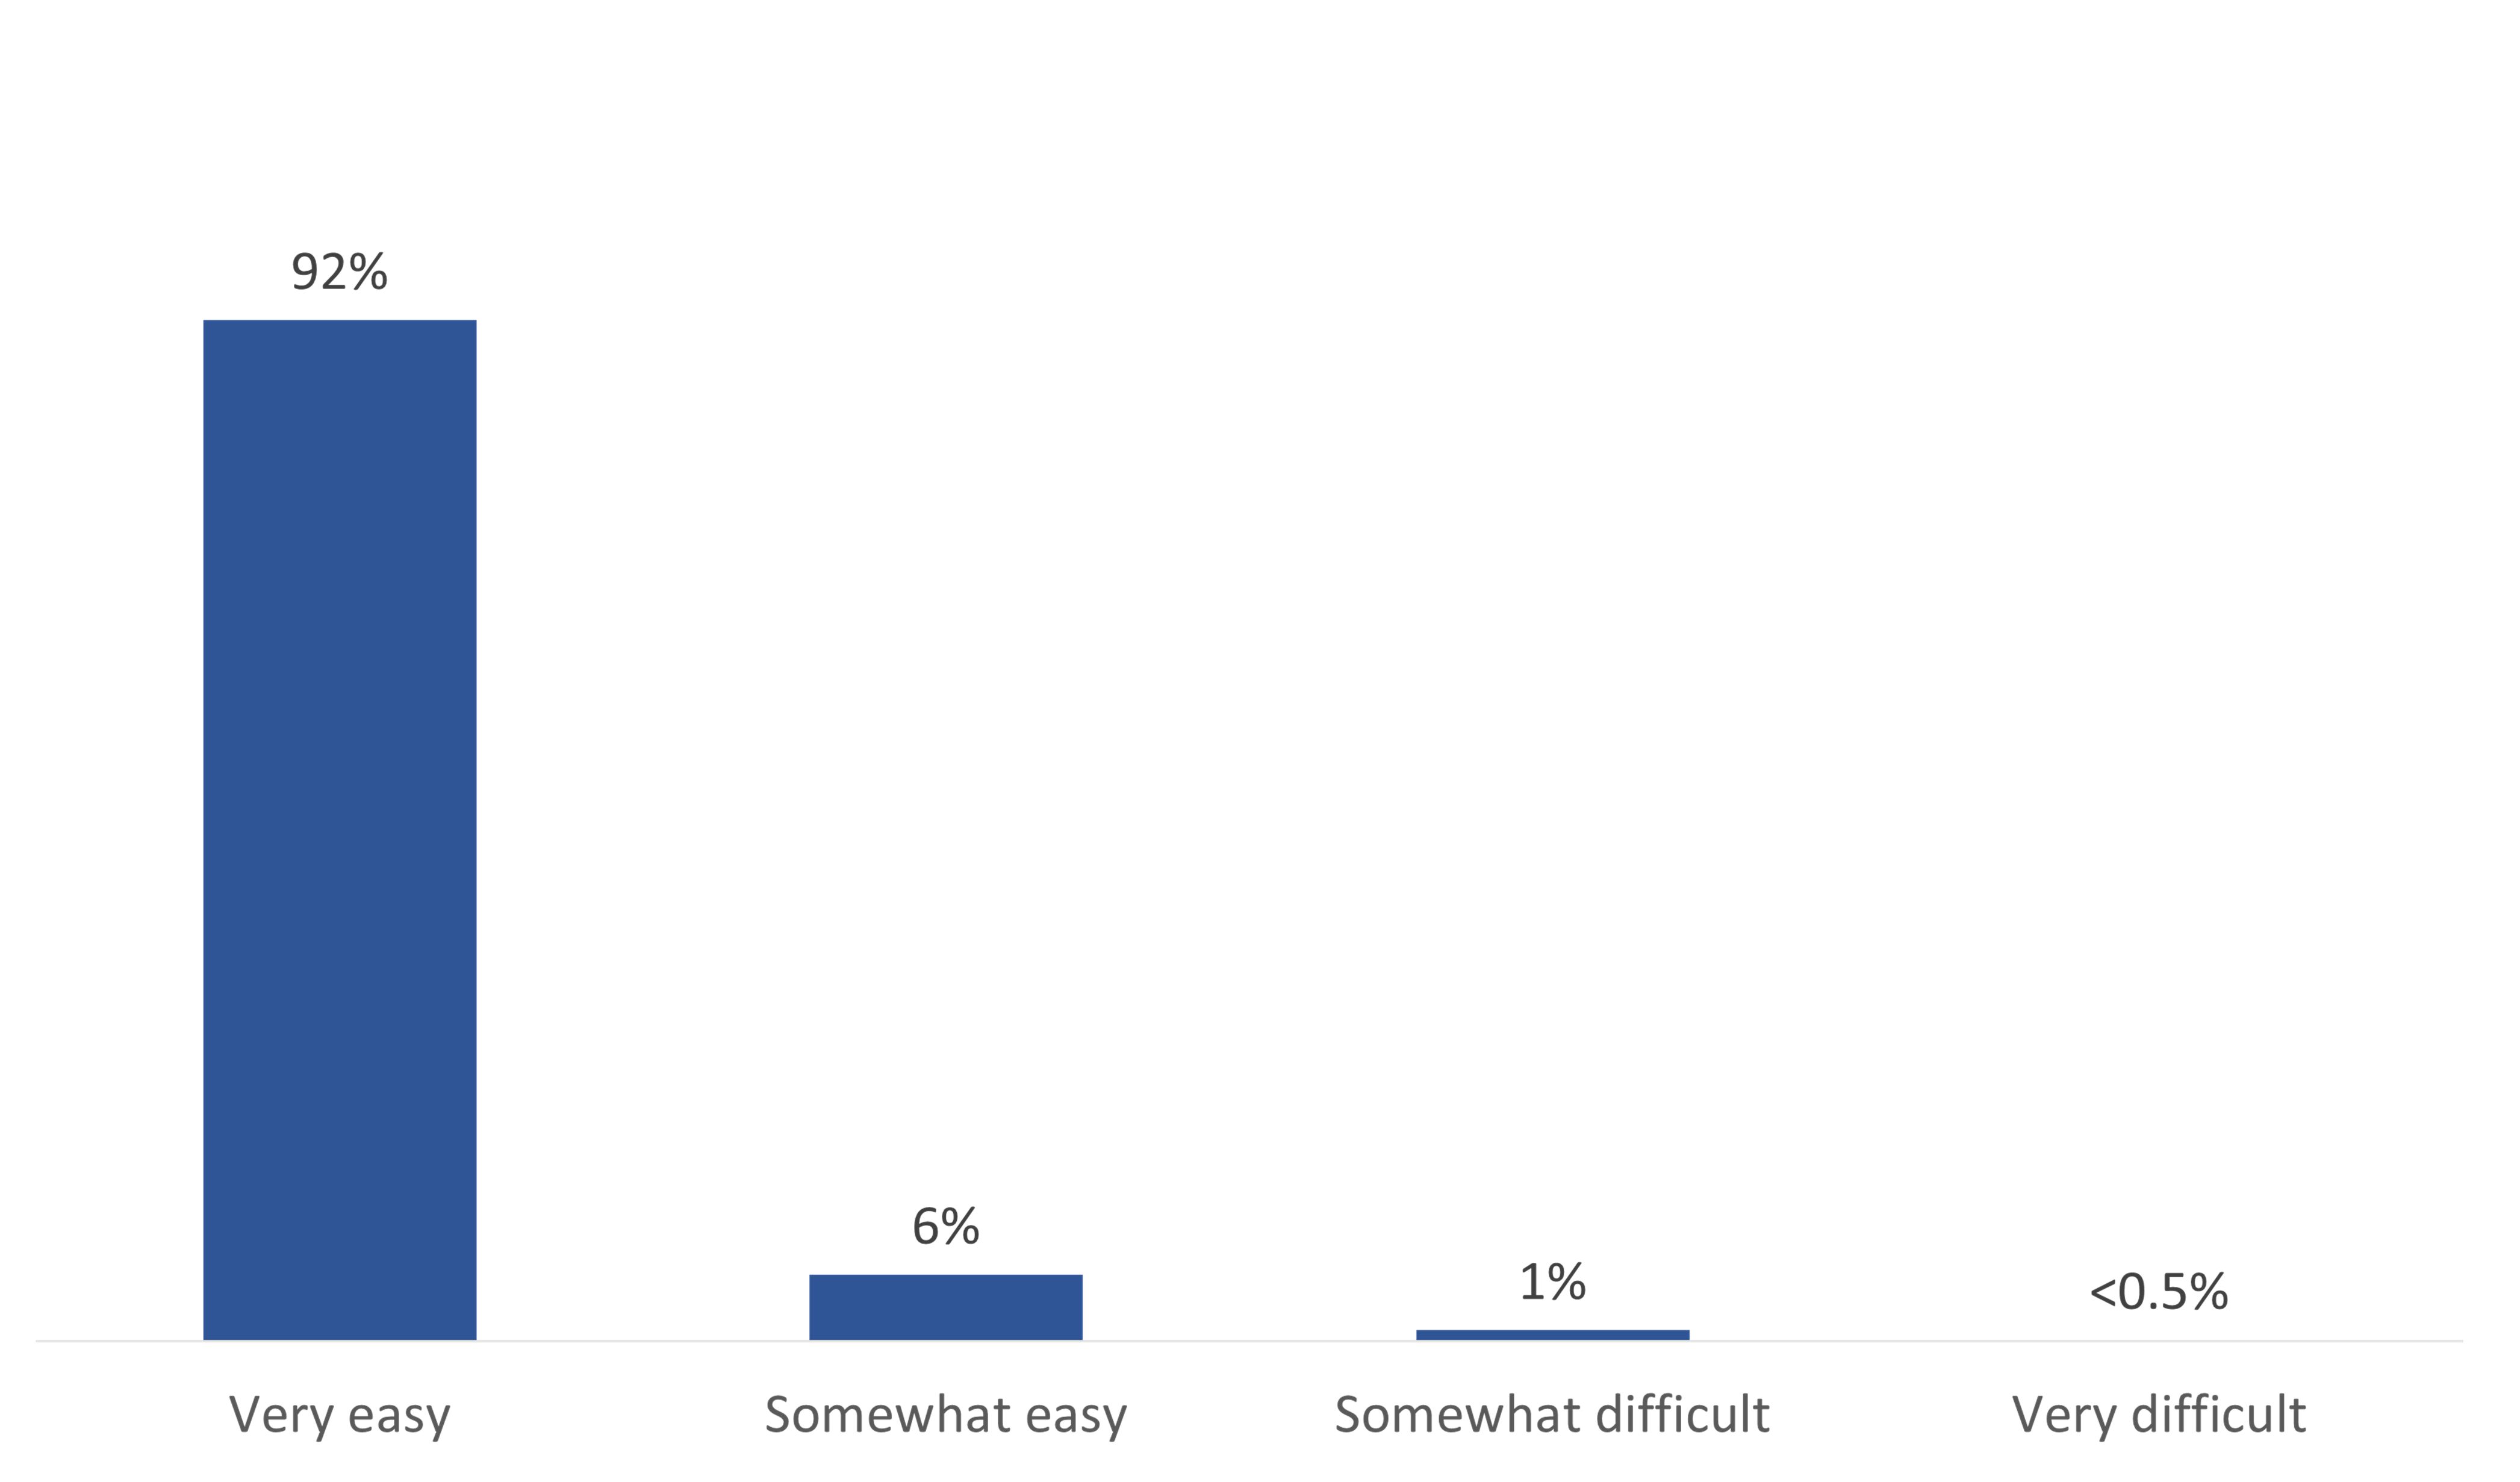
Q. Overall, was it very easy, somewhat easy, somewhat difficult or very difficult to vote? Base: n=1,435; respondents who voted.
This vertical bar chart shows the reported ease of voting by percentage. The breakdown is as follows:
Total
Virtually all (98%) of those who said they voted in the by-election held in their riding were at least somewhat satisfied with the services provided by Elections Canada staff, with 92% saying they were very satisfied. Voters from Winnipeg South Centre (95%) were less likely than voters in Oxford (100%), Portage-Lisgar (99%), and Calgary Heritage (99%) to be satisfied with the services provided by Elections Canada staff.
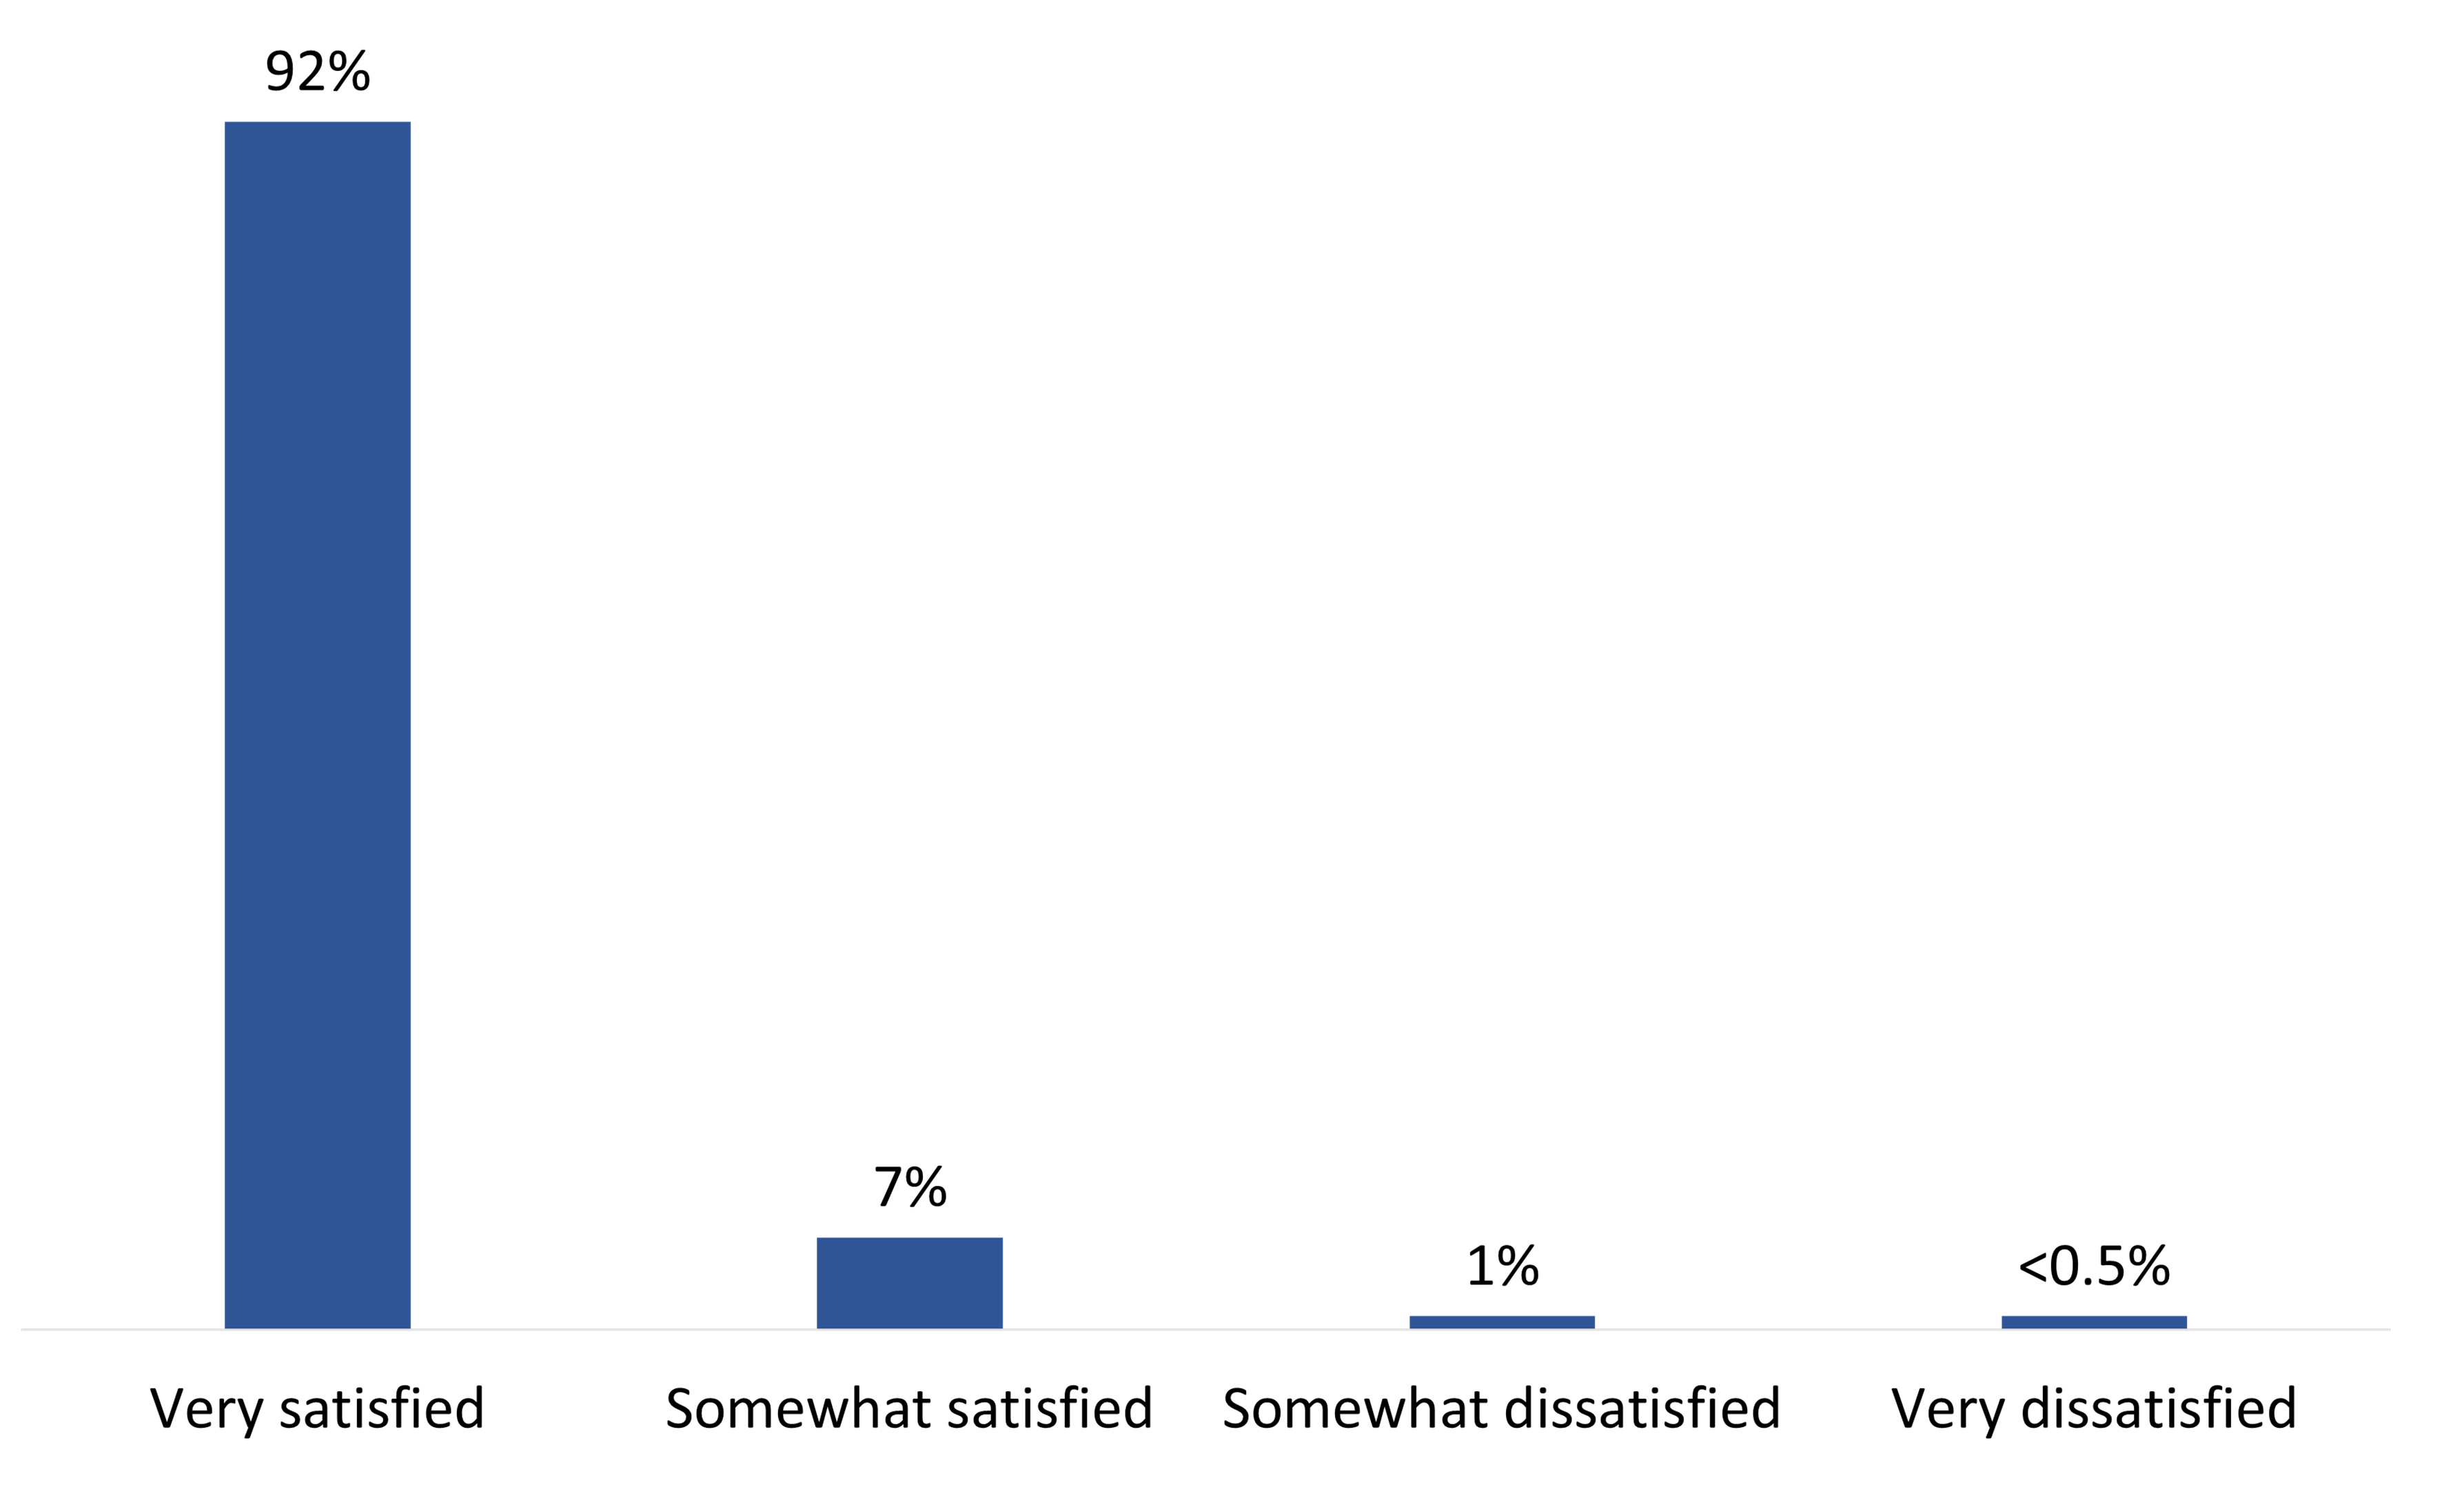
Q. Overall, were you very satisfied, somewhat satisfied, somewhat dissatisfied or very dissatisfied with the services provided by Elections Canada staff when you voted? Base: n=1,418; respondents who voted in person or at home.
The vertical bar chart shows the level of satisfaction with Elections Canada staff among those who voted. The breakdown is as follows:
Total
Ninety-eight percent of respondents who said they voted in the by-election were at least somewhat satisfied with their overall voting experience, including more than eight in 10 (86%) who were very satisfied. Voters from Winnipeg South Centre (96%) were less likely than voters in Notre-Dame-de-Grâce-Westmount (99%), Oxford (99%), and Calgary Heritage (99%) to be satisfied with their voting experience.
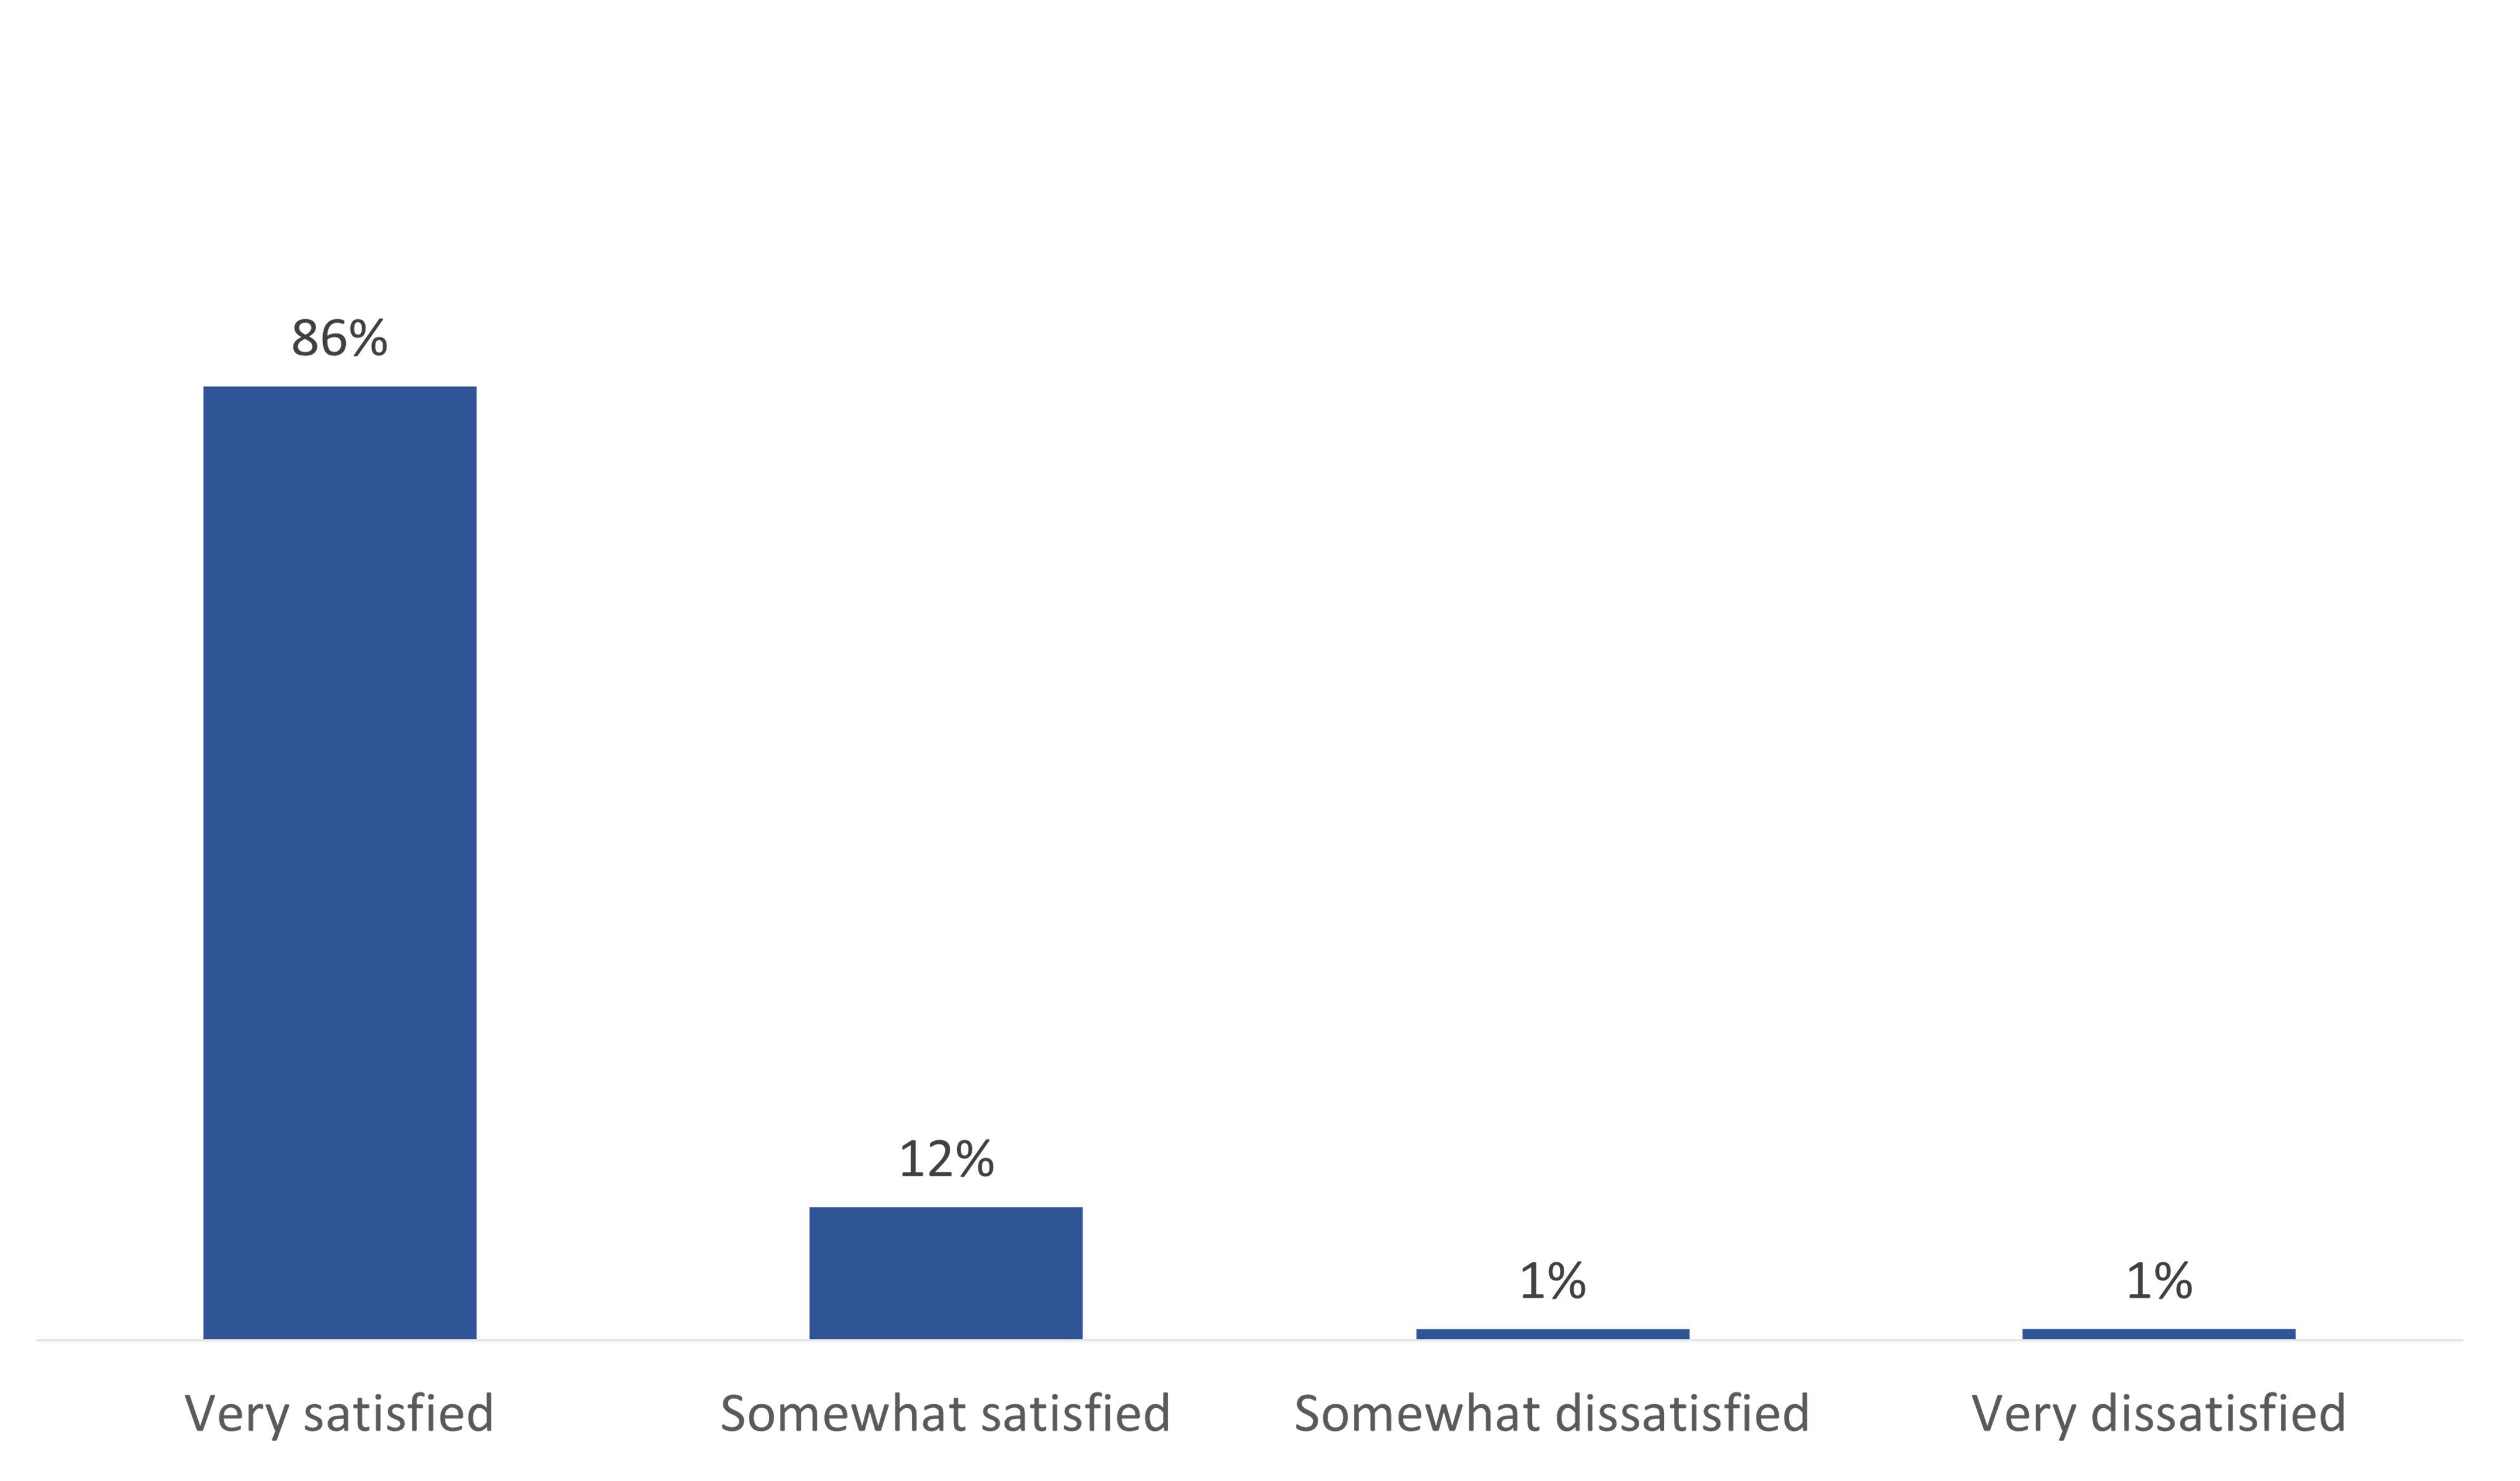
Q. Overall, how satisfied were you with your voting experience? Would you say that you were...? Base: n=1,435; respondents who voted.
This vertical bar chart shows voters' level of satisfaction with their voting experience. The breakdown is as follows:
Total
Voters 18–34 years of age were less likely than older voters to be very satisfied with their voting experience (79% versus 87% of 35–54-year-olds and 88% of those aged 55+).
More than eight in 10 electors (84%) surveyed thought that Elections Canada ran the by-election at least somewhat fairly, with nearly two-thirds (64%) saying very fairly. Electors from Notre-Dame-de-Grâce-Westmount (80%) were less likely than those from the ridings of Portage-Lisgar (87%) and Oxford (86%) to have said that Elections Canada ran the by-election fairly.
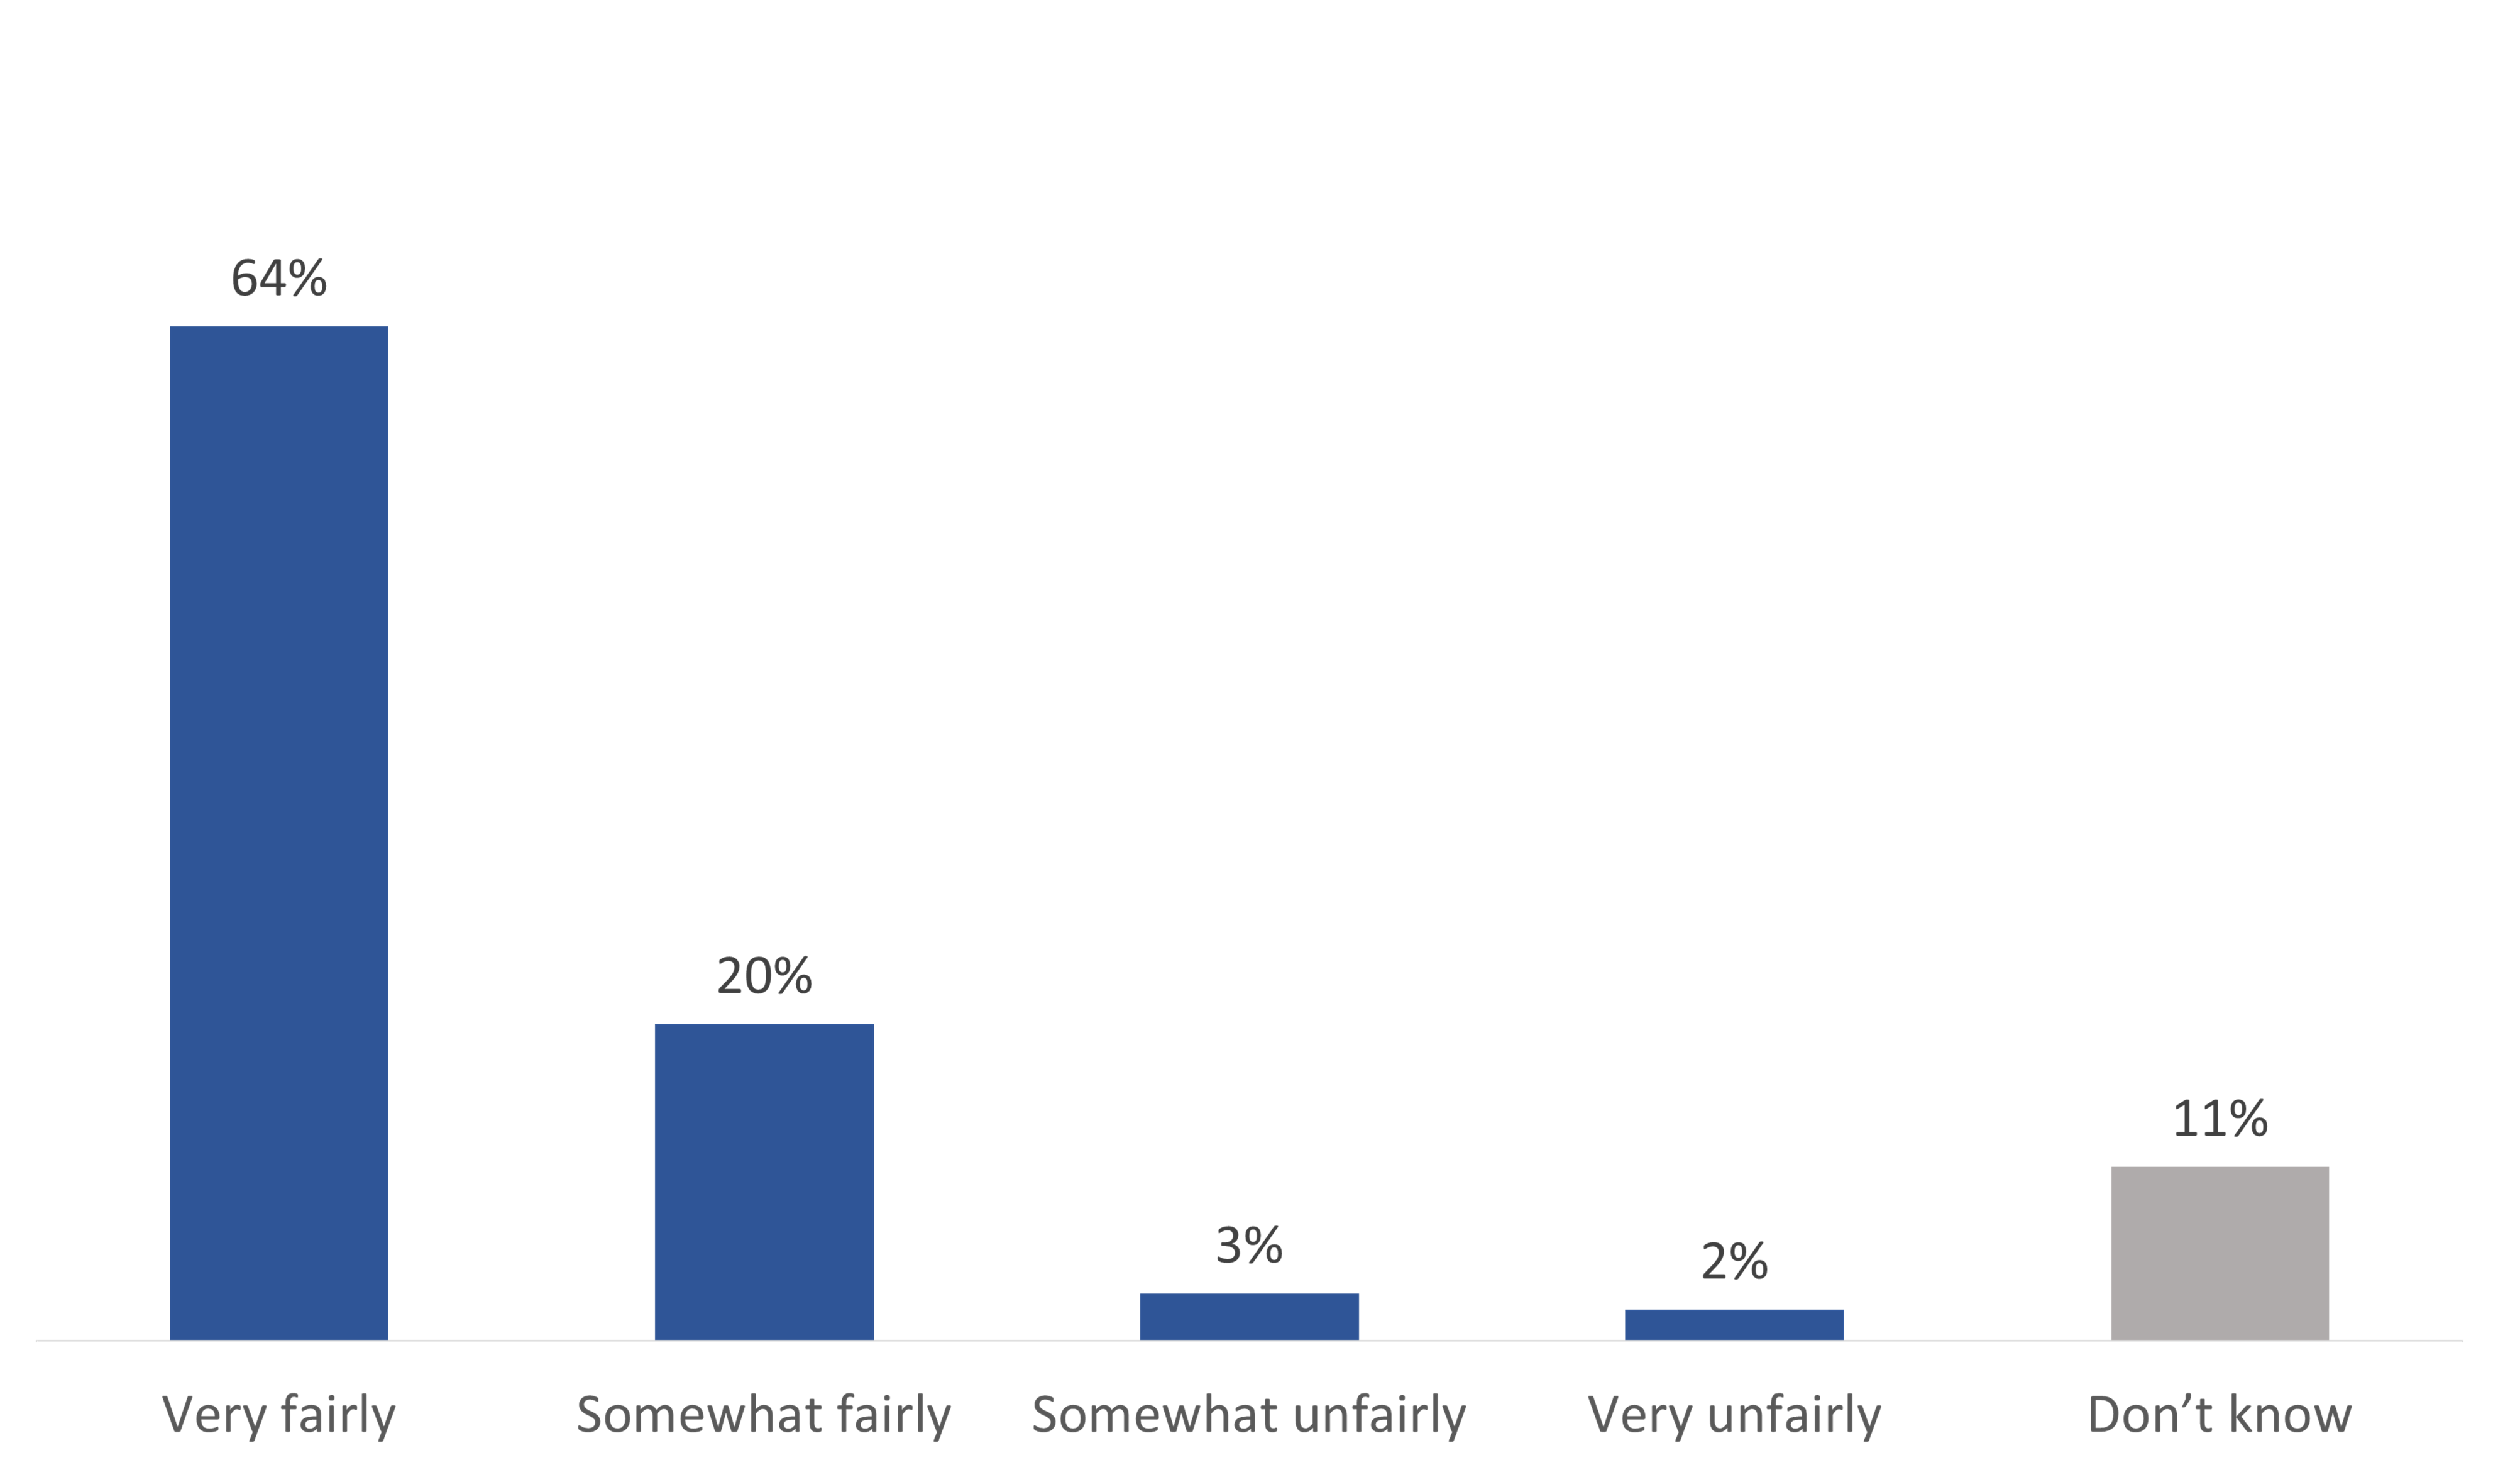
Q. Thinking about the June 19/July 24 federal by-election, would you say that Elections Canada ran the election...? Base: n=2,012; all respondents.
The vertical bar chart shows respondents' perceptions of Elections Canada's fairness in running the by-election by percentage. The breakdown is as follows:
Total
Electors aged 18 to 34 (51% versus 75% of those aged 55+), those with high school or less (55% versus 70% of those who completed their university education), those who are a visible minority (51% versus 67% of other electors) and those who did not vote in the by-election (71% versus 93% of voters) were less likely to say Elections Canada ran the by-election very fairly.
Those who felt that Elections Canada ran the election somewhat or very unfairly (n=76) were asked if there is a specific reason for this opinion. Most reasons mentioned fell within the following categories: a perceived lack of information about the by-election (32%), concerns about the candidate or nomination process (21%; most often mentioned by electors from the riding of Oxford), and a general distrust of government or elections (16%). Other reasons mentioned by very small numbers of respondents included the timing of the by-election and the location of the polling station.
More than nine in 10 respondents (93%) had a high level of trust in the accuracy of the election results, with over two-thirds (68%) expressing a very high level of trust. Electors from the riding of Calgary Heritage (96%) were more likely than those from Portage-Lisgar (90%), Oxford (92%), and Notre-Dame-de-Grâce-Westmount (93%) to have a high level of trust in the accuracy of the results in their riding.
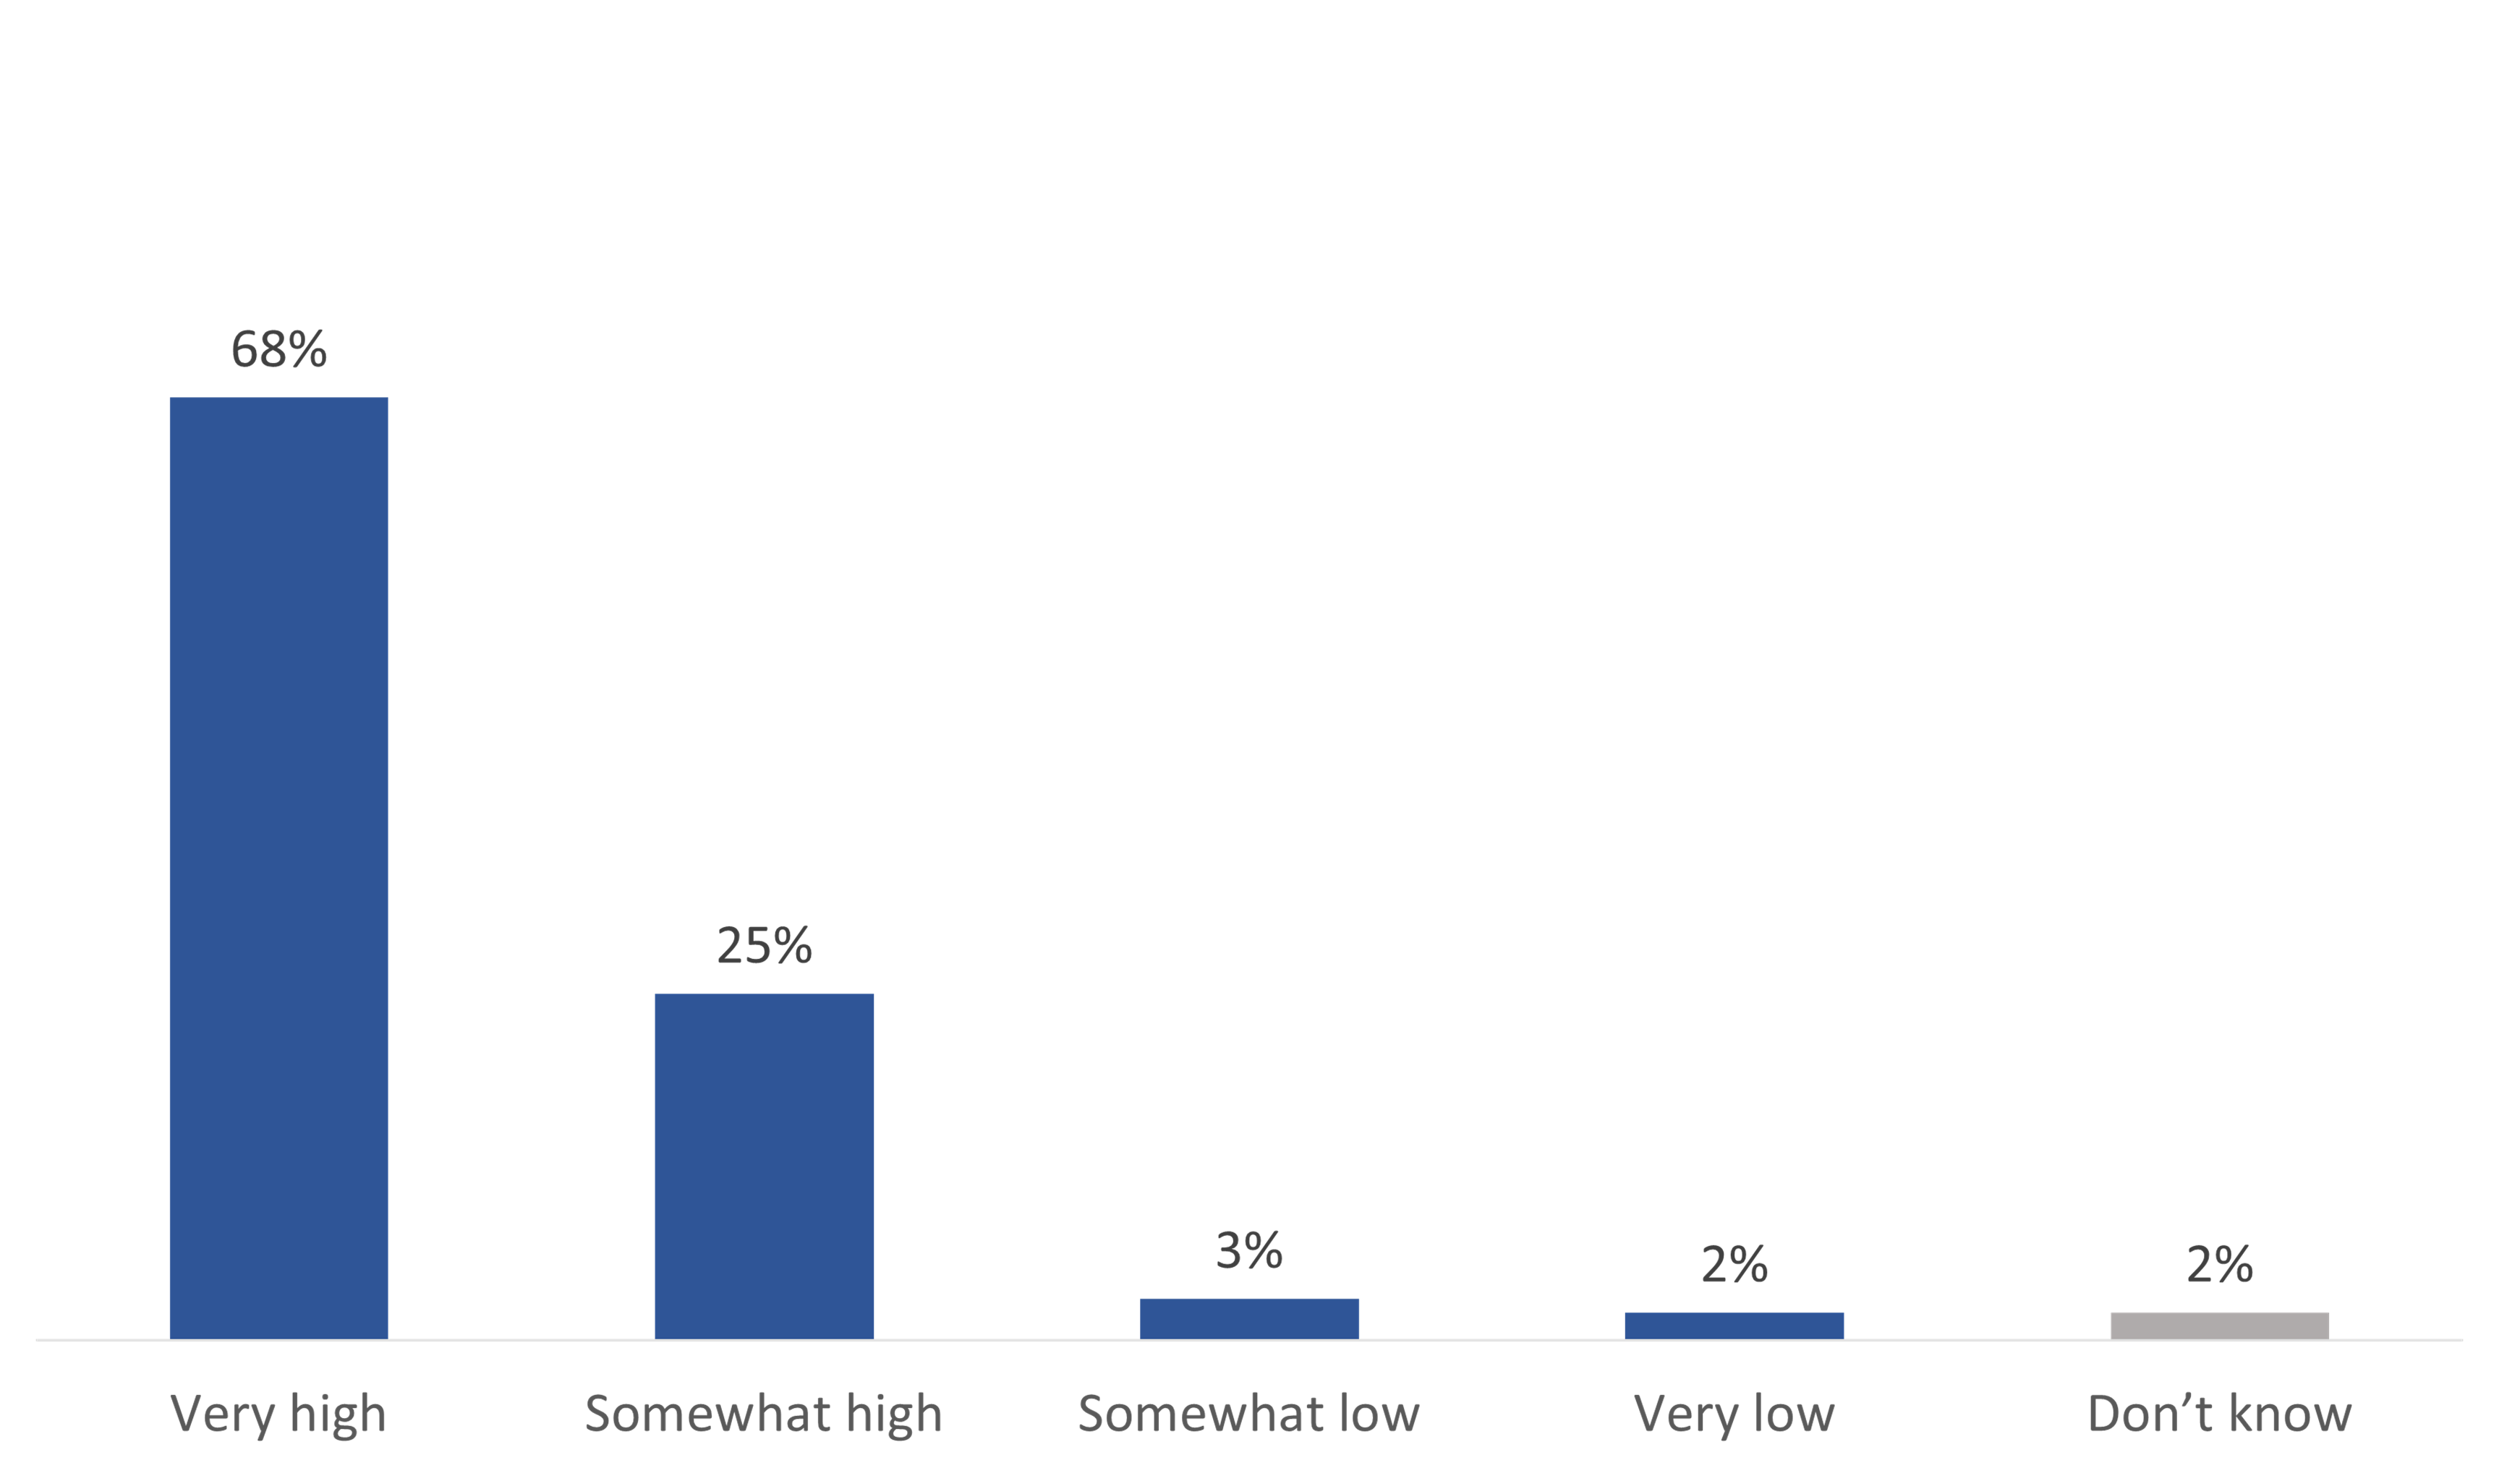
Q. What level of trust do you have in the accuracy of the election results in your riding? Is it...? Base: n=2,012; all respondents.
This vertical bar chart shows respondents' level of trust in the accuracy of the election results in their riding by percentage. The breakdown is as follows:
Total
The following electors were less likely to have a very high level of trust in the accuracy of the election results:
Those who said that they have low trust in the accuracy of the election results (n=85) were asked if there was a specific reason for their low trust. In response, most respondents pointed to a general distrust of government and politicians (39%) or a general distrust of the electoral process (25%). A small number of respondents mentioned a lack of information about the by-election (9%) and concerns about the candidate and/or the nomination process (6%).
Return to footnote 1It is currently not possible to vote online, through the telephone, by computer, or electronically in a federal election.
Return to footnote 2Only the communications about the voting methods changed; the procedures and service offerings for the voting methods were unchanged.
Return to footnote 3EC does not run ads on television or use telephone calls or in-person campaigning to advertise by-elections. In addition, a portion of the responses in the "other print" and "outdoor signage" categories may represent advertising from non-EC sources, such as candidates.
Return to footnote 4This includes voting at a polling station on election day, at an advance polling station, or at local Elections Canada office.
Return to footnote 5This includes voting at a polling station on Election Day, at an advance polling station, or at local Elections Canada office.