In contrast, financial requirements/source measures the difference between cash coming in to the Government and cash going out. It differs from the budgetary balance in that it includes transactions in loans, investments and advances, federal employees’ pension accounts, other specified purpose accounts, and changes in other financial assets and liabilities. These activities are included as part of non-budgetary transactions. The conversion from accrual to cash accounting is also reflected in non-budgetary transactions.
Non-budgetary transactions in 1999-2000 resulted in a net source of funds amounting to $2.3 billion, down from a net source of $8.6 billion in 1998-99. Among the major components:
Total financial requirements/source includes foreign exchange transactions. Foreign exchange transactions represent all transactions in international reserves held in the Exchange Fund Account. The purpose of the Exchange Fund Account is to promote order and stability of the Canadian dollar in the foreign exchange market. It fulfills this function by buying foreign exchange (selling Canadian dollars) when there is upward pressure on the value of the Canadian dollar and selling foreign exchange (buying Canadian dollars) when there is downward pressure. The buying of Canadian dollars represents a source of funds from exchange fund transactions, while the selling of Canadian dollars represents a requirement. Changes in foreign currency liabilities, which are undertaken to change the level of Canada’s foreign exchange reserves, also impact on foreign exchange transactions. During 1999-2000, foreign exchange transactions resulted in a net requirement of funds amounting to $6.8 billion, compared to a net requirement of $5.7 billion in 1998-99.
As a result, there was a total financial source – the budgetary surplus plus non-budgetary and foreign exchange transactions – of $7.7 billion in 1999-2000, compared to a source of $5.8 billion in 1998-99.
With this total financial source, the Government retired $4.0 billion of its market debt and increased its cash balances by $3.7 billion. Cash balances at March 31, 2000, stood at $13.0 billion.
Total liabilities consist of interest-bearing debt and other liabilities. Interest-bearing debt includes market debt and liabilities for pension and other accounts. At March 31, 2000, interest-bearing debt amounted to $597.9 billion, up slightly from the level a year earlier. Other liabilities, which include accounts payable and accrued liabilities, amounted to $40.7 billion, down $4.6 billion from 1998-99. As a result, total liabilities, or gross debt, stood at $638.7 billion.
Table 4
Budgetary Balance and Financial Requirements/Source
| 1993-94 | 1994-95 | 1995-96 | 1996-97 | 1997-98 | 1998-99 | 1999-00 | |
|---|---|---|---|---|---|---|---|
| ($ billions) | |||||||
| Budgetary balance | -42.0 | -37.5 | -28.6 | -8.9 | 3.5 | 2.9 | 12.3 |
| Non-budgetary transactions | |||||||
| Loans, investments and advances | 0.6 | 0.3 | 2.7 | 0.3 | 2.0 | 0.5 | -0.3 |
| Pensions and other accounts | |||||||
| Public sector pensions (net) | 6.2 | 6.9 | 6.8 | 6.3 | 3.3 | 5.0 | 5.9 |
| Canada Pension Plan | -0.1 | 0.7 | 0.2 | 0.1 | 0.5 | 1.2 | 0.8 |
| Other | 0.2 | 1.0 | 0.6 | 0.5 | 0.1 | 0.9 | 0.2 |
| Total | 6.2 | 8.7 | 7.6 | 6.9 | 3.8 | 7.0 | 7.0 |
| Other transactions | 5.4 | 2.6 | 1.1 | 3.0 | 3.4 | 1.1 | -4.4 |
| Total | 12.2 | 11.6 | 11.4 | 10.2 | 9.3 | 8.6 | 2.3 |
| Net financial requirements/source | -29.9 | -25.8 | -17.2 | 1.3 | 12.7 | 11.5 | 14.6 |
| (excluding foreign exchange transactions) | |||||||
| Foreign exchange transactions | -2.1 | -1.4 | -4.7 | -7.8 | -2.2 | -5.7 | -6.8 |
| Total financial balance | -32.0 | -27.3 | -21.9 | -6.5 | 10.6 | 5.8 | 7.7 |
| Net change in borrowings | 31.2 | 27.0 | 28.5 | 7.3 | -9.6 | -6.9 | -4.0 |
| Change in cash balances | -0.7 | -0.2 | 6.7 | 0.8 | 1.0 | -1.1 | 3.7 |
| Cash in bank (March 31) | 2.1 | 1.9 | 8.6 | 9.4 | 10.4 | 9.3 | 13.0 |
Table 5
Outstanding Debt at Year-End
| 1993-94 | 1994-95 | 1995-96 | 1996-97 | 1997-98 | 1998-99 | 1999-00 | |
|---|---|---|---|---|---|---|---|
| ($ billions) | |||||||
| Interest-bearing debt | |||||||
| Unmatured debt | 414.0 | 441.0 | 469.5 | 476.9 | 467.3 | 460.4 | 456.4 |
| Pension and other accounts | 100.5 | 109.2 | 116.8 | 123.7 | 127.5 | 134.6 | 141.5 |
| Total | 514.5 | 550.2 | 586.4 | 600.6 | 594.8 | 595.0 | 597.9 |
| Other liabilities | 31.9 | 34.6 | 38.3 | 40.1 | 43.7 | 45.3 | 40.7 |
| Total liabilities (gross debt) | 546.4 | 584.8 | 624.7 | 640.7 | 638.5 | 640.3 | 638.7 |
| Financial assets | 38.2 | 39.1 | 50.4 | 57.5 | 58.8 | 63.5 | 74.2 |
| Accumulated deficit (net public debt) | 508.2 | 545.7 | 574.3 | 583.2 | 579.7 | 576.8 | 564.5 |
As a result, the accumulated deficit, or net public debt, stood at $564.5 billion at March 31, 2000, down $12.3 billion from March 31, 1999, and $18.7 billion below the peak of $583.2 billion at March 31, 1997.
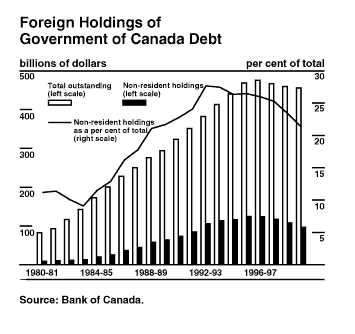
Foreign holdings of the Government of Canada’s outstanding market debt are estimated at $97.3 billion at the end of March 2000. This represented 21.3 per cent of the Government’s total market debt – the lowest ratio since 1988-89.
Français | Table of Contents | Previous | Next.
| publications list - 2000 | home |