|
|
Annual Financial Report 2001-2002: 3
- Table of Contents - Previous - Next -
Budgetary Expenditures
Budgetary expenditures consist of two major components public debt charges and program spending. Net budgetary expenditures amounted to $164.4 billion in 2001-02, up $3.0 billion, or 1.8 per cent, from 2000-01 (see Table 4). Public debt charges declined $4.4 billion, or 10.4 per cent, while program spending advanced $7.3 billion, or 6.1 per cent. Program spending in 2001-02 was $126.7 billion.
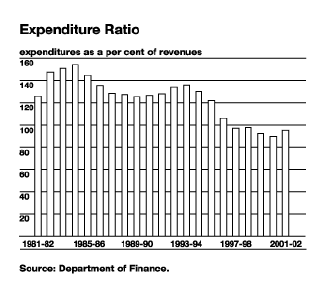
The expenditure ratio budgetary expenditures as a percentage of net budgetary revenues stood at 94.9 per cent in 2001-02, up from 89.9 per cent in 2000-01. This increase reflects the impact of both the decline in budgetary revenues and the increase in budgetary expenditures. In 1993-94 the expenditure ratio stood at 136.2 per cent.
Public debt charges declined by $4.4 billion, or 10.4 per cent, to $37.7 billion in 2001-02, primarily attributable to a decline in the stock of interest-bearing debt and lower average effective interest rates on that debt. For the first time since 1985-86 public debt charges are no longer the largest component of budgetary expenditures. At 23.0 per cent of total expenditures, they are slightly less than transfers to persons (elderly and EI benefits).
-
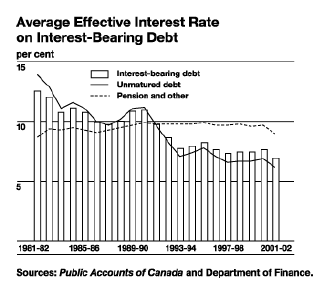
The average effective interest rate on the Governments interest-bearing debt (unmatured debt and pension liabilities) was 6.9 per cent in 2001-02, compared to 7.6 per cent in 2000-01. The average effective interest rate on unmatured debt was 6.2 per cent while that on pension and other accounts was 9.1 per cent.
-
The stock of total interest-bearing debt declined by $5.8 billion in 2001-02, from $589.2 billion to $583.4 billion, as the stock of market debt declined by $4.1 billion to $442.3 billion, while liabilities to pension and other accounts fell by $1.7 billion to $141.2 billion. This is the first year in which liabilities to pension and other accounts have declined, attributable to the impact of the reform of federal employees pension plans, whereby current contributions are invested in the markets by the Public Sector Pension Investment Board and assets related to a number of Crown corporations are being transferred to them as they establish their plans.
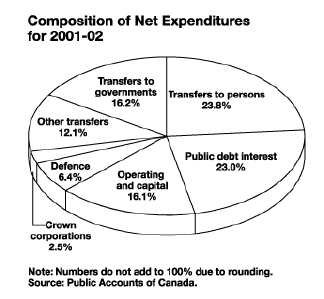
Table 4
Net Budgetary Expenditures
|
|
||||
|---|---|---|---|---|
| 2000-01 | 2001-02 | Net Change | ||
|
|
||||
| ($ millions) | (%) | |||
| Net major transfers to persons | ||||
| Elderly benefits | 24,256 | 25,365 | 1,109 | 4.6 |
| Employment insurance benefits | 11,444 | 13,748 | 2,304 | 20.1 |
| Relief for Heating Expenses | 1,459 | -1,459 | ||
|
|
||||
| Total | 37,159 | 39,113 | 1,954 | 5.3 |
|
Major transfers to other levels of government |
||||
| Canada Health and Social Transfer | 13,500 | 17,300 | 3,800 | 28.1 |
| Medical Equipment Fund | 1,000 | -1,000 | ||
| Fiscal arrangements | 12,684 | 11,978 | -706 | -5.6 |
|
Alternative Payments for Standing Programs |
-2,460 | -2,662 | -202 | 8.2 |
|
|
||||
| Total | 24,724 | 26,616 | 1,892 | 7.7 |
| Net direct program spending | ||||
| Subsidies and other transfers | ||||
| Agriculture and Agri-Food | 1,822 | 1,897 | 75 | 4.1 |
| Foreign Affairs and International Trade | 2,358 | 2,405 | 47 | 2.0 |
| Health Canada | 1,302 | 1,617 | 315 | 24.2 |
| Human Resources Development | 1,995 | 1,698 | -297 | -14.8 |
|
Indian Affairs and Northern Development |
4,448 | 4,557 | 109 | 2.5 |
| Industry/regional agencies | 2,079 | 2,628 | 549 | 26.4 |
| Veterans Affairs | 1,463 | 1,557 | 94 | 6.4 |
| Canada Foundation for Innovation | 1,250 | -1,250 | ||
| Canada Health Infoway Inc. | 500 | -500 | ||
| Other | 3,827 | 3,495 | -332 | -8.7 |
|
|
||||
| Total | 21,044 | 19,854 | -1,190 | -5.7 |
| Crown corporations | ||||
|
Canada Mortgage and Housing Corporation |
1,906 | 1,910 | 4 | 0.2 |
| Canadian Broadcasting Corporation | 902 | 983 | 81 | 9.0 |
| Other | 95 | 1,189 | 1,094 | 1,151.6 |
|
|
||||
| Total | 2,903 | 4,082 | 1,179 | 40.6 |
| Operating and capital expenditures | ||||
| Defence | 9,696 | 10,571 | 875 | 9.0 |
| All other departments | 23,822 | 26,437 | 2,615 | 11.0 |
|
|
||||
| Total | 33,518 | 37,008 | 3,490 | 10.4 |
|
|
||||
| Net direct program spending | 57,465 | 60,944 | 3,479 | 6.1 |
| Net program spending1 | 119,348 | 126,673 | 7,325 | 6.1 |
| Public debt charges | 42,094 | 37,735 | -4,359 | -10.4 |
| Net budgetary expenditures | 161,442 | 164,408 | 2,966 | 1.8 |
|
|
||||
| 1 "Refunds from previous
years expenditures" was reclassified from "Other non-tax
revenues" to program spending. This has the effect of reducing revenues and program spending by $578 million. |
||||
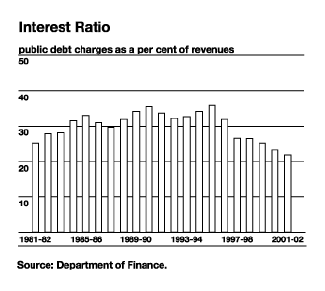
The interest ratio public debt charges as a percentage of net budgetary revenues declined from 23.4 per cent in 2000-01 to 21.8 per cent in 2001-02. This ratio means that, in 2001-02, the Government spent less than 22 cents of every revenue dollar on interest on the public debt. This is down from the peak of 36 cents in 1995-96 and is the lowest this ratio has been since the late 1970s. This is money that must be paid to meet the Governments obligations on its debt. The lower the ratio, the more flexibility the Government has to address the key priorities of Canadians.
Program spending amounted to $126.7 billion in 2001-02, an increase of $7.3 billion, or 6.1 per cent, from 2000-01. Higher cash transfers to provinces and territories under the Canada Health and Social Transfer (CHST) and increased EI benefits accounted for over 80 per cent of the increase in program spending. All major components were higher, with the exception of subsidies and other transfers.
Major transfer payments to persons increased by $2.0 billion, or 5.3 per cent.
-
Elderly benefits consist of Old Age Security, Guaranteed Income Supplement and spouses allowance payments. Total benefits were up $1.1 billion in 2001-02, reflecting both higher average benefits, which are indexed to inflation, and an increase in the number of recipients.
-
EI benefits increased $2.3 billion in 2001-02. About half of this increase was attributable to increased regular benefit payments, reflecting the deterioration in the labour market and the accompanying increase in the number of unemployed. Most of the remaining increase was due to higher special benefits, in particular the increase in parental benefits, reflecting the doubling of parental leave from six months to one year.
-
Partially offsetting the impact of these developments was the one-time Relief for Heating Expenses for low- and modest-income Canadians of $1.5 billion that was paid in January 2001.
Major transfer payments to other levels of government include the CHST, fiscal arrangements (equalization, transfers to the territories, as well as a number of small transfer programs) and Alternative Payments for Standing Programs. Net cash transfers increased by $1.9 billion in 2001-02, or 7.7 per cent.
-
The CHST a block-funded transfer supports health care, post-secondary education, social assistance and social services, including early childhood development. It provides support in the form of cash and tax transfers to the provinces and territories. As part of the September 2000 Agreements on Health Renewal and Early Childhood Development, the federal government legislated $21.1 billion of additional cash to be provided under the CHST over the next five years. As part of this, an incremental $3.8 billion was paid in 2001-02.
-
Total entitlements under fiscal arrangements decreased by $0.7 billion, or 5.6 per cent, primarily due to prior-year adjustments affecting equalization entitlements. Under the equalization program, the federal government transfers funds to the less prosperous provinces so that they can provide their residents with public services comparable to those in other provinces without having to resort to higher-than-average taxation. Equalization legislation is renewed every five years. The current legislation, which covers the period 1999-2000 to 2003-04, capped total entitlements in 1999-2000 at $10 billion, with the annual maximum entitlements growing in line with the growth in nominal GDP. The weak growth in nominal GDP in 2001 restrained the overall increase in equalization entitlements for 2001-02. In addition, in September 2000 the federal government indicated that the cap for 1999-2000 only would be lifted, resulting in an incremental entitlement for that year of about $0.8 billion. Under the Governments accounting rules, this amount was charged to 2000-01, thereby accounting for most of the decline between 2000-01 and 2001-02. Finally, transfers to the territories were lower due to recoveries resulting from overpayments in previous years.
-
The Alternative Payments for Standing Programs represent recoveries of federal tax point abatements under contracting-out arrangements. These arrangements allow provinces to assume the administrative and financial authority for certain federal-provincial programs. In turn, the federal government provides provinces with tax points, the value of which are netted against total entitlements and accordingly recovered from cash transfers. These recoveries reflect the growth in the value of the tax points.
-
Also affecting the year-over-year change was a one-time payment in 2000-01 of $1 billion to a third-party trust for provinces and territories to acquire new medical equipment. This was part of the September 2000 Agreements on Health Renewal and Early Childhood Development.
Direct program spending total program spending less major transfers to persons and other levels of government consists of subsidies and other transfer payments, expenditures related to Crown corporations, and operating and capital expenditures of departments and agencies, including National Defence. This spending amounted to $60.9 billion in 2001-02, up $3.5 billion, or 6.1 per cent, from 2000-01. Within direct program spending:
-
Subsidies and other transfer payments decreased by $1.2 billion, or 5.7 per cent, primarily reflecting the impact of one-time transfers made in 2000-01. These included:
-
$1.25 billion to the Canada Foundation for Innovation (CFI) to award funds to help post-secondary educational institutions, research hospitals and not-for-profit institutions modernize their research infrastructure and assist in associated operating and maintenance costs. The Governments total transfer to the CFI to date is $3.15 billion.
-
$500 million to the Canada Health Infoway Inc. to accelerate the development and adoption of modern systems of information technology to provide better health care. This investment was part of the September 2000 Agreements on Health Renewal and Early Childhood Development.
-
-
Expenditures related to Crown corporations were up $1.2 billion to $4.1 billion in 2001-02. This component includes appropriations to consolidated Crown corporations (those Crown corporations that rely on government funding as their principal source of revenue) and the annual profit and losses of enterprise Crown corporations. Most of the annual increase was attributable to lower net profits of enterprise Crown corporations.
-
Operating and capital expenditures include the costs of defence, government administration and delivery of specific services to the public, such as:
-
health care to Aboriginals and veterans;
-
research undertaken by government departments;
-
food inspection;
-
Coast Guard and air and sea rescue;
-
operation of national parks and historic sites;
-
collection of taxes;
-
operation of federal correctional institutions and provision of police services; and
-
administration of programs.
This spending increased by $3.5 billion, or 10.4 per cent, in 2001-02. Of this amount:
-
Defence spending increased by $0.9 billion, or 9.0 per cent, primarily due to increased funding related to meeting Canadas international commitments.
-
Non-defence departmental operating and capital spending increased by $2.6 billion. About half of this increase was attributable to new policy initiatives announced during the year, particularly those associated with the implementation of enhanced personal and economic security.
-
The program share program spending as a percentage of budgetary revenues amounted to 73.1 per cent, up from 66.5 per cent 2000-01. In 1993-94 the program share was 103.5 per cent.
The above numbers are presented on a "net" basis, as discussed in the previous section, "Budgetary Revenues." Table 5 shows the impact of the adjustments. Gross expenditures are $14.2 billion higher than net expenditures.
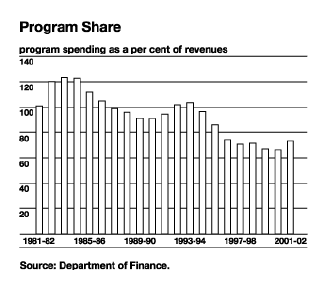
Table 5
Gross Budgetary Expenditures
|
|
||||
|
2000-01 |
2001-02 |
Net Change |
||
|---|---|---|---|---|
|
|
||||
| ($ millions) | (%) | |||
|
Net budgetary expenditures |
161,442 | 164,408 | 2,966 | 1.8 |
|
Adjustments |
||||
|
Canada Child Tax Benefit |
6,811 | 7,557 | 746 | 11.0 |
|
Old Age Security benefit repayments |
-588 | -734 | -146 | 24.8 |
|
Quarterly GST credit |
2,901 | 2,964 | 63 | 2.2 |
|
Revenues netted against expenditures |
2,874 | 2,936 | 62 | 2.2 |
|
Revenues of consolidated |
1,762 | 1,429 | -333 | -18.9 |
|
|
||||
|
Net adjustment |
13,760 | 14,152 | 392 | 2.8 |
|
Gross budgetary expenditures |
175,202 | 178,560 | 3,358 | 1.9 |
|
|
||||
|
- Table of Contents - Previous - Next - |
| Last Updated: 2002-10-16 |
|
||||