|
|
Fiscal Year 20022003: 1
- Table of Contents - Next -
Fiscal Year 20022003
The federal government posted a budgetary surplus of $7.0 billion in 200203, marking the sixth consecutive year in which it has recorded a surplusthe last time this occurred was in the period up to 195152. As a result of the budgetary surpluses recorded since 199798, the federal debt (accumulated deficit) has been reduced by $52.3 billion to $510.6 billion from its peak of $562.9 billion in 199697. At the same time, the Government implemented the largest tax cut in Canadian history and invested in the key priorities of Canadians, such as health care, support for low-income families with children, education, and research and development.
Sound financial management played an important role in helping Canada avoid a recession in 20012002, despite the global economic downturn. It enabled fiscal and monetary policy to provide timely support to the Canadian economy through lower taxes and interest rates. And according to the Organisation for Economic Co-operation and Development (OECD), Canada was the only Group of Seven (G-7) country to post a surplus in 2002.
Federal debt as a percentage of the economy was just over 44 per cent in 200203, a reduction of almost 25 percentage points from its peak of 68.4 per cent in 199596. On an international basis, Canada has made more progress in reducing its debt burden than any other G-7 country. According to the OECD, Canadas net debt burden is now below the G-7 averagewell below those in Italy and Japan and in line with those in Germany, France and the United States. Only the United Kingdom has a significantly lower debt burden.
This large reduction in federal debt is important for a variety of reasons. A lower debt burden, resulting from a reduction in interest-bearing debt, means that a smaller portion of the revenue the Government collects from taxpayers must go towards debt-servicing payments, thereby leaving more resources for reducing taxes and funding valued programs and services. A lower debt burden also lessens the exposure of Canadas fiscal situation to economic shocks, especially an increase in interest rates or prolonged slowdowns in economic activity. And a lower debt burden reduces the amount that younger Canadians will have to pay for servicing debt incurred by the generations that preceded them.
The financial data in this report are based, for the first time, on the full accrual basis of accounting. This is a major accomplishment, involving all government departments and agencies. Previously, the Governments financial statements were prepared under modified accrual accounting. Full accrual accounting provides a more comprehensive reporting of assets and liabilities and a more transparent picture of the Governments financial position. It is the accounting standard recommended for senior levels of government in Canada by the Public Sector Accounting Board of the Canadian Institute of Chartered Accountants and has been strongly recommended by the Auditor General of Canada and the House of Commons Standing Committee on Public Accounts.
The financial data in this report are based on the audited results, which will appear in more detail in the 2003 Public Accounts of Canada, scheduled for tabling in the House of Commons this fall. They cover the federal governments spending and revenue performance for the past fiscal year (April 1, 2002 to March 31, 2003) and detail the factors affecting these results. In addition, the Fiscal Reference Tables publication has been updated to incorporate accrual results for the 198384 to 200203 period and historical revisions to the National Economic and Financial Accounts published by Statistics Canada. These tables are an integral part of this report.
The Honourable John Manley, P.C., M.P.
Deputy Prime Minister and Minister of Finance
Note to Readers
The financial statements for 200203 are presented on the full accrual basis of accounting, replacing the modified accrual standard that had been used since the mid-1980s. The Government first announced its commitment to full accrual accounting in the 1995 budget. The Canadian Institute of Chartered Accountants and the Auditor General of Canada have strongly supported the implementation of full accrual accounting by the Government of Canada. After extensive consultations with the Office of the Auditor General of Canada, the Government felt that it had sufficient assurance as to the reliability of the accrual amounts to implement it in the 2003 budget.
Under full accrual accounting, the Governments financial statements will provide a more comprehensive and up-to-date picture of the Governments financial situation, thereby improving transparency and accountability.
- The Governments balance sheet will provide a more comprehensive picture of the Governments assets and liabilities. For example, the value of the buildings that the Government owns will now appear on its balance sheet, as will its liabilities for cleaning up contamination on its properties.
- The annual budgetary balance will better reflect the impact of economic events and government decisions during the fiscal year. For example, year-to-year changes in recorded tax revenues will more accurately reflect the year-to-year changes in the tax base and tax rates, as these changes will be much less affected by collection and remittance lags.
- The annual budgetary balance will better reflect the impact of government decisions during the fiscal year. In particular, decisions that result in an increase (or decrease) in the Governments liabilities for environmental cleanups in areas of federal jurisdiction, liabilities related to Aboriginal claims, and liabilities for post-employment and retirement benefits for federal employees will be recorded as expenses in the year the decision is made. Under modified accrual accounting, the full costs of some of these decisions would not be recorded in the Governments financial statements until the resulting cash payments were made, which could be many years later.
The Governments previous accounting standardmodified accrualused a mix of accrual and cash accounting, depending on the type of transaction. In the 2003 budget, and with these financial statements, the Government is extending the use of accrual accounting to all items that were previously recorded on a cash basis. These include:
- Non-financial assets: Under modified accrual accounting, the value of the Governments stock of capital assets, such as buildings, vehicles and equipment, was not shown on the balance sheet. Instead the full purchase price of a capital asset was recorded as an expenditure in the year of purchase and therefore had an immediate impact on the budgetary balance in that year. Under full accrual accounting, the value of these assets will now be recorded as a non-financial asset. In addition, the cost of using that asset will be amortized (depreciated) over its estimated useful life according to Generally Accepted Accounting Principles. Similarly, under modified accrual, the cost of an item held in inventory is recognized in the year in which it is purchased while, under full accrual, it is recognized as an expense in the year that it is used.
- Tax revenues: Under modified accrual accounting, tax revenues were recorded when they were received, while refunds were recorded in the year in which they were paid. Under full accrual accounting, tax receipts and refunds will generally be recorded in the year in which the taxable activity takes place. Accordingly, a receivable is established for taxes owing and a payable for refunds owing to taxpayers.
- Liabilities: Under full accrual accounting, a more comprehensive list of liabilities is recorded on the balance sheet. The Government now includes the estimated cost of environmental cleanups in areas of federal jurisdiction; the value of liabilities related to Aboriginal claims to the extent payment is likely and estimable; increased liabilities for post-employment benefits for federal employees, including workers compensation and veterans disability costs; and federal employee retirement costs such as health and dental care.
The Governments fiscal anchor remains the budgetary balance, which will now reflect the impact of the annual changes in the areas described above. Furthermore, prior to the shift to accrual accounting, there was no distinction between net debt and the accumulated deficit, or federal debt, so these terms were used interchangeably. Under full accrual accounting, this is no longer the case. Net debt is the Governments net liabilities excluding the value of its non-financial assets. The accumulated deficit takes into account the value of non-financial assets. The two indicators now represent different measures of the Governments financial position. The federal debt will now represent the accumulation of surpluses and deficits in the past and is the Governments key measure of debt.
The financial results in this publication are based on the audited results, which will appear in more detail in the 2003 Public Accounts of Canada. In completing the audit for 200102, certain adjustments have been made to the estimates that appeared in The Budget Plan 2003. In Budget 2003, the surplus for 200102, on a full accrual basis of accounting, was estimated at $8.2 billion. This was based on preliminary estimates, which had not been audited. The audited results have resulted in a lower surplus for 200102$7.0 billionprimarily due to revisions to the estimates for inventories, veterans disability liabilities and the allowance for tax receivables. Revised estimates have been prepared going back to 198384. These appear in the Fiscal Reference TablesOctober 2003.
Report Highlights
|
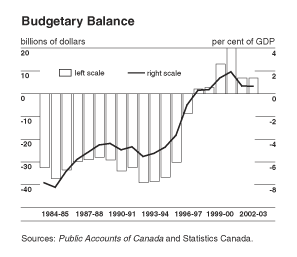
The Budgetary Balance
Sound financial management played an important role in helping Canada avoid a recession in 20012002, despite global economic weakness. It enabled fiscal and monetary policy to provide timely support to the Canadian economy through lower taxes and interest rates. The commitment to fiscal discipline allowed Canada to post a budgetary surplus in 2002, while all other G-7 countries recorded deficits. It also helped Canada record the best economic performance among the G-7 countries in 2002. Economic growth in Canada in 2002 rebounded to 3.3 per cent from 1.9 per cent in 2001, primarily due to strong domestic demand, as the external sector remained weak in the face of an uneven global economic recovery. Canadas resilient performance in 2002 reflected strong economic fundamentals, the impact of the year 2000 tax cuts and an increasingly competitive business sector.
In the December 2001 and February 2003 budgets, the Government committed to a balanced budget or better for 200203. This was after responding to a number of key priorities relating to security in the aftermath of the terrorist attacks of September 11, 2001, and investments in Canadas health care system. In the 2003 budget the Government announced initiatives totalling $6.4 billion for 200203, of which $4.7 billion was directed to health care. On a full accrual basis of accounting, the final budgetary surplus for 200203 was $7.0 billion, unchanged from the restated surplus for 200102.
On a full accrual basis of accounting, the budgetary balance went from a deficit of 5.5 per cent of GDP ($38.5 billion) in 199394 to six consecutive surpluses over the 199798 to 200203 period. The 200203 surplus was $7.0 billion, or 0.6 per cent of GDP. All of this fiscal improvement since 199394 is attributable to the decline in total expenses. As a percentage of GDP, program expenses declined from 15.7 per cent in 199394 to 11.5 per cent in 200203, and public debt charges fell from 5.5 per cent in 199394 to 3.2 per cent in 200203.
Federal Debt
The 200203 surplus of $7.0 billion brings the federal debtthe accumulation of annual deficits and surplusesdown to $510.6 billion from its peak of $562.9 billion in 199697. As a share of GDP, federal debt dropped to 44.2 per cent in 200203, down nearly 25 percentage points from the peak of 68.4 per cent in 199596. This is the seventh consecutive year in which the federal debt-to-GDP ratio has declined, bringing it to its lowest level since 198485.
Federal debt consists of interest-bearing debt and other liabilities, net of financial and non-financial assets. Interest-bearing debt, in turn, consists of unmatured, or market, debt and the Governments obligations to internally held accountsprimarily the liabilities for the federal government employees pension plans. Of the decrease in the federal debt of $7.0 billion in 200203, total interest-bearing debt declined by $2.1 billion: market debt declined by $2.5 billion and obligations to pension accounts increased by $0.4 billion. Other liabilities fell by $2.1 billion, while financial assets increased by $1.9 billion and non-financial assets by $0.9 billion.
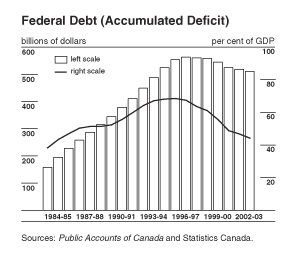
Federal Debt (Accumulated Deficit)The financial statements of the Government of Canada are now presented on a full accrual basis of accounting. Under the previous accounting standardmodified accrual accountingnet debt and the accumulated deficit were identical. Under the new standard, net debt now includes a comprehensive costing for financial liabilities but excludes non-financial assets. The accumulated deficit includes both. It is the sum of all surpluses and deficits in the past. Federal debt, referred to in the budget documents and the Annual Financial Report of the Government of Canada, is the accumulated deficit. It is the federal governments main measure of debt, as annual changes in this measure determine the budgetary balance. |
Financial Source/Requirement
The financial source/requirement measures the difference between cash coming in to the Government and cash going out. There was a financial source of $7.6 billion in 200203, compared to a revised financial requirement of $0.3 billion in 200102. This turnaround was primarily attributable to swings in the Exchange Fund Account and other accounts.
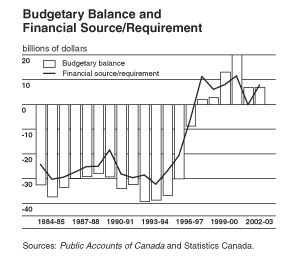
Table 1
Financial Highlights1
|
|
||||||
| 199798 | 199899 | 199900 | 200001 | 200102 | 200203 | |
|---|---|---|---|---|---|---|
|
|
||||||
| ($ billions) | ||||||
| Budgetary transactions | ||||||
| Revenues | 152.1 | 156.1 | 166.1 | 182.7 | 171.7 | 177.6 |
| Expenses | ||||||
| Program expenses | -106.9 | -110.0 | -109.6 | -118.7 | -125.0 | -133.3 |
| Public debt charges | -43.1 | -43.3 | -43.4 | -43.9 | -39.7 | -37.3 |
|
|
||||||
| Total expenses | -150.0 | -153.3 | -153.0 | -162.6 | -164.7 | -170.6 |
| Budgetary balance | 2.1 | 2.8 | 13.1 | 20.2 | 7.0 | 7.0 |
| Non-budgetary transactions | 9.0 | 3.1 | -5.3 | -8.9 | -7.3 | 0.7 |
| Financial source/requirement | 11.1 | 5.9 | 7.8 | 11.3 | -0.3 | 7.6 |
| Net change in financing activities | -9.6 | -6.9 | -4.0 | -10.0 | -4.1 | -2.5 |
| Net change in cash balances | 1.5 | -1.0 | 3.8 | 1.3 | -4.4 | 5.1 |
|
|
||||||
| Cash balance at end of period | 11.7 | 10.7 | 14.5 | 15.8 | 11.4 | 16.5 |
| Financial position | ||||||
| Total liabilities | 713.4 | 717.7 | 717.3 | 715.0 | 704.3 | 700.1 |
| Total financial assets | 102.5 | 108.2 | 120.7 | 138.7 | 133.4 | 135.3 |
|
|
||||||
| Net debt | 610.9 | 609.5 | 596.6 | 576.3 | 570.9 | 564.8 |
| Non-financial assets | 50.2 | 51.7 | 51.8 | 51.7 | 53.4 | 54.2 |
|
|
||||||
| Federal debt (accumulated deficit) | 560.7 | 557.9 | 544.7 | 524.6 | 517.5 | 510.6 |
| Financial results (% of GDP) | ||||||
| Budgetary revenues | 17.2 | 17.1 | 16.9 | 17.0 | 15.5 | 15.4 |
| Program expenses | 12.1 | 12.0 | 11.2 | 11.0 | 11.3 | 11.5 |
| Public debt charges | 4.9 | 4.7 | 4.4 | 4.1 | 3.6 | 3.2 |
| Budgetary balance | 0.2 | 0.3 | 1.3 | 1.9 | 0.6 | 0.6 |
| Federal debt | 63.5 | 61.0 | 55.4 | 48.8 | 46.7 | 44.2 |
|
|
||||||
| 1 Reflects classification changes resulting from the move to full accrual accounting. | ||||||
Budgetary Revenues
Following a decline of $11.1 billion, or 6.1 per cent, in 200102, budgetary revenues increased in 200203 by $5.9 billion, or 3.4 per cent. The decline in 200102 was primarily attributable to the impact of global economic weakness on the various tax bases, an adjustment relating to refundable taxes withheld from the federal Retirement Compensation Arrangements Account that were previously credited to tax revenues, and the effect of the tax reduction measures announced in the February 2000 budget and October 2000 Economic Statement and Budget Update.
Nominal incomethe applicable tax base for revenuesadvanced by 4.3 per cent in 2002, up from the increase of 3.0 per cent in 2001. The net impact of stronger economic growth in 2002 on revenues was dampened by the incremental impact of the tax reductions introduced in previous budgets, especially the restoration of full indexation of the personal income tax system, increases in the Canada Child Tax Benefit and reductions in the corporate income tax rate. Most of the increase in budgetary revenues resulted from higher excise taxes and duties, particularly goods and services tax (GST) revenues, primarily reflecting strengthened consumer demand.
Personal income tax revenues, the largest component of budgetary revenues, increased by $2.2 billion, or 2.8 per cent, in 200203. However, half of this increase is attributable to the one-time adjustment in 200102 relating to refundable taxes withheld from the federal Retirement Compensation Arrangements Account. As a result, the underlying increase was only 1.5 per cent. This is broadly in line with the growth of 3.3 per cent in personal income, adjusted for the incremental impact of the tax reduction measures. Personal income growth was impacted in 2002 by lower interest and dividend payments, reflecting the impact of lower interest rates and weakness in the stock market.
Corporate income tax revenues declined by $2.0 billion in 200203, or 8.3 per cent, the second consecutive year they have declined. Although corporate profits increased by 4.3 per cent in 2002, the impact of loss carry-forwards due to the decline in profits in 2001, and a reduction in the corporate tax rate from 27 to 25 per cent effective January 1, 2002, and from 25 to 23 per cent effective January 1, 2003, resulted in a decline in revenues in 200203.
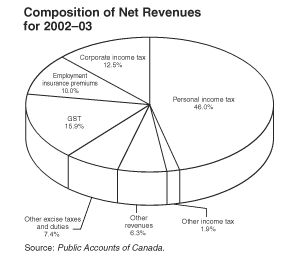
Other taxes and duties increased $4.2 billion, or 11.4 per cent.
- GST revenues increased $3.0 billion, or 11.7 per cent. This increase was fuelled primarily by strong growth in consumer demand, especially durable goods and new housing.
- Customs import duties increased $0.2 billion, or 6.0 per cent, reflecting a strong increase in imports subject to tariffs.
- Energy taxes were up 3.0 per cent, while the impact of tobacco excise tax increases in late 2001 and early 2002 account for most of the increase of $0.5 billion, or 13.2 per cent, in other excise taxes and duties. The Air Travellers Security Charge came into effect April 1, 2002. The revenues from this charge are used to fund the new air security initiatives announced in the 2001 budget.
Table 2
Revenues
|
|
||||
| 200102 | 200203 | Net change | ||
|---|---|---|---|---|
|
|
||||
| ($ millions) | (%) | |||
| Tax revenues | ||||
| Net income tax collections | ||||
| Personal income tax | 79,501 | 81,707 | 2,206 | 2.8 |
| Corporate income tax | 24,242 | 22,222 | -2,020 | -8.3 |
| Other income tax revenues | 2,925 | 3,291 | 366 | 12.5 |
|
|
||||
| Total | 106,668 | 107,220 | 552 | 0.5 |
| Other taxes and duties | ||||
| Goods and services tax | 25,292 | 28,248 | 2,956 | 11.7 |
| Customs import duties | 3,040 | 3,221 | 181 | 6.0 |
| Energy taxes | 4,848 | 4,992 | 144 | 3.0 |
| Air Travellers Security Charge | 421 | 421 | ||
| Other excise taxes and duties | 3,953 | 4,475 | 522 | 13.2 |
|
|
||||
| Total | 37,133 | 41,357 | 4,224 | 11.4 |
| Net tax revenues | 143,801 | 148,577 | 4,776 | 3.3 |
| Employment insurance premium revenues | 17,637 | 17,870 | 233 | 1.3 |
| Net other revenues | ||||
| Crown corporation revenues | 3,172 | 3,478 | 306 | 9.6 |
| Foreign exchange revenues | 2,453 | 3,379 | 926 | 37.7 |
| Other revenues | 4,625 | 4,258 | -367 | -7.9 |
|
|
||||
| Total | 10,250 | 11,115 | 864 | 8.4 |
| Net budgetary revenues | 171,688 | 177,561 | 5,873 | 3.4 |
|
|
||||
Employment insurance premium revenues were up $0.2 billion, or 1.3 per cent, as the reduction in premium rates was more than offset by the increase in the number of people employed and therefore paying premiums. The employee premium rate (per $100 of insurable earnings) was reduced from $2.25 for 2001 to $2.20 for 2002 and to $2.10 for 2003 (with a corresponding decline in the employer rate).
Other revenues consist of net gains/losses from Crown corporations, such as the Bank of Canada, Export Development Canada and Canada Mortgage and Housing Corporation; foreign exchange revenues; and other revenues, primarily revenues from the sales of goods and services. An increase of $0.9 billion, or 8.4 per cent, was recorded in this component, primarily reflecting higher foreign exchange revenues and higher profits from enterprise Crown corporations.
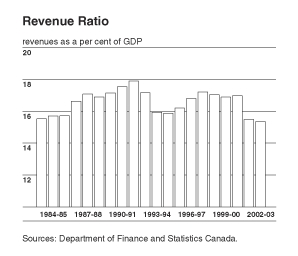
The revenue ratiobudgetary revenues as a percentage of GDPrepresents an approximate measure of the overall federal "tax burden" in that it compares the total of all federal revenues collected to the size of the economy. The revenue ratio stood at 15.4 per cent in 200203, about 1 1/2 percentage points below the ratio in 200001. The decline in the ratio since 200001 primarily reflects the impact of the tax reductions announced in the February 2000 budget and the October 2000 Economic Statement and Budget Update.
It should be noted that some components of income subject to taxation are excluded from the Statistics Canada measure of GDP, such as capital gains and income from trusteed pension plans. As a result, this ratio overstates the tax burden. In addition, the sharp rise in capital gains and the growth in income from trusteed pension plans due to the aging of the population distort year-to-year changes in the ratio. Therefore, caution should be exercised in interpreting this ratio.
The figures in Table 2 are presented on a "net" basis, reflecting the way in which revenues and expenses are presented to Parliament in the Governments annual budget. In this presentation, the Canada Child Tax Benefit is netted against income tax revenues. Certain departmental revenues, such as the revenues of consolidated Crown corporations and revenues levied by departments for specific services, including the contract costs of policing services in provinces, are netted against expenses. This classification has the effect of reducing both revenues and expenses but has no impact on the budgetary balance. Table 3 shows the impact of "grossing up" budgetary revenues for these adjustments. In 200203, they amounted to $12.7 billion, of which $7.8 billion was due to the Canada Child Tax Benefit. As a result, gross budgetary revenues were $190.2 billion in 200203, up 3.6 per cent from 200102.
Table 3
Gross Budgetary Revenues
|
|
||||
| 200102 | 200203 | Net change | ||
|---|---|---|---|---|
|
|
||||
| ($ millions) | (%) | |||
| Net budgetary revenues | 171,688 | 177,561 | 5,873 | 3.4 |
| Adjustments | ||||
| Canada Child Tax Benefit | 7,471 | 7,823 | 352 | 4.7 |
| Revenues netted against program expenses | 2,935 | 3,020 | 84 | 2.9 |
| Revenues of consolidated Crown corporations | 1,582 | 1,827 | 245 | 15.5 |
|
|
||||
| Net adjustment | 11,988 | 12,670 | 682 | 5.7 |
| Gross budgetary revenues | 183,676 | 190,232 | 6,556 | 3.6 |
|
|
||||
Total Expenses
Total expenses consist of two componentspublic debt charges and program expenses. In 200203 total expenses amounted to $170.6 billion, up $5.9 billion, or 3.6 per cent, from 200102 (Table 4). Public debt charges declined by $2.4 billion, or 6.0 per cent, while program expenses advanced $8.3 billion, or 6.6 per cent. Of this increase, $5.3 billion, or nearly two-thirds, was due to higher transfers to the provinces under the September 2000 and February 2003 health agreements.
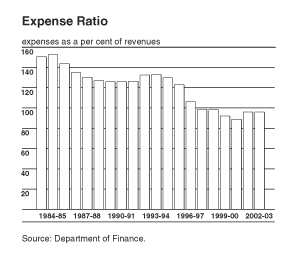
The expense ratiototal expenses as a percentage of net budgetary revenuesstood at 96.1 per cent in 200203, up marginally from 200102. In 199394 the expense ratio stood at 133.2 per cent.
Public debt charges declined by $2.4 billion, or 6.0 per cent, to $37.3 billion in 200203, primarily attributable to a decline in the stock of interest-bearing debt and lower average effective interest rates on that debt.
- The average effective interest rate on the Governments interest-bearing debt (unmatured debt and pension liabilities) was 6.2 per cent in 200203, compared to 6.4 per cent in 200102. The average effective interest rate was 5.3 per cent on unmatured debt and 8.5 per cent on pension and other accounts.
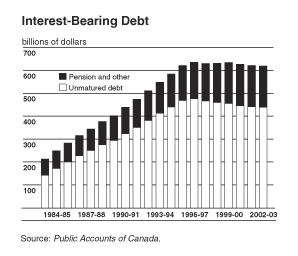
- The stock of total interest-bearing debt declined by $2.1 billion, from $622.9 billion in 200102 to $620.8 billion in 200203, as the stock of market debt declined by $2.5 billion to $439.8 billion, while liabilities to pension and other accounts increased by $0.4 billion to $181.0 billion.
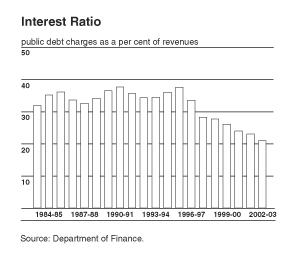
The interest ratiopublic debt charges as a percentage of net budgetary revenuesdeclined from 23.1 per cent in 200102 to 21.0 per cent in 200203. This ratio means that, in 200203, the Government spent 21 cents of every revenue dollar on interest on the public debt. This is down from the peak of 38.7 cents in 199091 and is the lowest this ratio has been since the late 1970s. This is money that must be paid to meet the Governments ongoing obligations on its debt. The lower the ratio, the more flexibility the Government has to address the key priorities of Canadians.
Table 4
Total Expenses
|
|
||||
| 200102 | 200203 | Net change | ||
|---|---|---|---|---|
|
|
||||
| ($ millions) | (%) | |||
| Transfer payments | ||||
| Major transfers to persons | ||||
| Elderly benefits | 24,641 | 25,692 | 1,051 | 4.3 |
| Employment insurance benefits | 13,726 | 14,496 | 770 | 5.6 |
|
|
||||
| Total | 38,367 | 40,188 | 1,821 | 4.7 |
| Major transfers to other levels of government |
||||
| Canada Health and Social Transfer | 17,300 | 18,600 | 1,300 | 7.5 |
| Canada Health and Social Transfer supplement |
2,500 | 2,500 | ||
| Diagnostic/Medical Equipment Fund | 1,500 | 1,500 | ||
| Fiscal arrangements | 11,978 | 10,366 | -1,612 | -13.5 |
| Alternative Payments for Standing Programs |
-2,662 | -2,321 | 341 | -12.8 |
|
|
||||
| Total | 26,616 | 30,645 | 4,029 | 15.1 |
| Subsidies and other transfers | ||||
| Agriculture and Agri-Food | 1,897 | 2,654 | 757 | 39.9 |
| Foreign Affairs and International Trade |
2,405 | 2,456 | 51 | 2.1 |
| Health Canada | 1,617 | 1,619 | 2 | 0.1 |
| Human Resources Development | 1,698 | 1,602 | -96 | -5.7 |
| Indian Affairs and Northern Development |
4,557 | 4,649 | 92 | 2.0 |
| Industry/regional agencies | 2,628 | 2,322 | -306 | -11.6 |
| Canada Foundation for Innovation | 500 | 500 | ||
| Canada Health Infoway | 600 | 600 | ||
| Other | 3,519 | 3,674 | 155 | 4.4 |
|
|
||||
| Total | 18,321 | 20,076 | 1,755 | 9.6 |
| Total transfer payments | 83,304 | 90,909 | 7,605 | 9.1 |
| Other program expenses | ||||
| Crown corporations | ||||
| Canada Mortgage and Housing Corporation |
1,910 | 1,979 | 69 | 3.6 |
| Canadian Broadcasting Corporation | 983 | 1,047 | 64 | 6.5 |
| Other | 1,610 | 1,699 | 89 | 5.5 |
|
|
||||
| Total | 4,503 | 4,724 | 221 | 4.9 |
| Defence | 10,032 | 10,847 | 815 | 8.1 |
| All other departments and agencies | 27,178 | 26,843 | -336 | -1.2 |
|
|
||||
| Total other program expenses | 41,714 | 42,414 | 700 | 1.7 |
| Net program expenses | 125,018 | 133,323 | 8,305 | 6.6 |
| Public debt charges | 39,651 | 37,270 | -2,381 | -6.0 |
| Net expenses | 164,669 | 170,593 | 5,924 | 3.6 |
|
|
||||
Program expenses amounted to $133.3 billion in 200203, an increase of $8.3 billion, or 6.6 per cent, from 200102. Higher entitlements to provinces and territories under the Canada Health and Social Transfer (CHST), coupled with the $1.5-billion transfer to the Diagnostic/Medical Equipment Fund, accounted for nearly two-thirds, or $5.3 billion, of the increase in program expenses.
Major transfer payments to persons increased by $1.8 billion, or 4.7 per cent.
- Elderly benefits consist of Old Age Security, Guaranteed Income Supplement and spouses allowance payments. Total benefits were up $1.1 billion in 200203, reflecting both higher average benefits, which are indexed to inflation, and an increase in the number of recipients.
- Employment insurance benefits increased $0.8 billion in 200203. About half of this increase is attributable to increased regular benefit payments, reflecting the deterioration in the labour market and the accompanying increase in the number of unemployed. Most of the remaining increase is due to higher special benefits, in particular the increase in parental benefits, reflecting the doubling of parental leave from six months to one year.
- The CHSTa block-funded transfersupports health care, post-secondary education, social assistance and social services, including early childhood development. It provides support in the form of cash and tax transfers to the provinces and territories. As part of the September 2000 and February 2003 health agreements, the federal government legislated an incremental $3.8 billion to be paid in 200203of which $2.5 billion was in the form of a special supplement. An additional $1.5-billion investment was provided to the Diagnostic/Medical Equipment Fund to be used by the provinces and territories in support of specialized staff training and equipment, to improve access to publicly funded diagnostic services.
- Total entitlements under fiscal arrangements decreased by $1.6 billion to $10.4 billion, primarily reflecting lower equalization entitlements. The decline in equalization entitlements in 200203 reflects stronger-than-expected economic growth in both 2001 and 2002 in the equalization-receiving provinces relative to the non-equalization-receiving provinces and, hence, a convergence in the estimated provincial fiscal capacity of the equalization-receiving provinces relative to the equalization standard. Under the equalization program, the federal government transfers funds to the less prosperous provinces so that they can provide their residents with public services reasonably comparable to those in other provinces without having to resort to higher-than-average taxation.
- The Alternative Payments for Standing Programs represent recoveries of federal tax point abatements under contracting-out arrangements. These arrangements allow provinces to assume the administrative and financial authority for certain federal-provincial programs. In turn, the federal government provides provinces with tax points, the value of which are netted against total entitlements and accordingly recovered from cash transfers. These recoveries reflect the growth in the value of the tax points.
Subsidies and other transfers advanced by $1.8 billion, or 9.6 per cent. Most of this increase is attributable to increased funding to the Canada Foundation for Innovation ($500 million) and Canada Health Infoway ($600 million), as announced in the February 2003 budget. Liabilities relating to agricultural assistance were up strongly, primarily for crop insurance.
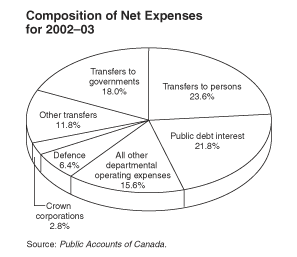
Other program expensestotal program expenses less transfersconsist of expenses related to Crown corporations, and operating expenses of departments and agencies, including National Defence. These expenses amounted to $42.4 billion in 200203, up $0.7 billion, or 1.7 per cent, from 200102. Within this component:
- Expenses related to Crown corporations were up by $0.2 billion to $4.7 billion in 200203. This component includes appropriations to consolidated Crown corporations (those Crown corporations that rely on government funding as their principal source of revenue).
- Defence expenses increased $0.8 billion, or 8.1 per cent, primarily reflecting incremental funding provided in the 2001 and 2003 budgets.
- All other departmental and agency expenses decreased by $0.3 billion, or 1.2 per cent, in 200203, as the 200102 results were affected by the inclusion of a number of large one-time liabilities.
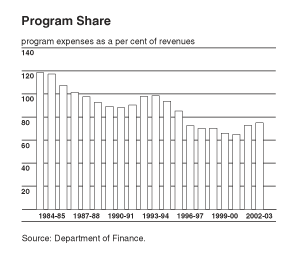
The program shareprogram expenses as a percentage of budgetary revenuesamounted to 75.1 per cent, up from 72.7 per cent 200102. In 199394 the program share was 98.6 per cent.
The above numbers are presented on a "net" basis, as discussed in the previous section, "Budgetary Revenues." Gross expenses are $12.7 billion higher than net expenses, as shown in Table 5.
Table 5
Gross Expenses
|
|
||||
| 200102 | 200203 | Net change | ||
|---|---|---|---|---|
|
|
||||
| ($ millions) | (%) | |||
| Net expenses | 164,669 | 170,593 | 5,924 | 3.6 |
| Adjustments | ||||
| Canada Child Tax Benefit | 7,471 | 7,823 | 352 | 4.7 |
| Revenues netted against expenses | 2,936 | 3,020 | 84 | 2.9 |
| Revenues of consolidated Crown corporations | 1,582 | 1,827 | 245 | 15.5 |
|
|
||||
| Net adjustment | 11,988 | 12,670 | 682 | 5.7 |
| Gross expenses | 176,657 | 183,263 | 6,606 | 3.7 |
|
|
||||
The Budgetary Balance,
Financial Source/Requirement and Debt
The budgetary balance is the most comprehensive measure of the federal governments fiscal results. It is presented on a full accrual basis of accounting, recording government liabilities when they are incurred, regardless of when the cash payment is made, and recording tax revenues only when cash is received.
In contrast, the financial source/requirement measures the difference between cash coming in to the Government and cash going out. It differs from the budgetary balance in that it includes transactions in loans, investments and advances, federal employees pension accounts, other specified purpose accounts, foreign exchange activities, and changes in other financial assets, liabilities and non-financial assets. These activities are included as part of non-budgetary transactions. The conversion from full accrual to cash accounting is also reflected in non-budgetary transactions. Non-budgetary transactions in 200203 resulted in a net source of funds amounting to $0.7 billion, compared to a revised net requirement of $7.3 billion in 200102. The improvement reflects a turnaround in foreign exchange activities and in the pension and other accounts, along with a lower requirement in accounts payable, receivable, accruals and allowances. With the shift to full accrual accounting, a number of classification changes have been incorporated, whereby foreign exchange activities are now part of non-budgetary transactions.
With a budgetary surplus of $7.0 billion and a source of funds from non-budgetary transactions of $0.7 billion, there was a financial source of $7.6 billion in 200203, up from the revised financial requirement of $0.3 billion in 200102.
With this financial source, the Government retired $2.5 billion of its market debt and increased its cash balances by $5.1 billion. Cash balances at March 31, 2003, stood at $16.5 billion.
Total liabilities consist of interest-bearing debt and other liabilities. Interest-bearing debt includes market debt and liabilities for pension and other accounts. At March 31, 2003, interest-bearing debt amounted to $620.8 billion, down $2.1 billion from a year earlier. Other liabilities, which include accounts payable and accrued liabilities, amounted to $79.4 billion, down $2.1 billion from 200102. As a result, total liabilities stood at $700.1 billion.
Financial assets consist of cash and accounts receivable, including tax receivables; foreign exchange accounts; and loans, investments and advances. Financial assets totalled $135.3 billion at March 31, 2003, up $1.9 billion from March 31, 2002. As a result, net debt stood at $564.8 billion at March 31, 2003, down $6.1 billion from March 31, 2002, and $47.5 billion below the peak of $612.3 billion at March 31, 1997.
Table 6
Budgetary Balance, Financial Source/Requirement and Net Financing Activities
|
|
||||||
| 199798 | 199899 | 199900 | 200001 | 200102 | 200203 | |
|---|---|---|---|---|---|---|
|
|
||||||
| ($ billions) | ||||||
| Surplus for the year | 2.1 | 2.8 | 13.1 | 20.2 | 7.0 | 7.0 |
| Non-budgetary transactions | ||||||
| Pension and other accounts | ||||||
| Public sector pensions (net) | 3.3 | 5.0 | 5.9 | 0.8 | -2.3 | -1.2 |
| Canada Pension Plan | 0.5 | 1.2 | 0.8 | 0.2 | 0.4 | 0.3 |
| Other | 0.3 | 1.4 | 0.5 | 1.9 | 0.9 | 1.3 |
|
|
||||||
| Total | 4.1 | 7.6 | 7.2 | 2.9 | -1.0 | 0.4 |
| Capital investing activities | -3.0 | -3.7 | -2.5 | -2.0 | -4.4 | -4.8 |
| Other investing activities | 4.9 | 2.9 | 2.7 | 1.0 | 1.9 | 0.8 |
| Other activities | ||||||
| Accounts payable, receivable, accruals and allowances |
2.8 | -0.3 | -8.1 | -4.4 | -4.6 | -2.2 |
| Foreign exchange activities | -2.2 | -5.7 | -6.8 | -8.8 | -1.8 | 3.1 |
| Amortization of tangible capital assets |
2.3 | 2.3 | 2.3 | 2.3 | 2.6 | 3.3 |
|
|
||||||
| Total other activities | 3.0 | -3.7 | -12.7 | -10.8 | -3.8 | 4.2 |
| Total non-budgetary transactions | 9.0 | 3.1 | -5.3 | -8.9 | -7.3 | 0.7 |
| Financial source/requirement | 11.1 | 5.9 | 7.8 | 11.3 | -0.3 | 7.6 |
| Net change in financing activities |
||||||
| Marketable bonds | 15.8 | 9.6 | -0.9 | 1.0 | -1.1 | -5.6 |
| Treasury bills | -23.1 | -15.4 | 2.9 | -11.2 | 5.5 | 10.4 |
| Canada Savings Bonds | -2.7 | -2.1 | -1.2 | -0.4 | -2.3 | -1.4 |
| Other | 0.5 | 1.0 | -4.9 | 0.5 | -6.2 | -5.9 |
|
|
||||||
| Total | -9.6 | -6.9 | -4.0 | -10.0 | -4.1 | -2.5 |
| Change in cash balances | 1.5 | -1.0 | 3.8 | 1.3 | -4.4 | 5.1 |
| Cash in bank (March 31) | 11.7 | 10.7 | 14.5 | 15.8 | 11.4 | 16.5 |
|
|
||||||
With the implementation of full accrual accounting, the Government is now including the value of its non-financial assets, such as capital assets and inventories, on its balance sheet. At March 31, 2003, non-financial assets amounted to $54.2 billion, up $0.8 billion from a year earlier. As a result, the federal debt (accumulated deficit) stood at $510.6 billion at March 31, 2003, down a total of $52.3 billion from its peak in 199697.
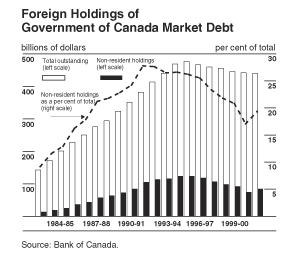
Foreign holdings of the Government of Canadas outstanding market debt are estimated at $84.7 billion at the end of March 2003. This represents 19.3 per cent of the Governments total market debt.
Table 7
Outstanding Debt at Year-End
|
|
||||||
| 199798 | 199899 | 199900 | 200001 | 200102 | 200203 | |
|---|---|---|---|---|---|---|
|
|
||||||
| ($ billions) | ||||||
| Liabilities | ||||||
| Accounts payable and accrued liabilities |
82.2 | 85.8 | 82.2 | 87.0 | 81.5 | 79.4 |
| Interest-bearing debt | ||||||
| Unmatured debt | 467.3 | 460.4 | 456.4 | 446.4 | 442.3 | 439.8 |
| Pension and other accounts | 163.9 | 171.5 | 178.7 | 181.6 | 180.6 | 181.0 |
|
|
||||||
| Total | 631.2 | 631.9 | 635.1 | 628.0 | 622.9 | 620.8 |
| Total liabilities | 713.4 | 717.7 | 717.3 | 715.0 | 704.3 | 700.1 |
| Financial assets | ||||||
| Cash and accounts receivable | 55.2 | 55.9 | 61.0 | 67.0 | 59.8 | 62.6 |
| Foreign exchange accounts | 29.0 | 34.7 | 41.5 | 50.3 | 52.0 | 49.0 |
| Loans, investments and advances |
18.4 | 17.6 | 18.2 | 21.4 | 21.6 | 23.7 |
|
|
||||||
| Total financial assets | 102.5 | 108.2 | 120.7 | 138.7 | 133.4 | 135.3 |
| Net debt | 610.9 | 609.5 | 596.6 | 576.3 | 570.9 | 564.8 |
| Non-financial assets | ||||||
| Tangible capital assets | 43.3 | 44.6 | 44.6 | 44.2 | 45.7 | 47.0 |
| Inventories | 6.0 | 6.1 | 6.3 | 6.6 | 6.4 | 6.1 |
| Prepaid expenses | 0.9 | 0.9 | 0.9 | 0.9 | 1.2 | 1.1 |
|
|
||||||
| Total non-financial assets | 50.2 | 51.7 | 51.8 | 51.7 | 53.4 | 54.2 |
| Federal debt (accumulated deficit) |
560.7 | 557.9 | 544.7 | 524.6 | 517.5 | 510.6 |
|
|
||||||
- Table of Contents - Next -
| Last Updated: 2003-11-18 |
|
||||