Finance Canada
Budget 2000 - Budget Plan, Chapter 3: Maintaining Sound Financial Management -
3
- Français - Table of Contents - Previous - Next
-
The revenue outlook to 2001-02 is summarized in Table 3.5.
Through the first nine months of 1999-2000, budgetary revenues were up 3.2 per cent over the same period in 1998-99. During the balance of the year, revenue growth is expected to slow somewhat relative to the same period last year. This primarily reflects the reduction in EI premium rates, the ongoing impact of the tax relief measures announced in the 1998 and 1999 budgets and a slowdown in GST revenues, attributable to higher refunds and rebates. For the year as a whole, budgetary revenues are expected to be up 2.8 per cent from 1998-99.
Table 3.5
The Revenue Outlook
| 1997- 1998 |
1998- 1999 |
1999- 2000 |
2000- 2001 |
2001- 2002 |
|
|---|---|---|---|---|---|
(billions of dollars) |
|||||
| Income tax revenues | |||||
| Personal income tax | 70.8 | 72.5 | 76.5 | 75.9 | 78.7 |
| Corporate income tax | 22.5 | 21.6 | 22.5 | 23.9 | 24.8 |
| Other income tax | 3.0 | 2.9 | 3.3 | 3.5 | 3.6 |
| Total income tax | 96.3 | 97.0 | 102.3 | 103.2 | 107.1 |
| Employment insurance premiums | 18.8 | 19.4 | 18.6 | 18.2 | 18.0 |
| Excise taxes and duties | |||||
| Goods and services tax | 19.5 | 20.7 | 22.1 | 23.1 | 24.5 |
| Customs import duties | 2.8 | 2.4 | 2.2 | 2.3 | 2.3 |
| Other excise taxes/duties | 8.6 | 8.4 | 7.8 | 8.2 | 8.6 |
| Total | 30.9 | 31.4 | 32.0 | 33.5 | 35.4 |
| Total tax revenues | 145.9 | 147.7 | 152.8 | 154.9 | 160.7 |
| Non-tax revenues | 7.2 | 7.9 | 7.2 | 7.2 | 7.4 |
| Total budgetary revenues | 153.2 | 155.7 | 160.0 | 162.0 | 168.0 |
| Percentage of GDP | |||||
| Total budgetary revenues | 17.5 | 17.4 | 16.9 | 16.2 | 16.1 |
| Total excluding impact of 1998, 1999 and 2000 budget measures |
17.5 | 17.6 | 17.5 | 17.6 | 17.6 |
| Note: Numbers may not add due to rounding. | |||||
For 2000-01, growth in total budgetary revenues is expected to slow to 1.3 per cent, reflecting the impact of the tax relief measures from the 1998, 1999 and 2000 budgets. For 2001-02, budgetary revenues are expected to rebound somewhat but still grow more slowly than the growth in the applicable tax bases, reflecting the incremental impact of the tax relief measures.
Personal income tax collections, the largest single source of federal revenues, are expected to increase 5.5 per cent in 1999-2000, following an increase of only 2.4 per cent in 1998-99. Revenues in 1998-99 were depressed due to transfers to the Tax Collection Agreement Accounts, reflecting underpayments related to previous taxation years, and due to the impact of the tax relief measures announced in the 1998 budget.
In 2000-01, personal income tax revenues are projected to decline, reflecting the impact of the tax relief measures proposed in this budget, as well as the incremental impacts of the tax relief measures announced in the 1998 and 1999 budgets. In 2001-02, personal income tax collections are expected to grow 3.8 per cent, as the ongoing impacts of the tax relief measures proposed in this budget dampen the impact of the growth in the applicable tax base.
During the first nine months of 1999-2000, corporate income tax collections were up 2.0 per cent. They are expected to average about 10 per cent more than 1998-99 levels for the remainder of the year. Under remittance regulations, corporations make monthly instalments based on the lesser of their current year’s or previous year’s tax obligation. Final settlement payments for a taxation year are normally made two months after the end of the taxation year – with the majority being made in February and March. Corporate profits rebounded strongly in 1999, following a decline in 1998. Consequently, settlement payments in the February and March 2000 period are expected to be significantly greater than the payments made in the 1999 settlement period.
For 2000-01, growth in corporate income tax collections is expected to further increase to 6.0 per cent, reflecting continued gains in profitability. A moderation in growth is expected in 2001-02, in part due to the reduction in the general tax rate.
EI premium revenues are expected to decline 4.2 per cent in 1999-2000 as the reduction in premium rates for 1999 and 2000 more than offsets the effects of increased employment and wages. The premium rate for 1999 was $2.55 (employee rate per $100 of insurable earnings), down from $2.70 in 1998. For 2000, the employee rate has been set at $2.40. Prior-year adjustments in 1998-99, relating to underpayments for the 1997 taxation year, also contributed to the decrease.
For planning purposes, the Government is assuming a 10-cent per year decline in EI premium rates, moving towards the point where premiums would cover only ongoing program costs. Premium rates are set each year in the fall. The Government is closely examining the recommendations of the House of Commons Standing Committee on Finance on future premium rate setting. For 2000-01, EI premium revenues are projected to continue to decline, as the assumed reduction in premium rates is expected to more than offset the gains from higher employment.
GST revenues are expected to increase 6.6 per cent in 1999-2000, somewhat faster than the growth in consumption of goods and services subject to the tax. Continued robust growth in consumer spending will sustain the growth of GST receipts in both 2000-01 and 2001-02. Other excise tax collections are expected to decline in 1999-2000, largely due to the elimination of the Air Transportation Tax.
Non-tax revenues include returns on investments, most notably Bank of Canada profits and Exchange Fund earnings, and other non-tax revenues. Non-tax revenue is expected to decline in 1999-2000 because of recoveries related to previous years’ expenditures that increased revenues in 1998-99. Thereafter, they are projected to be relatively stable.
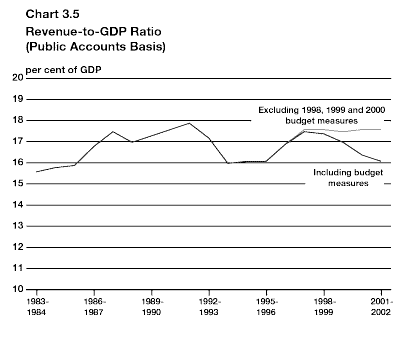
Measures proposed in this budget and announced in the previous two budgets will significantly lower the ratio of budgetary revenues to GDP over the two-year outlook horizon. In the absence of these measures, the ratio would have remained relatively stable at around 17.6 per cent (Chart 3.5). With these measures, it is expected to decline from 17.4 per cent in 1998-99 to 16.1 per cent in 2001-02. Including the measures proposed in the Five-Year Tax Reduction Plan, the revenue ratio should continue to fall.
Table 3.6 presents the major components of program spending – total budgetary expenditures excluding interest on the public debt – through to 2001-02. The profile of program spending reflects the impact of the initiatives announced since the 1999 budget, including those in this budget.
In 1993-94, program spending amounted to $120.0 billion. Reflecting the impact of the restraint measures implemented in the 1994, 1995 and 1996 budgets, program spending fell to $104.8 billion in 1996-97 – the year before the federal government recorded its first budgetary surplus in nearly 30 years. The restraint measures included:
With the era of deficit financing over, the 1997, 1998 and 1999 budgets began to make strategic investments in key priorities for Canadians – health care, innovation and access to knowledge and skills – in addition to providing tax relief. The 1997 budget provided initial funding of $800 million to the Canada Foundation for Innovation. In the 1998 budget, the CHST cash floor of $11 billion, which was established in 1996, was raised to $12.5 billion effective 1997-98. The 1999 budget committed an additional $11.5 billion to the CHST over five years for health care. The 1998 budget provided $1.5 billion per year to the Canadian Opportunities Strategy to support the acquisition of knowledge and skills through measures such as the creation of the Canada Millennium Scholarship Foundation and the Canada Education Savings Grant. Building on that strategy, the 1999 budget provided additional support for the creation, dissemination and commercialization of knowledge and innovation, bringing total investment in support of skills and access to knowledge to about $1.8 billion in the current fiscal year, rising to $2 billion next year.
In this budget, the Government is providing incremental funding, on a carefully targeted basis, to a number of departments facing immediate pressures to ensure that core public service functions are maintained. This includes an enhancement of existing farm income disaster assistance to help manage the farm crisis, incremental funding to help National Defence meet its obligations, and funding to the Royal Canadian Mounted Police to combat organized crime and meet its undertakings with provinces. As noted in Chapter 5, the Government’s own infrastructure requires improvement to address health and safety concerns and to maintain services. In addition, federal departments, like the private sector, need to be able to take full advantage of the new technologies so that they can serve Canadians in the most efficient and cost-effective manner possible.
Including the initiatives announced in this budget and the previous two budgets, program spending is expected to amount to $116 billion in 2000-01, $4 billion lower than the level of spending in 1993-94. Over this time period, consumer prices are expected to increase by about 11 per cent and population by 7.4 per cent, for a projected cumulative increase of about 19 per cent. This implies that program spending would decline over 20 per cent in real per capita terms.
Over the planning horizon, program spending is expected to increase to $121.5 billion in 2001-02, an increase of $1.5 billion from the level reported in 1993-94. Since 1997-98, this represents an annual average increase of 2.8 per cent. This is in line with the expected average inflation and population growth of 2.7 per cent over this period. As a share of GDP, program spending is projected to continue to decline over the planning horizon – from 12.4 per cent in 1997-98 to 11.6 per cent in 2001-02 – the lowest ratio in over 50 years.
Program spending falls into three components, which are reviewed in the following sections: major transfers to persons, major transfers to other levels of government and direct program spending.
Major transfers to persons consist of elderly benefits – Old Age Security, the Guaranteed Income Supplement and the Spouse’s Allowance – and EI benefits.
Elderly benefits are expected to continue to rise steadily over the outlook period, reflecting the growth in both the senior population and average benefits, which are fully indexed to consumer prices.
EI benefits are estimated at $11.7 billion for 1999-2000, down slightly from 1998-99, as a decrease in the number of people unemployed offsets increases in the weekly benefit rate and in payments under the Labour Market Development Agreements with most provinces and territories. A slight increase is expected in 2000-01, as increases in the average benefit rate and in transfers under the Labour Market Development Agreements offset the impact of the further projected decline in the unemployment rate. The fiscal impact of the proposed extension of parental benefits amounts to $0.6 billion in 2001-02 and accounts for most of the increase in benefits in that year.
Table 3.6
The Outlook for Program Spending
| 1997- 1998 |
1998- 1999 |
1999- 2000 |
2000- 2001 |
2001- 2002 |
|
|---|---|---|---|---|---|
(billions of dollars) |
|||||
| Major transfers to persons | |||||
| Elderly benefits | 22.2 | 22.8 | 23.3 | 24.2 | 25.0 |
| Employment insurance benefits | 11.8 | 11.9 | 11.7 | 11.8 | 12.8 |
| Total | 34.1 | 34.7 | 35.0 | 36.0 | 37.8 |
| Major transfers to other levels of government | |||||
| CHST1 | 12.4 | 12.5 | 12.5 | 13.5 | 14.5 |
| CHST cash supplement2 | 3.5 | 2.5 | |||
| Fiscal transfers | 10.2 | 11.6 | 11.0 | 11.5 | 12.1 |
| Alternative payments for standing programs | -2.1 | -2.1 | -2.4 | -2.4 | -2.5 |
| Total | 20.5 | 25.5 | 23.6 | 22.6 | 24.1 |
| Direct program spending | |||||
| Subsidies and other transfers | |||||
| Agriculture | 0.8 | 0.8 | 1.7 | 1.3 | 1.2 |
| International Assistance Envelope | 1.9 | 2.1 | 2.2 | 2.1 | 2.2 |
| Health | 0.9 | 1.2 | 1.1 | 1.2 | 1.3 |
| Human Resources Development | 2.1 | 2.4 | 2.3 | 2.8 | 3.0 |
| Indian Affairs and Northern Development | 4.3 | 4.1 | 4.1 | 4.3 | 4.3 |
| Industry and regional agencies | 2.2 | 2.3 | 3.2 | 2.3 | 2.4 |
| Veterans Affairs | 1.4 | 1.4 | 1.4 | 1.4 | 1.4 |
| Other | 8.9 | 4.5 | 4.2 | 4.3 | 4.4 |
| Total | 22.5 | 18.7 | 20.2 | 19.6 | 20.2 |
| Crown corporations | 2.5 | 3.5 | 3.8 | 4.1 | 4.0 |
| Departmental operating and capital | |||||
| Defence | 8.9 | 8.8 | 9.9 | 9.4 | 9.5 |
| All other | 20.3 | 20.2 | 23.0 | 24.3 | 26.0 |
| Total direct program spending | 54.2 | 51.2 | 56.9 | 57.4 | 59.7 |
| Total program spending | 108.8 | 111.4 | 115.5 | 116.0 | 121.5 |
| 1 Reflects profile of CHST
cash as accounted for by the federal government (Chapter 6). 2 CHST cash supplement in 1999-2000 will be paid to a third-party trust in 2000-01, on passage of authorizing legislation. Note: Numbers may not add due to rounding. |
|||||
| Budget 2000 Publications | Budget 2000 Main Page |