
Public Health Agency of Canada
www.publichealth.gc.ca
Common menu bar links
Institutional links
Diseases & Conditions
Health & Safety
Research & Statistics
Agency Information
Search Box
Healthy settings for young people in Canada
Previous | Table of Contents | Next
Overweight and Obesity Levels among Young Canadians
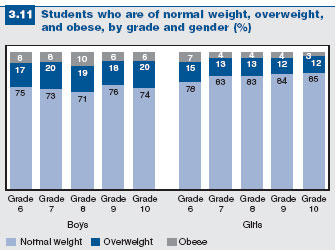
Figure 3.11 illustrates the proportion of young people who are of normal weight, overweight, and obese. The majority are of normal weight, 12 to 20% are overweight, and 3 to 10% are obese. The rates of both overweight and obesity are higher in boys than in girls. In total, approximately 26% of boys and 17% of girls are either overweight or obese.
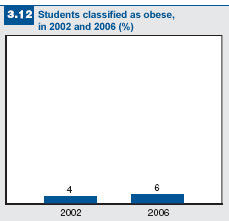
Despite the promising upward trend in physical activity (see Figure 3.2) and downward trend in consumption of sweets (see Figure 3.10), obesity among young people shows an increase from 4% in 2002 to 6% in 2006 (Figure 3.12).
Body image and weight-loss practices of Canadian students
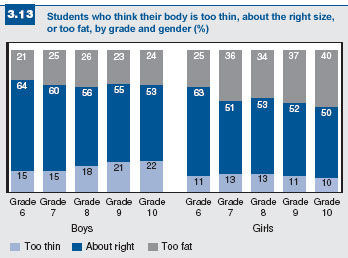
According to the 2006 HBSC findings, between 50 and 64% of students think their body is just right, depending on grade and gender. Fifteen to 22% of boys and 10 to 13% of girls believe that their body is too thin (Figure 3.13). These rates remain relatively stable with advancing grade in girls, but increase in boys from Grade 6 to Grade 10. In contrast, more girls than boys believe that their body is too fat, with rates in advancing grade remaining relatively stable in boys. Rates increase sharply in girls with advancing grade, such that, by Grade 10, 40% of girls believe their body is too fat.
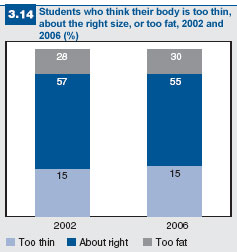
Young people’s body perceptions have not changed very much from 2002 to 2006 (Figure 3.14).
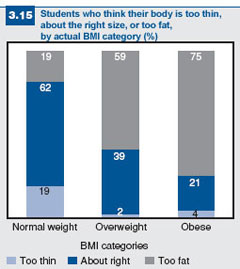
There is a strong relationship between students’ body image and their BMI (Figure 3.15). For instance, only 4% of obese students believe they are too thin, while 75% of obese students believe they are too fat. It is a cause for concern, however, that only 62% of young people of normal weight feel that their body is about the right size.
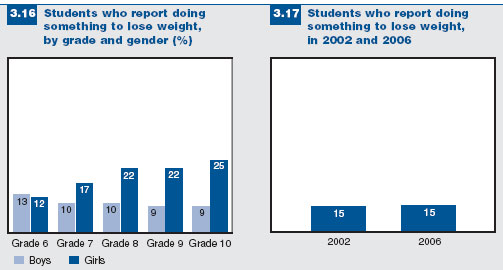
More girls than boys are doing something to lose weight (Figure 3.16), with the percentage of those trying to lose weight decreasing with advancing grade in boys, but increasing in girls.
As illustrated in Figure 3.17, the proportion of those trying to lose weight has remained stable from 2002 to 2006.
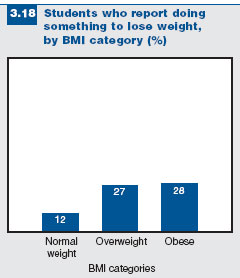
There is a strong relationship between weight-loss practices and BMI category, such that almost 30% of overweight and obese students are trying to lose weight, compared to 12% of those of normal weight (Figure 3.18).
There is a strong relationship between weight-loss practices and BMI category, such that almost 30% of overweight and obese students are trying to lose weight, compared to 12% of those of normal weight (Figure 3.18).
Previous | Table of Contents | Next