
Public Health Agency of Canada
www.publichealth.gc.ca
Common menu bar links
Institutional links
Diseases & Conditions
Health & Safety
Research & Statistics
Agency Information
Search Box
Healthy settings for young people in Canada
Previous | Table of Contents | Next
Healthy Living and Healthy Weight in Context
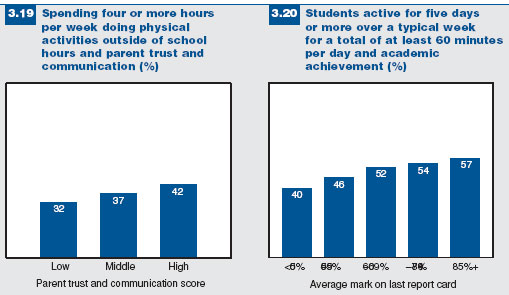
Among students with a high score on the parent trust and communication scale, 42% report being physically active in their free time outside of school, compared to 32% of students with a low score on the scale (Figure 3.19).
Physical activity is also related to academic achievement, with 57% of those with an average mark of 85% or higher being physically active five days or more per week for at least 60 minutes, compared to only 40% of those with marks of less than 50% (Figure 3.20).
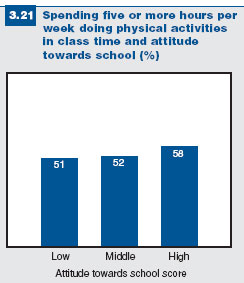
 The percentage of students participating
in physical activity increases slightly with
higher attitude towards school scores.
Fifty-eight percent of students with a
high score on the attitude towards school
scale report being active for five or more
hours per week during class time, while
51% of those with a low score report
being active (Figure 3.21).
The percentage of students participating
in physical activity increases slightly with
higher attitude towards school scores.
Fifty-eight percent of students with a
high score on the attitude towards school
scale report being active for five or more
hours per week during class time, while
51% of those with a low score report
being active (Figure 3.21).
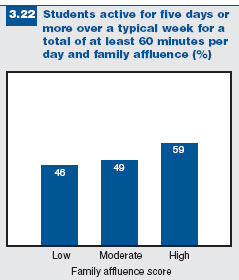
As shown in Figure 3.22, 59% of students with high family affluence are likely to be physically active, while only 46% of students with low family affluence are physically active.
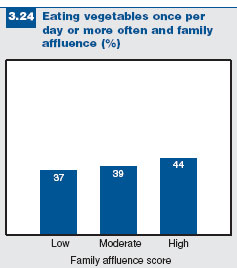 Similarly, 44% of those with a high family affluence score are frequent consumers
of vegetables, compared to 37% of those
with low family affluence (Figure 3.24).
Similarly, 44% of those with a high family affluence score are frequent consumers
of vegetables, compared to 37% of those
with low family affluence (Figure 3.24).
| Consistent patterns in young people’s food consumption are noticeable in relation to the family affluence scale: young people with higher family affluence are more likely to consume vegetables, fruit, and low-fat or skim milk and less likely to consume non-diet soft drinks at least once per day. |
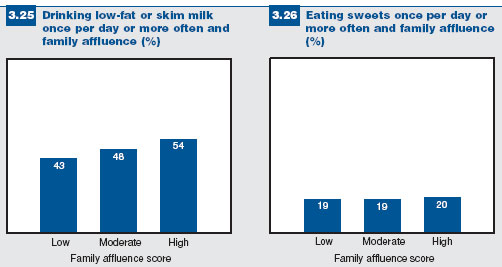
Fifty-four percent of participants with high family affluence are frequent consumers of low-fat or skim milk, compared to 43% of those with low family affluence (Figure 3.25).
The consumption of candy/chocolate is consistent across family affluence categories (Figure 3.26).
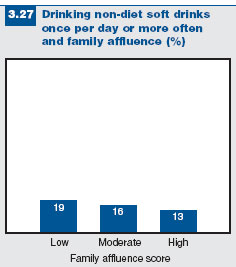
As shown in Figure 3.27, a higher percentage of those with a low family affluence score are frequent drinkers of non-diet/sugary soft drinks, compared to those with moderate and high family affluence scores.
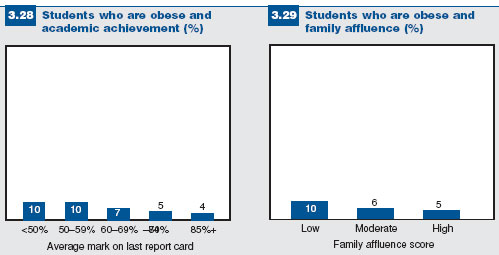
There is a relationship between obesity and two of the contextual variables examined in the HBSC study: academic achievement and family affluence.
Obesity increases in relation to poorer academic achievement, moving from 4% in students with marks of 85% or higher to 10% in students with marks of less than 50% (Figure 3.28). Likelihood of obesity increases with lower family affluence, doubling from 5% among students with high family affluence to 10% among students with low family affluence (Figure 3.29).
Summary
There are several important findings in this chapter. First, the percentage of physically inactive and sedentary students in Canada is alarmingly high. In contrast, the percentage of students reporting daily consumption of fruits, vegetables, and lowfat/ skim milk is low. Given these findings, it is not surprising that 1 in 5 school-aged Canadians are overweight or obese. The problems of inactivity and obesity are particularly apparent in young individuals from homes with the lowest level of family affluence.
Bibliographie
- Société canadienne de pédiatrie (2003). « Impact of media use on children and youth », Paediatric and Child Health, vol. 8, p. 301–306.
- Deckelbaum, R.J., et C.L. Williams (2001). « Childhood obesity: The health issue », Obesity Research, vol. 9 (suppl. 4), p. 239S–243S.
- Prochaska, J.J., J.F. Sallis, et B. Long (2001). « A physical activity screening measure for use with adolescents in primary care », Archives of Pediatric and Adolescent Medicine, vol. 155, p. 554–559.
- Voir la note 1 ci–dessus.
- Cole, T.J., M.C. Bellizzi, K.M. Flegal, et W.H. Dietz (2000). « Establishing a standard definition for child overweight and obesity worldwide: international survey », British Medical Journal, vol. 320, p. 1240–1243.