| |
|||||||||||||||||
|
Volume 22, No. 1 - 2001
|
The Duration of Major Depressive Episodes in the Canadian General Population
Abstract The National Population Health Survey (NPHS) has provided a wealth of
new data concerning major depression in the Canadian general population.
The NPHS included a brief predictor of major depression, and also two
questions (only one of which was asked of each subject) concerned with
the duration of episodes in the preceding year. A striking finding was
that many of the episodes identified were very brief. In this paper the
NPHS data were examined from a different perspective in order to derive
a complementary perspective on the episode duration data. Data from the
1994/95 and 1996/97 cycles of the NPHS were used in the analysis. The
longitudinal data were used to generate approximations of age and gender-specific
incidence for members of the population over the age of 12 years. An estimate
of prevalence was made from the 1996/97 cross-sectional file. A basic
expression relating prevalence to incidence and mean duration of illness
was then applied within age and gender categories. Taken together, the
incidence and prevalence data from the NPHS suggest a longer duration
than was indicated by the NPHS interview duration item. A probable explanation
is that the NPHS duration question had an upper limit of 52 weeks, whereas
some episodes of major depression last longer than this. Particularly
long episodes could have a large impact on mean duration in the population.
Nevertheless, these data confirm the heterogenous nature of this condition;
many people with the syndrome of major depression may have quite brief
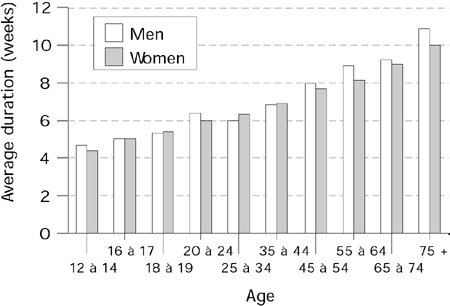
episodes. Introduction A variety of prevalence estimates for major depression have been reported in various countries.1-7 Recent estimates of the 12-month period prevalence of major depression in the Canadian population derive from the Canadian National Population Health Survey (NPHS) 8,9 and the Mental Health Supplement of the Ontario Health Survey.10 Estimates from several additional Canadian surveys have been published.11,12 Since the NPHS is a longitudinal study, it is possible to approximate incidence using the NPHS data,13 with the proviso that the follow-up interval for the longitudinal component of the NPHS is two years and the measurement instrument employed identifies episodes occurring only in the 12-month period preceding the interview. The proportion of non-depressed subjects in 1994/95 who were subsequently found to have major depression in 1996/97 may overestimate the annual incidence proportion, since it may include some persons with an onset of major depression in the year following the 1994/95 interview. This would occur if these episodes did not resolve until two weeks or more into the year preceding the 1996/97 interview. These subjects would appear in the numerator of the incidence expression, inflating the estimated incidence proportion. The NPHS is an ongoing longitudinal community study conducted by Statistics Canada. A national sample consisting of more than 17,000 subjects was interviewed in 1994/95, then re-interviewed in 1996/97 in the longitudinal component. The 1996/97 data collection cycle also included many "buy-ins" from specific provinces, such that the cross-sectional data from the 1996/97 cycle included over 80,000 subjects (a minority of whom were subjects being followed up two years after the initial data collection). The NPHS interview incorporated a short form version of the Composite International Diagnostic Interview (CIDI), called the Short Form for Major Depression.14 This brief predictive instrument assigns a probability of major depression using a set of questions adapted from the CIDI by Kessler et al.14 Subjects reporting at least five of nine symptoms constituting the "A" diagnostic criteria for major depression in DSM-IV, when at least one of these symptoms is depressed mood or loss of interest, are assigned a predictive probability of 90%. The CIDI short form includes two branched series of questions. Neither branch is followed when a subject does not report a two-week period of depressed mood or a two-week period of loss of interest. Subjects reporting the former symptom follow one branch and subjects reporting the latter symptom (but not the former) follow the other branch. Each branch includes questions about other depressive symptoms requisite to the DSM-IV definition of major depression. Each branch also contains a question about the duration of depression, asking those subjects whose responses indicated an episode of depression to report the total number of weeks in the preceding year that they felt "this way" (the question was preceded by a summarizing statement referring to the occurrence of an episode of depression in the preceding 12 months, and incorporating key phrases for reported symptoms and their duration). Surprisingly brief durations were reported; they are presented in Figure 1.
|
|||||||||||||||||||||||||||||||||||||||||||||||||||||||||||||||||||||||||||||||||||||||||||||||||||||||||||||||||||||||||||||||||||||||||||||||||||||||||||||||||||||||||||||||||||||||||||||||||||||||||||||||||
|
* Adapted from: Statistics Canada's Internet site <http://www.statcan.ca/english/Pgdb/People/Health/health35.htm>. |
||||||||||||||||||||||||||||||||||||||||||||||||||||||||||||||||||||||||||||||||||||||||||||||||||||||||||||||||||||||||||||||||||||||||||||||||||||||||||||||||||||||||||||||||||||||||||||||||||||||||||||||||||
|
The objective of this project was to estimate the mean duration of major depressive episodes using an alternative approach: by integrating the available incidence and prevalence data. This provides an alternative perspective on the duration of these episodes.
A retrospective cohort analysis was used to estimate age- and gender-specific incidence proportions. Using data collected in 1994/95, all subjects who were under the age of 12 and all subjects with major depression (according to the CIDI-SFMD) were excluded. The remaining subjects were assessed in the 1996/97 data set in order to estimate the proportion of these subjects who had newly developed major depression. Standard errors for these estimates were calculated using a bootstrap method recommended by Statistics Canada. The bootstrap variance estimates were calculated using an SAS16 macro developed by Statistics Canada for this purpose. All estimates used sampling weights to adjust for unequal selection probabilities due to the complex survey sampling strategies employed by Statistics Canada in this survey. Prevalence estimates were made from the 1996/97 NPHS data, since the sample size for this data collection cycle was much greater than that of the 1994/95 survey. Again, the data were weighted, this time using a different set of sampling weights produced specifically for the relevant data file. Bootstrap methods were used to calculate confidence intervals for the prevalence estimates. In order to integrate the incidence data into a broader epidemiological context, an incidence-prevalence model was used. This model represented the relationship between incidence and prevalence in an assumed stable population (and in the absence of migration) as an equality between the inflow of new cases into a prevalence pool and the outflow from the prevalence pool. The outflow includes all terminations of disease, including recovery and death. This model was described by Rothman and Greenland,17 as follows. In a stable population, the inflow of new cases into the pool of cases (prevalence pool) equals the outflow from the prevalence pool:
Here, the ratio on the left side of the equation is the prevalence odds, a parameter that approximates prevalence when a disorder is rare. For the purpose of this analysis, point prevalence was considered equivalent to one-month period prevalence. One-month period prevalence is often considered equivalent to point prevalence in psychiatric epidemiology because definitions of mental disorders include a requirement not only for the presence of signs and symptoms, but also for the persistence of these signs and symptoms over several weeks. For major depression, the symptoms must persist over at least two weeks. To perform the calculations using months as the time unit, it was necessary to denominate the incidence as a compatible person-month rate by estimating a monthly incidence rate that would be expected to result in the observed incidence proportion over a one-year period. For the purpose of generating this approximation, the "exponential formula" was used:
Here, IP is the approximation of the incidence proportion from the longitudinal NPHS data and Ik is a monthly incidence rate that would result in this incidence proportion over a 12-month follow-up interval. The latter estimate is the one suitable for substitution into Equation 2. If episode duration is measured in months, then the Ik rate (which has the units months-1) will result in a dimensionless prevalence odds. The NPHS survey used a 12-month predictor of major depression prevalence, whereas current prevalence is the parameter of most relevance to the model under development. It was, therefore, necessary to estimate current prevalence by combining the NPHS data with supplementary information from the literature. Fortunately, the literature in this area was found to be strikingly consistent. Kessler et al.,18 using data from 15-24 year-olds participating in the National Comorbidity Survey (NCS), reported that the ratio of annual to current (30-day) major depression was 12.4% to 5.8%, or approximately 2:1, this ratio being similar in male (9.0% to 3.8%) and female (16.1% to 8.0%) subjects. The overall 12-month period prevalence of major depression in the NCS was 10.3%,19 compared to the 4.9% one-month period prevalence,1 a ratio also approximating 2:1. The ratio of annual to current cases in the NCS was similarly comparable among male (7.7% and 3.8%, respectively) and female respondents (12.9% and 4.9%, respectively). Since the NCS is an American study, the ratio of annual to current major
depression was also examined using published data from an earlier survey
conducted in Edmonton. This study utilized methods resembling those employed
in the Epidemiological Catchment Area (ECA) studies in the United States.
Here, an annual prevalence of 4.6% and a one-month prevalence of 2.3%
were reported, a 2:1 ratio.11 The ECA study itself reported
a one-year prevalence of (4.2%)20 and a one-month period prevalence
of 2.2%,4 also closely approximating 2:1. Based on these very
consistent findings, the ratio of annual to current major depression in
this analysis was taken to be 2:1 for both men and women. Hence, prior
to estimation using equation 2, the annual prevalence from the NPHS was
multiplied by 0.5 to generate an approximation of point (30-day) prevalence. The 1994/95 NPHS had a sample size of 17,626. The longitudinal data file included 15,670 subjects providing follow-up data. The current analysis excluded subjects who were under the age of 12 (n = 1908), subjects who had major depression at baseline (n = 781) or who did not provide valid data on the major depression predictor either at the baseline interview, the follow-up interview or both (n = 691). As such, the current analysis of incidence was based on 12,290 subjects. The prevalence estimates were based on 70,538 subjects over the age of 12 in the 1996/97 cross-sectional component of the NPHS. The sample included 73,402 subjects within this age group, but 2,864 (3.9%) who did not provide a valid rating on the CIDI Short Form were excluded. The age- and gender-specific incidence of major depression, along with 95% confidence intervals, are presented in Table 1. The observed pattern of incidence generally resembled that of prevalence, as depicted in Table 2. Among female subjects, incidence and prevalence tended to be higher in younger women and to decline with advancing age. In males, the incidence rates tended to be slightly higher in middle-aged than in younger subjects. In the subjects aged 75 years and older, the incidence and prevalence increased slightly in both genders. The prevalence-incidence model embodied in equations 1 and 2 relates incidence and the prevalence proportion (approximately, prevalence) to the mean duration of disease irrespective of whether the disease is terminated by recovery or death. Completing these calculations for each age and gender group yielded the data presented in Table 3. There is no evidence of gender differences in model-based estimates of disease duration, nor is there a pronounced trend towards such differences in association with age. However, the duration of the episodes, as predicted by the incidence-prevalence model, appears to be more brief in the youngest age group. |
||||||||||||||||||||||||||||||||||||||||||||||||||||||||||||||||||||||||||||||||||||||||||||||||||||||||||||||||||||||||||||||||||||||||||||||||||||||||||||||||||||||||||||||||||||||||||||||||||||||||||||||||||
|
||||||||||||||||||||||||||||||||||||||||||||||||||||||||||||||||||||||||||||||||||||||||||||||||||||||||||||||||||||||||||||||||||||||||||||||||||||||||||||||||||||||||||||||||||||||||||||||||||||||||||||||||||
|
Discussion The development of this model incorporated a variety of assumptions. Some assumptions are involved in the estimation of incidence rates using an exponential equation. The use of this equation involves assumptions that the population is closed, that there are no competing risks (often, the equation is used to estimate mortality rates) and that the number of events is small relative to the number at risk.17 Another assumption was that the 12-month incidence proportion was being measured by the CIDI Short Form. The CIDI Short Form questions are designed to cover a 12-month period, but since the population at risk was identified as those not having major depression during the two previous years it is possible that some of the episodes had their onset more than one year prior to the interview. There may be additional measurement concerns related to the CIDI Short Form. This instrument does not include many of the "clinical significance" probes that are contained in the full CIDI and may, therefore, be less specific in its measurement properties. Finally, the relationship between annual and current prevalence had to rely on data from the literature. Since none of these assumptions can be definitely shown to hold true, the model presented here should be regarded as a heuristic one. It provides a description of the relationship between major depression incidence and prevalence in Canada using the best available data. Furthermore, for a recurrent condition such as major depression, differences in the approach to modelling may be fruitful. For example, the "lifetime sick day proportion" 21 has been proposed as a means of modelling the relationship between incidence and prevalence in episodic conditions accounting both for episode duration and number of episodes. However, such models will also generally be subject to various approximations and assumptions.21 Despite these provisos, the model presented here appears to provide a description of incidence-prevalence relationships that are consistent with other available data. The NPHS incidence rates are approximately consistent with those reported elsewhere in the literature. In making such comparisons, it should be emphasized that the NPHS measures major depressive episodes, not disorders, so that the incidence rates are higher than those studies evaluating the first occurrence of depressive episodes (these first episodes being considered the first onset of an episodic depressive disorder in some studies). One recent German study reported a 20-month incidence of major depression in an adolescent sample,22 3.7% in male and 7.5% in female respondents. These authors estimated that the 12-month incidence in their sample would have been approximately 4.3%. Another prospective study of high school-aged adolescents reported annual incidence rates for major depression of 10.4% for female and 4.8% for male subjects.23 One study of the incidence of major depression in a very elderly (mean age 85) sample reported an annual incidence of 1.4%.24 All of these findings are very consistent with the data presented here. The six-month follow-up of the Epidemiological Catchment Area survey in New Haven reported a 4.3% six-month incidence.25 As a six-month incidence estimate (and from a study of older subjects), the New Haven figure is higher than that of the German study, which is a surprising result. The New Haven estimate may, however, be an overestimate as a result of measurement problems arising when the Diagnostic Interview Schedule is used in follow-up studies.26 An advantage of the data source for this project (the NPHS) over prior studies is that it provides an estimate of incidence and prevalence based on a comparable measure. The predicted episode duration seems consistent with previous reports. Some community studies evaluating the duration of depressive episodes have reported comparable durations of episodes. For example, the mean duration of major depression in the Lewinsohn et al. adolescent sample was 23.6 weeks.23 However, other studies have reported more brief average episode durations. For example, Rao et al.27 reported an average episode duration of 10.3 weeks in a sample consisting of 17- and 18-year old women. Data from the Baltimore ECA follow-up study found that the median episode duration in that sample was only 12 weeks28 and Kendler's follow-up of a community sample of female twin pairs reported a median time to recovery of only eight weeks.29 These values for median duration are brief relative to the model-based estimate of mean episode duration from this study. This may relate to a right skew in the distribution of episode durations. Community studies have confirmed that a proportion of persons with major depression experience very protracted episodes. One analysis of ECA follow-up data found that 23.6% of subjects with major depression at baseline remained depressed after one year.30 A study following a series of 78 clinical patients with major depression (probably with more severe and complicated disorders than those in the community studies) found that only 34 (48.6%) had recovered after one year. These findings suggest that most episodes of major depression in the community are brief (hence, having median durations less than three months), but that a proportion of persons experience very prolonged episodes, causing the mean duration to be greater than the median. In Kendler et al.'s study, mean episode duration was twice as long as median duration.29 Any study relying on a finite and relatively brief follow-up interval will truncate the observed duration of more prolonged episodes. Some of the differences between the duration of episodes reported by NPHS subjects and the mean durations estimated indirectly using incidence and prevalence data may simply reflect the concept of 12-month period prevalence, as measured in the NPHS. A person with the new onset of a protracted episode in the few weeks preceding the NPHS interview would have their duration of depression recorded only as the interval between onset and interview. This would also occur for a protracted episode that resolved a few weeks into the year preceding the NPHS interview. Finally, whereas some episodes of this condition can last for years, the maximum value that could be recorded using the questions employed in the NPHS was 52 weeks. Hence, the distribution of episode durations might have been substantially truncated. Elements of consistency between these results and published findings have been summarized in the preceding paragraphs. It should be emphasized that the validity of a result is not confirmed by its consistency with other findings. Nevertheless, the development of dynamic descriptions of major depression epidemiology will need to be guided by principles of consistency with the existing literature of epidemiological studies. The NPHS data appear to suggest that a substantial proportion of persons experiencing the major depressive syndrome will have a relatively brief disturbance. In itself, this has important public health implications. For example, a large number of false positives are likely to emerge from screening efforts if instruments like the CIDI short form are used to detect people in need of clinical intervention. However, these results serve to emphasize that the duration data from the NPHS interview do not necessarily reflect the average experience of persons with major depression. This appears to be a heterogenous condition, characterized both by brief and protracted episodes.References 1. Blazer DG, Kessler RC, McGonagle KA, Swartz MS. The prevalence and distribution of major depression in a national community sample: the National Comorbidity Survey. Am J Psychiatry 1994;151:979-986. 2. Isometsa ET, Aro H. Depression in Finland: a computer assisted telephone interview study. Acta Psychiatr Scand 1997;96:122-128. 3. Ohayon MM, Priest RG, Guilleminault C, Caulet M. The prevalence of depressive disorders in the United Kingdom. Biol Psychiatry 1999;45:300-307. 4. Regier DA, Boyd JH, Burke JD, Myers JK, Kramer M, Robins LN et al. One-month prevalence of mental disorders in the United States. Based on five epidemiological catchment area sites. Arch Gen Psychiatry 1988;45:977-986. 5. Szadoczky E, Papp Zs, Vitrai J, Rihmer Z, Furedi J. The prevalence of major depressive and bipolar disorders in Hungary. Results from a national epidemiological survey. J Affect Disord 1998;50:153-162. 6. Weissman MM, Myers JK. Affective disorders in a US urban community. Arch Gen Psychiatry 1978; 35:1304-1311. 7. Weissman MM, Bland RC, Canino GJ, Faravelli C, Greenwald S, Hwu HG et al. Cross-national epidemiology of major depression and bipolar disorder. JAMA 1996;276(4):293-299. 8. Beaudet MP. Depression. Health Reports 1996;7(4):11-24. 9. Stephens T, Dulberg C, Joubert N. Mental health of the Canadian population: a comprehensive analysis. Chronic Dis Can 1999;20:118-126. 10. Offord DR, Boyle MH, Campbell D, Goering P, Lin E, Wong M et al. One year prevalence of psychiatric disorder in Ontarians 15 to 64 years of age. Can J Psychiatry 1996;4:559-563. 11. Bland RC, Newman SC, Orn H. Period prevalence of psychiatric disorders in Edmonton. Acta Psychiatr Scand 1988;Suppl 338:33-42. 12. De Marco RR. The epidemiology of major depression: implications of occurrence, recurrence, and stress in a Canadian community sample. Can J Psychiatry 2000;45:67-74. 13. Beaudet MP. Psychological health - depression. Health Reports 1999;11:63-75. 14. Kessler RC, Andrews G, Mroczek D, Ustun B, Wittchen HU. The World Health Organization Composite International Diagnostic Interview Short-Form (CIDI-SF). International Journal of Methods of Psychiatric Research 1998;7:181-195. 15. Jacobs DG. National depression screening day: educating the public, reaching those in need of treatment, and broadening professional understanding. Harvard Review of Psychiatry 1995;3:156-159. 16. SAS/STAT User's Guide. Cary, NC: The SAS Institute, 1994. 17. Rothman KJ, Greenland S. Measures of disease frequency. In: Rothman KJ, Greenland S, editors. Modern epidemiology. Philadelphia: Lippincott-Raven, 1998:29-64. 18. Kessler RC, Walters EE. Epidemiology of DSM-III-R major depression and minor depression among adolescents and young adults in the National Comorbidity Survey. Depression and Anxiety 1998;7:3-14. 19. Kessler RC, McGonagle KA, Zhao S, Nelson CB, Hughes M, Eshleman S et al. Lifetime and 12-month prevalence of DSM-III-R psychiatric disorders in the United States. Results from the National Comorbidity Survey. Arch Gen Psychiatry 1994;51:8-19. 20. Regier DA, Kaelber CT, Rae DS, Farmer ME, Knauper B, Kessler RC et al. Limitations of diagnostic criteria and assessment instruments for mental disorders. Arch Gen Psychiatry 1998;55:109-115. 21. Von Korff M, Parker RD. The dynamics of the prevalence of chronic episodic disease. J Chron Dis 1980; 33:79-85. 22. Oldehinkel AJ, Wittchen H-U, Schuster P. Prevalence,
23. Lewinsohn PM, Hops H, Roberts RE, Seeley JR, Andrews JA. Adolescent psychopathology: I. Prevalence and incidence of depression and other DSM-III-R disorders in high school students. J Abn Psychol 1993; 102:133-144. 24. Forsell Y, Winblad B. Incidence of major depression in a very elderly population. Int J Geriatr Psychiatry 1999; 14:368-272. 25. Bruce ML, Takeuchi DT, Leaf PJ. Poverty and psychiatric status. Longitudinal evidence from the New Haven Epidemiological Catchment Area Study. Arch Gen Psychiatry 1991;48:470-474. 26. Newman SC, Bland RC. Incidence of mental disorders in Edmonton: estimates of rates and methodological issues. J Psychiatr Res 1998;332:273-282. 27. Rao U, Hammen C, Daley SE. Continuity of depression during the transition to adulthood: a five-year longitudinal study of young women. J Am Acad Child Adolesc Psychiatry 1999;38:908-915. 28. Eaton WW, Anthony JC, Gallo J, Cai G, Tien A, Romanoski A et al. Natural history of diagnostic interview schedule/DSM-IV major depression. The Baltimore epidemiological catchment area follow-up. Arch Gen Psychiatry 1997;54:993-999. 29. Kendler KS, Walters EE, Kessler RC. The prediction of length of major depressive episodes: results from an epidemiological sample of female twins. Psychol Med 1997;27:107-117. 30. Sargeant JK, Bruce ML, Florio LP, Weissman MM. Factors associated with 1-year outcome of major depression in the community. Arch Gen Psychiatry 1990;47:519-526.
Author References Scott B Patten, Population Health Investigator, The Alberta Heritage
Foundation for Medical Research; and Associate Professor, Department of
Community Health Sciences; and Department of Psychiatry, University of
Calgary, 3330 Hospital Drive NW, Calgary, Alberta T2N 4N1; |
||||||||||||||||||||||||||||||||||||||||||||||||||||||||||||||||||||||||||||||||||||||||||||||||||||||||||||||||||||||||||||||||||||||||||||||||||||||||||||||||||||||||||||||||||||||||||||||||||||||||||||||||||
| Last Updated: 2002-10-02 | |||