| |
|||||||||||||||||
|
|
A method for comparing and combining cost-of-illness studies: an example from cardiovascular disease
Bernard C K Choi and Anita W P Pak Abstract This paper describes a method for comparing and combining the results of various cost-of-illness (COI) studies. The method consists of seven steps: identify the study design; stratify according to the cost components; create concatenated cost components; adjust for inflation; adjust for population growth; compare cost estimates; and combine cost estimates. Based on this method, and using published data from 1986, 1993 and 1994, the cost of cardiovascular disease was estimated to be $20.1 billion in Canada in 2000, or $653 per person per year. One cost component, premature mortality, was found to have significantly decreased over time. The method described in this paper is sophisticated yet simple to use, and provides an efficient way to update, compare and combine cost estimates. By analyzing changes in cost components over time, it contributes to the projection methodology of cost information from multiple COI studies. It also greatly facilitates economic impact analyses to provide up-to-date information for healthy public policies. Key words: cardiovascular disease; cost-of-illness; economic analysis; statistical method
Introduction A cost-of-illness (COI) study estimates two types of costs of an illness: the direct costs (medical and non-medical) associated with the illness, and the indirect costs associated with lost productivity due to morbidity or premature mortality.1 In studying and estimating the economic impact of illnesses, questions often arise as to how to compare, and even combine, the estimates from various COI studies for the same time period and same geographic region and even over time and across geographic regions. For example, three studies reported that the total cost of cardiovascular disease in Canada was $16,846 million in 1986,2 $19,721 million in 1993,3 and $17,961 million in 1994.4 Given the differences in the cost items considered, calendar time and total population in Canada in the various studies, how can these cost figures be compared on an equal basis to look for possible time trends? Furthermore, based on published data, how can these cost figures for various study years be combined to obtain the best estimate for a particular target year? Can the only available data for 1986, 1993 and 1994 be combined to provide the best estimate for 2000? This paper describes a method for comparing and combining the results of various COI studies, illustrated step-by-step with the above example from cardiovascular disease. The method The proposed method comprises seven steps (Table 1): TABLE 1
Step 1: Identify the study design The first step is to identify the study design of the cost-of-illness study. It is inadvisable to compare or combine cost estimates from COI studies that have used different study designs, because different designs are based on different philosophies and approaches. The checklist in Table 2 helps to identify the study design. There are four major characteristics that determine the design of a COI study: the estimation method, the adjusting factors, the time frame, and the point of view.3,5-7 1. Estimation method Two major estimation methods are used in COI studies: the human capital approach and the willingness-to-pay approach. These two methods generate results that are not comparable to each other, with willingness-to-pay estimates being normally higher than human capital estimates.3 The human capital (HC) approach, developed by Rice and colleagues,8-12 estimates indirect costs associated with illness and premature death in terms of productivity losses (forgone income). This approach applies current average earnings by age and sex to lost market time and imputes the market value of time withdrawn. For example, the number of days lost from work (or unpaid work) is multiplied by the age- and sex-specific salary per day. The HC approach values earnings and housekeeping services, but excludes the costs associated with pain and suffering, leisure time, and volunteer work, the productivity of which is not reflected in earnings. The willingness-to-pay (WTP) approach considers the amount people are willing to pay to decrease their risk of injury, disease or death.13,14 It is a method of evaluating costs by asking people (patients, families, experts) what they would be willing to pay to avoid a certain undesirable state. This approach is subjective and may be difficult to use when assessing the WTP in the elderly and children, due to the complexity of the questions asked.
2. Adjusting factors Several adjusting factors are used in cost estimation: the discount rate for future income, inflation rates for past costs, and weights for partial income loss from disability. 2a. Discount rate for future income Future income losses are discounted to account for the fact that future income of $1 will be worth less than present income of $1, because the latter can be invested and increase in value over time.7 The discount rate is not related to inflation, because even when there is zero inflation, a dollar received today will be worth more than a dollar received in the future. Normally, a discount rate, or assumed rate of annual return on investments, of 5%15 is used, but it can range from 2% to 10%.4 Using a discount rate of 5%, for example, $105 received in the second year would be discounted to a present value of $100 in the first year. Different discount rates will lead to different cost estimates. The present value (PV) of a future value (FV) after t years, given an annual discount rate of r, is15 PV = FV [1/(1+r)t]. 2b. Inflation rates for costs from past years Cost data from past years could be inflated to the same base year value, using a consumer price index (CPI).6,16,17 The base year value (BYV) of a past year value (PYV) is calculated from the base year CPI (BCPI) and the past year CPI (PCPI)15 BYV = PYV [BCPI/PCPI]. 2c. Weights for disability For calculating the cost of disability, weights are used to adjust the daily income, since a day of disability does not necessarily mean that all activities are relinquished for that day. For each day of disability, only part of the daily income is lost due to a lower level of productivity. For example, the following weights for varying degrees of severity of disability are suggested by Wilkins and Adams:18 Cannot do major activity (work, housework, school), 0.5; Restricted in major activity, 0.4; Restricted in minor activity, 0.3. 3. Time frame Different studies may consider different time frames for cost estimation: the annual time frame (prevalence-based) or the lifetime time frame (incidence-based). Because of the simpler data requirement, prevalence-based models have been more widely used than incidence-based ones.5 The prevalence-based model quantifies economic costs by measuring all costs due to illness occurring within a given time period, usually a single year, regardless of the time of disease onset.3,5,8,9 The prevalence approach is good for measuring the effectiveness of cost control and how well health care expenditure targets are met.3,19 The incidence-based model quantifies the total lifetime costs of new cases of an illness with onset in the base year.3,5,8 Since it estimates the costs of new cases of illness in the base year from the beginning to the end of the illness (cure or death), this model is computationally labour intensive. The incidence approach is good for predicting the future effects of changes in current illness patterns.5 4. Point of view Different points of view (perspectives) can also lead to different cost estimates. Although there are several possible perspectives, it has been recommended that all cost-effectiveness, cost-benefit, and cost-utility studies should take the society's perspective.7 The society's perspective considers costs to all sectors of society. It has several characteristics. First, costs incurred by all sectors of society are included: individuals, employers, governments, the health care system, private health insurers, or shared arrangements between any of these sectors.4,5 Second, since the costs reflect what members of society give up, they also include the loss of forgone productivity (i.e., earnings) due to illness and injury7 or premature death.5 Similarly, they include a value associated with the forfeiture of an individual's healthy time.7 Third, the costs do not include transfer payments between parties within the society, such as social welfare payments, because these transfer payments only shift the burden from the individual to society and do not change the society's total resources.3,5 Fourth, costs of administering transfer payments attributable to illness are included, because these administrative costs would not have been consumed in the absence of illness.5 The government's perspective considers costs to the government only, such as costs to the health care and justice systems.5 It has several characteristics. First, it considers costs to all sectors of the government, such as the federal, provincial and territorial (or state), and local governments.7 Second, transfers of funds from society to the individual, such as social welfare payments, pension, and workers' compensation, are included as costs.3 Third, lost productivity due to illness, injury, and premature death are not considered costs to the government.3 There are other perspectives. The health care providers' perspective considers costs imposed on various types of hospitals, health maintenance organizations, and other health care providers.7 The business perspective considers the impact of illnesses on health-related employee benefits.7 The individual's perspective considers the out-of-pocket costs of illness.7 From the individual's perspective, costs can be internal (costs borne by the individuals and possibly by their families, who are also affected by an illness) or external (costs borne by those who are not affected by the illness).5 After using the checklist in Table 2 to determine that the various cost estimates have been derived from studies of the same or similar design, one can then proceed to Step 2. TABLE 2
Step 2: Stratify according to the cost components Step 2 stratifies and examines cost estimates in the various cost-of-illness studies according to their cost components to find out what kinds of costs are included. Even though the studies may be of the same design, different cost components included in the studies will make the comparison invalid. Basically, there are three main categories of costs: direct, indirect and intangible.3,5,6 Each category can be further subdivided into its cost components. Detailed lists of examples of direct, indirect and intangible costs have been provided elsewhere.5,13 Direct costs are the resources expended for prevention activities or health care.1 These include hospitals and other health care institutions, physicians and other health care professionals, drugs and appliances, health science research, administration, and other related health care expenditures.3,4,20 Direct costs may include labour, such as that of health professionals and support staff, as well as capital, such as equipment, buildings, supplies, utilities and land.4 Indirect costs are the resources forgone as the result of a health condition.1 They are related to lost productivity due to disability and premature mortality, causing absence from work or non-market activities.4,6 Non-market activities such as housekeeping are sometimes omitted from analyses, or sometimes evaluated as a certain percent of the value of market activity.6 Intangible costs are costs of pain, suffering, anxiety, grief and loss of leisure time, for which a monetary value is assigned.5,6,13 Intangible costs are normally estimated by the willingness-to-pay (WTP) approach. Step 3: Create concatenated cost components Once the cost components are identified, the next step is to create a uniform, mutually exclusive list of concatenated cost components for the various cost-of-illness studies, and recalculate or discard cost values if necessary. This is based on a detailed analysis of the list of cost components by cost categories (direct, indirect, and intangible) carried out for the various COI studies in Step 2. The costs that are included or excluded in each cost component in each COI study must be specified. A uniform, mutually exclusive list of cost components can be created for the various COI studies by concatenation, i.e., linking together similar cost components in different COI studies. As this is a key component in preparing the data for the comparison process, care must be used to ensure that this step is as objective as possible. Step 4: Adjust for inflation If the costs being compared are not from the same year, or if several cost estimates from the same study year are used to provide a cost estimate for a different target year, there is a need to inflate or deflate cost estimates from various years to a constant year level to make them comparable. For example, when various COI studies were done for different years, the cost estimates needed to be inflated or deflated, using CPI, to a constant year level to adjust for inflation. When the costs being compared are for the same year, there is no need to inflate. However, if several studies for the same year are used to provide the best estimate for another year of interest, cost estimates must be inflated or deflated to that year. (This article does not deal with COI studies that are conducted in different countries with different currencies, in which case the questions of differential inflationary processes and money exchange fluctuations must be addressed.) Step 5: Adjust for population growth Besides inflation, another factor that affects valid comparison of cost estimates is population growth over the years. The per capita cost for each cost component, and the per capita cost for all cost components for the various COI studies can be estimated by applying the total populations in those study years. Step 6: Compare cost estimates At this step, once the per capita and total costs of illness at the constant year level are calculated, the cost figures are directly comparable because they have been adjusted for inflation and population growth over the years. Graphical or other methods, such as regression, can be used to compare and determine whether the inflation-adjusted and population-adjusted cost estimates from various studies are reasonably homogenous and consistent. Step 7: Combine cost estimates When it is considered that the constant-dollar per capita cost estimates for some cost components are reasonably homogenous and consistent over the years, the cost estimates from several COI studies can be combined by taking the average to provide the best estimate of the per capita costs for those cost components for a target year. However, when a time trend is detected over the years for the constant-dollar per capita cost estimates for some other cost components, regression methods should be used to estimate the per capita costs for those other cost components for a target year. The total costs for each cost component for the target yea An example from cardiovascular disease In a literature review, three cost-of-illness studies were identified for cardiovascular disease in Canada: for the years 1986,2 1993,3 and 1994.4 It was desirable to compare the cost estimates to see if there is any time trend and to combine the cost estimates from the various studies to obtain the best estimate of the cost of cardiovascular disease in Canada for the most recent year for which data are available. Step 1: Identify the Study Design Table 2 was used to help identify the study designs of the three COI studies for cardiovascular disease in Canada. All three studies used the human capital approach, discount rate of 6%, inflation based on CPI, prevalence model, and the society's viewpoint. Although the weights for disability were somewhat different (Table 3), the three studies were considered to be generally similar in their design. TABLE 3
Step 2: Stratify according to the cost components Cost components considered in the three COI studies were first listed in a tabular form (Table 4), and their definitions examined in detail (Appendix). It was found that some of the cost components, although given a different name in each study, in fact referred to the same cost. For example, in the three studies, "medical care", "physicians", and "medical services" referred to the same cost component, i.e., physician and related medical services. In two studies, "chronic disability" and "long-term disability" were found to mean the same thing. One study included cost components that were not considered by the other two studies: "other institutions", "other professionals", and "other direct costs". However, this study provided only one overall disability cost component, and failed to differentiate between short-term and long-term disability. Through stratification, some inconsistencies in cost components were identified. TABLE 4
Step 3: Create concatenated cost components A new, uniform, mutually exclusive list of cost components was created by concatenation (Table 5). Non-mutually exclusive cost components from the three studies were classified together by creating a uniform cost component called "physicians" to represent "medical care", "physicians", and "medical services" from the three studies. Cost components that should not be included in a COI study with the society's viewpoint, such as pensions and benefits, were discarded, because the society's viewpoint does not consider transfer payments between sectors within the society as real costs. Some cost values were recalculated from the published data to ensure that they were comparable to the cost values in the other studies for the same cost component. For example, the baseline estimates for disability and premature mortality reported in one study4 were based on the average of estimates from the Disability Survey Method and the Disability Insurance Payment Method. Since the Disability Survey Method was used in the other two studies,2,3 the cost values were recalculated for this study to make them comparable to the other two (Table 5). In cases where recalculation was not possible, some cost values had to be discarded from the comparison. Disability costs, for example, were not separated into short-term disability and long-term disability in one study4 and therefore could not be used for comparison with the values from the other two studies.2,3 TABLE 5
Step 4: Adjust for inflation Because the three COI studies reported cost estimates for Canada for different years, namely 1986, 1993, and 1994, the figures were inflated by applying an inflator based on CPI for the various years to the 2000 Canadian constant dollar level (Table 6). For example, $3,539 million (Table 5, column 1) H 1.4733 (Table 6, inflator in footnote) = $5,214 million (Table 6, column 1). TABLE 6
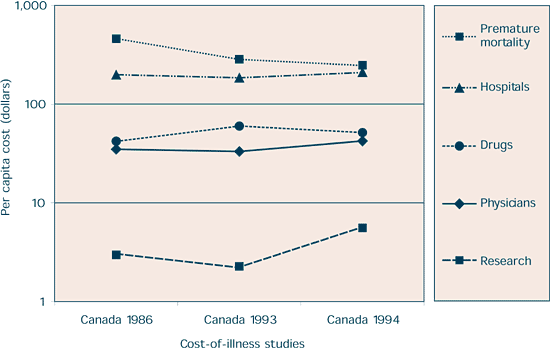
Step 5: Adjust for population growth The per capita cost for each cost component, and the per capita cost for all cost components, for Canada for 1986, 1993 and 1994, were calculated based on the total Canadian population in those years (Table 7, columns 1-3). For example, $5,214 million (Table 6, column 1) / 26.2 million (Table 7, population size in footnote) = $199.01/person (Table 7, column 1). Step 6: Compare cost estimates These figures (Table 7, columns 1-3) are now directly comparable because they are based on the 2000 constant dollar level and have been adjusted for population growth over the years. The per capita costs are fairly constant, in terms of 2000 Canadian constant dollars, for Canada for 1986, 1993 and 1994 (Figure 1). (In Figure 1, a logarithmic scale for per capita cost is preferred to a linear scale to show percentage change rather than absolute change.) The total direct costs also remain fairly constant with time. The only exception is perhaps premature mortality, the per capita cost estimate of which is higher in 1986 than in 1993 or 1994, in 2000 constant dollars. This results in a decrease of the total indirect costs, and therefore the total costs, over time. Linear regression (SPSS "Linear Regression" procedure)24 was used to confirm whether the apparent cost of premature mortality for the three studies has fallen from 1986 to 1993 to 1994. Results of the regression analysis indicated that costs of hospitals, physicians, drugs and research were homogenous and consistent over the study years, but that the cost of premature mortality dropped significantly over time (p=0.033) (Table 8). Step 7: Combine cost estimates For those per capita cost estimates that were considered reasonably homogenous and consistent over the years, estimates were averaged for 1986, 1993 and 1994 to provide the best estimate of the per capita costs for 2000 (Table 7, column 4). For example, for direct costs for hospitals, ($199.01+$185.92+$211.51)/3=$198.81. For premature mortality, the per capita cost for 2000 was estimated by projection based on regression results. For example, from Table 8, $52,037.024+2000(-$25.97 /year)=$97.02 (Table 7, column 4). By adding up the cost estimates for direct and indirect costs, the cost of CVD for Canada in 2000 was estimated to be $653.02 per person (Table 7, column 4). The total per capita cost of $653.02 was not obtained by averaging the three study total costs of $933.40, $754.05 and $718.77 (which would have given $802.07), or by regression analysis of those three total costs (which would have given $564.51), but by adding up the cost values in column 4. In this way the cost estimate is more complete because two studies2,3 did not provide cost estimates for cost components such as other institutions, other professionals, and other costs, as did one study.4 In the calculations, a decision was made to use the short-term disability and long-term disability estimates from two studies2,3 and to discard the disability estimate from one study.4 Besides being more complete, the cost estimate is more accurate as regression showed a significant time trend in only one cost component and not in the others. The total costs for each cost component for 2000 (Table 7, column 5) were calculated by applying the total Canadian population in 2000. For example, for direct costs for hospitals, $198.81/person (Table 7, column 4) H 30.8 million (Table 7, population size in footnote) = $6,123 million (Table 7, column 5). The total cost of CVD for Canada in 2000 was estimated to be $20,113 million, in 2000 dollars (Table 7, column 5). |
|||||||||||||||||||||||||||||||||||||||||||||||||||||||||||||||||||||||||||||||||||||||||||||||||||||||||||||||||||||||||||||||||||||||||||||||||||||||||||||||||||||||||||||||||||||||||||||||||||||||||||||||||||||||||||||||||||||||||||||||||||||||||||||||||||||||||||||||||||||||||||||||||||||||||||||||||||||||||||||||||||||||||||||||||||||||||||||||||||||||||||||||||||||||||||||||||||||||||||||||||||||||||||||||||||||
|
TABLE 7
FIGURE 1
TABLE 8
|
||||||||||||||||||||||||||||||||||||||||||||||||||||||||||||||||||||||||||||||||||||||||||||||||||||||||||||||||||||||||||||||||||||||||||||||||||||||||||||||||||||||||||||||||||||||||||||||||||||||||||||||||||||||||||||||||||||||||||||||||||||||||||||||||||||||||||||||||||||||||||||||||||||||||||||||||||||||||||||||||||||||||||||||||||||||||||||||||||||||||||||||||||||||||||||||||||||||||||||||||||||||||||||||||||||||
|
Discussion Cost-of-illness (COI) studies are frequently conducted to estimate direct costs associated with an illness, and indirect costs associated with lost productivity due to morbidity or premature mortality. Economic costs of illnesses are important information for public health decisions. However, available economic cost estimates quickly become out of date, and updating economic costs often calls for a new study which is tedious and time-consuming. In addition, the newly conducted study may suffer from limitations such as the unavailability of data for certain cost components for the target year of interest. Estimation of COI based on multiple published studies proves to be more efficient and more stable than conducting a new study. This paper describes a method for comparing and combining various COI studies conducted in a single year or multiple years, within the same or different geographical locations using the same currency. The method can also be used to provide the best cost estimate for a target year, based on cost estimates from previously published studies. The proposed method is sophisticated yet simple to use. The input requirements to the method are minimal, including only the cost estimates from previously published COI studies, the consumer price indices for the period from the various study years to the target year, and the population sizes in the study years and in the target year. By applying this method, investigators are able to calculate the best estimate of costs of illness based on currently existing, available data. The use of this method is demonstrated in this paper with an example from cardiovascular disease. In this example, three COI studies, which were conducted in Canada in three different years, 1986, 1993 and 1994, were compared and combined to produce the best estimate for the per capita cost of cardiovascular disease for Canada, 2000. A major concern in the combination of COI estimates derived across studies and in particular across time into single cost estimates at some future time is the possibility of changes in the component costs over time. This concern is directly addressed in the proposed method by using regression analysis to model the changes in the cost components. The method therefore contributes to a sophisticated projection of cost information from multiple COI studies. The proposed method is limited to geographical regions that use the same currency, such as Canada. It does not deal with COI studies that are conducted in different geographical regions (or countries) with different currencies. In the future, the method needs to be adapted to address the questions of differential inflationary processes and money exchange fluctuations. Acknowledgements The authors would like to acknowledge Richard Lemay and Rachel Moore's thoughtful comments and suggestions. References
|
||||||||||||||||||||||||||||||||||||||||||||||||||||||||||||||||||||||||||||||||||||||||||||||||||||||||||||||||||||||||||||||||||||||||||||||||||||||||||||||||||||||||||||||||||||||||||||||||||||||||||||||||||||||||||||||||||||||||||||||||||||||||||||||||||||||||||||||||||||||||||||||||||||||||||||||||||||||||||||||||||||||||||||||||||||||||||||||||||||||||||||||||||||||||||||||||||||||||||||||||||||||||||||||||||||||
|
APPENDIX
|
||||||||||||||||||||||||||||||||||||||||||||||||||||||||||||||||||||||||||||||||||||||||||||||||||||||||||||||||||||||||||||||||||||||||||||||||||||||||||||||||||||||||||||||||||||||||||||||||||||||||||||||||||||||||||||||||||||||||||||||||||||||||||||||||||||||||||||||||||||||||||||||||||||||||||||||||||||||||||||||||||||||||||||||||||||||||||||||||||||||||||||||||||||||||||||||||||||||||||||||||||||||||||||||||||||||
|
Author References Bernard C K Choi, Surveillance and Risk Assessment Division, Centre for Chronic Disease Prevention and Control, Public Health Agency of Canada, Health Canada, and Department of Public Health Sciences, Faculty of Medicine, University of Toronto and Department of Epidemiology and Community Medicine, Faculty of Medicine, University of Ottawa Anita W P Pak, Traffic Injury Research Foundation, Ottawa, Ontario Correspondence: Bernard C K Choi, Surveillance and Risk Assessment Division, Centre for Chronic Disease Prevention and Control, Public Health Agency of Canada, Health Canada, PL#1918C3, Tunney's Pasture, Ottawa, Ontario, Canada K1A 0K9; Fax: (613) 954-8286; E-mail: Bernard_Choi@hc-sc.gc.ca
[Previous] [Table of Contents] [Next] |
||||||||||||||||||||||||||||||||||||||||||||||||||||||||||||||||||||||||||||||||||||||||||||||||||||||||||||||||||||||||||||||||||||||||||||||||||||||||||||||||||||||||||||||||||||||||||||||||||||||||||||||||||||||||||||||||||||||||||||||||||||||||||||||||||||||||||||||||||||||||||||||||||||||||||||||||||||||||||||||||||||||||||||||||||||||||||||||||||||||||||||||||||||||||||||||||||||||||||||||||||||||||||||||||||||||
| Last Updated: 2002-06-20 | |||