| |
|||||||||||||||||
|
|
Regional comparisons of inpatient and outpatient patterns of cerebrovascular disease diagnosis in the province of Alberta Abstract The diagnosis of cerebrovascular disease (CBVD) from administrative data has been critically examined by epidemiologists in recent years. Much of the existing literature suggests that hospital discharge diagnoses based on ICD-9-CM codes are an unreliable source of information for determining a diagnosis of stroke, particularly when four- and five-digit codes are used. We examined how diagnoses for CBVD in hospital inpatient and outpatient facilities vary between rural and urban areas and among the 16 administrative health regions. Our analysis revealed differences in diagnostic patterns between the two sources of data, differences between rural and urban areas, and variation across most of the regions. Geographic variation in health service utilization, diagnostic practices, specialty of the physician making the diagnosis, and disease burden may explain our findings. Our results suggest that the diagnosis of patients attending rural facilities are either coded differently (and less precisely) than those of urban residents or are coded more precisely only after the patients attend urban facilities. Regional differences in coding practices show that any CBVD surveillance system based on administrative data requires a large-scale (in this case, province-wide) and person-oriented approach. Key words:, administrative data; cerebrovascular disease; epidemiology; stroke Introduction Cerebrovascular disease (CBVD) is the third leading cause of death in Canada, behind only heart disease and cancer.1 Although its incidence has been declining in recent years, an ageing population means that the absolute number of cases and cost of treatment are likely to rise.2 Surveillance is an important component of any strategy to address the future health impacts of CBVD and, more specifically, stroke.3,4 A central characteristic of surveillance is the ongoing, systematic collection, analysis and dissemination of population-based data and information.5,6 Rather than focusing on a group at particular risk, public health surveillance monitors the health of the population as a whole. Effective surveillance systems must balance accuracy and completeness while remaining both representative and comprehensive enough to make meaningful statements about disease at large.7 In Canada, an increasingly available source of surveillance information includes administrative health care databases of inpatient, outpatient and physician billing data. Administrative data can be a cost-effective, timely and generalizable resource for the surveillance of CBVD and other health outcomes.8 In most administrative data systems, case definitions are based on ICD-9-CM (International Classification of Diseases, 9th Revision, Clinical Modification) coding schemes.9 However, there is considerable variability in the methods and accuracy of stroke diagnosis when ICD-9-CM codes are used.10 Hospital discharge data may overestimate stroke incidence.11,12 Validation studies using medical records also report that ischemic cerebrovascular disease is not coded reliably in administrative data.13,14 In addition to identifying the overall incidence and/or prevalence of a disease in a given jurisdiction, surveillance systems are also concerned with regional (geographic) variation. Geographic differences in stroke incidence and mortality have been noted in a number of studies.15,16 However, given the uncertainty about the quality of stroke diagnoses in administrative data and evidence that diagnostic coding differs regionally,17 it is unclear whether these variations are confounded by misclassification, leading to geographic variations in diagnostic patterns independent of true epidemiologic differences. Regional variation in medical coding practices combined with the need for specific case definitions that separate CBVD into logical subsets of illness (e.g., acute stroke, transient ischemic attack, late effects of stroke) present a seemingly intractable problem for CBVD surveillance that uses administrative data. On the one hand, case definitions must be detailed enough to be useful for epidemiologic and surveillance purposes. On the other hand, there may be regional variation in the accuracy of coding in general, and as diagnoses become more specific, variations in coding accuracy may increasingly confuse the results. More research is required that investigates how the coding varies regionally and to what degree facilities differ in their methods of coding disease. It is possible that the use of multiple administrative data sources may provide more accurate and robust estimates of disease impacts. Despite the important literature on the quality of Canadian hospital discharge data,18,19 little work has been done to evaluate CBVD diagnoses from ambulatory or physician claims data. Outpatient data may improve estimates of incidence and/or prevalence since they represent a different part of the health service system, with potentially different information collection practices. For example, people who die in or are discharged from emergency departments will not appear in hospital inpatient data but will appear in the outpatient system. The goal of this study was to describe and evaluate regional differences in CBVD diagnostic coding subgroups in hospital inpatient and outpatient data. In addition to describing the distribution of CBVD ICD-9 coding collected from inpatient and outpatient administrative data sources, we make geographic comparisons between the pattern of coding in inpatient and outpatient data. This research is important in helping to establish a preliminary framework for the use of large-scale administrative data in the geographic surveillance of cerebrovascular disease. By outlining the limitations of administrative data, we improve our ability to employ it effectively. Our findings will also help characterize the interaction between facility location, CBVD and diagnostic coding variability, and will indicate the degree to which administrative data can capture the underlying characteristics of illness across Alberta. Methods All residents of Alberta are eligible for coverage under a publicly funded health care system. Very few residents opt out of the system, and therefore the registry captures the vast majority of the population of Alberta (roughly three million people). Each resident covered by the plan has a personal health number, which can be used as a link to a variety of data sources. Non-residents who receive services in Alberta are not tracked through the registry system but are still recorded in the health data systems. We used two administrative data systems to collect case information. Inpatient data were acquired from a nationally standardized collection of hospital morbidity data, from the Canadian Institute for Health Information (CIHI). Our other source, the Ambulatory Care Classification System (ACCS), includes data from hospital outpatient facilities. Most of these data are from emergency departments, the remainder coming from day surgeries, outpatient treatment programs/clinics and other facilities that do not involve overnight stay. Alberta has collected and maintained ACCS data since 1997/1998 and currently remains one of the few jurisdictions in North America to maintain a comprehensive digital record of outpatient services. In most cases, inpatient and outpatient records are coded by the same staff of medical records coders. Data were acquired for the 1999/2000 fiscal year and were evaluated across 16 health regions as well as rural and urban areas in the province of Alberta (Figure 1). Over the study period, 69 rural and 44 urban facilities contributed records to the ACCS and/or CIHI data systems. Although Alberta is divided into 17 health regions, the Northwestern Health Authority did not have complete outpatient data and was therefore excluded from this study. For CIHI data there are up to 16 diagnostic fields; for ACCS data there are up to six diagnostic fields. Our analysis covered all records coded as cerebrovascular disease (430.x to 438.x) in any diagnostic field within inpatient and outpatient facilities. Therefore our data were transaction based, not person based. A transaction-based analysis was required in order to observe the pattern of diagnostic coding made in different health regions. Person-based analysis would approximate disease frequencies, which would obscure the variation in coding practices across regions. Since our goal is not to assess the disease frequency across regions but to identify how coding varies among regions and between inpatient and outpatient data systems, a transaction-based approach was necessary. For analysis, records were characterized by two different geographic levels: health region and rural/urban. Rural/urban was defined according to the six-digit postal code of the facility in which the service took place: a service facility was classified as “rural” if the second digit of its postal code was a “0” and classified as urban in all other cases. This definition is used by Statistics Canada.20 The matrix of CBVD subgroup diagnostic codes by region was examined using multivariate ordination techniques.21,22 Specifically, the matrix was represented as a biplot in the space of the first two principal components. Groupings were formed by examining the proximity of points representing regions. |
|||||||||||||||||||||||||||||||||||||||||||||
|
FIGURE 1 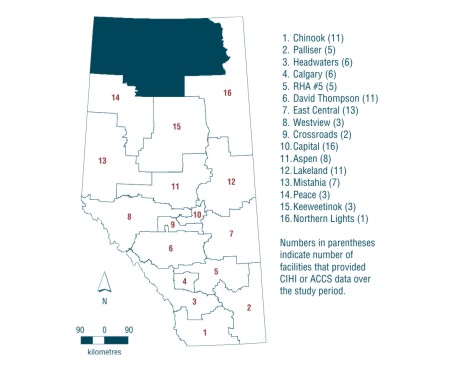
|
||||||||||||||||||||||||||||||||||||||||||||||
|
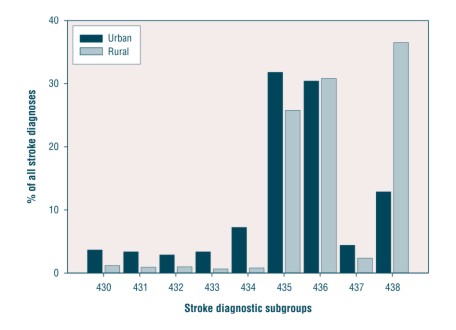
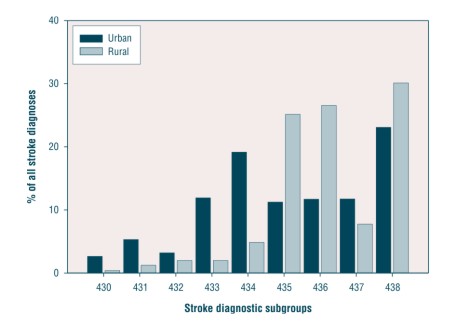
Results Diagnoses in inpatient and outpatient facilities When reclassified into the three-digit ICD-9-CM subgroups, CBVD diagnostic codes in inpatient centres differ noticeably from codes in outpatient centres (Table 1). This is not surprising, since inpatient and outpatient facilities serve the public differently. The difference is most noticeable in the 435.x to 438.x diagnostic groups. The greatest difference is in subgroup 436, which makes up nearly 25% of all outpatient codes for CBVD but roughly 14% of inpatient services. Using a specialty code available in physician billing data, we were able to estimate that only 9% of emergency department diagnoses (which make up the majority of outpatient records) of CBVD were made by neurologists. Because of a lack of data availability, similar conclusions could not be made about inpatient data, although it is likely that neurologists determine a larger proportion of diagnoses for admitted hospital patients. Rural versus urban The distribution of diagnostic codes differs between rural and urban facilities for both outpatient (Figure 2) and inpatient (Figure 3) service centres. In outpatient service facilities, the biggest single urban/rural difference is in the 438.x diagnostic group, which represents a much greater proportion of all stroke diagnoses in rural than in urban facilities. For most other diagnostic categories, urban facilities make up a larger proportion of diagnoses. For 435.x and 436, the frequency of coding is similar for urban and rural areas. Inpatient facilities show considerable urban/rural contrast for codes 435.x and 436, and less for 438.x. |
||||||||||||||||||||||||||||||||||||||||||||||
FIGURE 3 |
||||||||||||||||||||||||||||||||||||||||||||||
|
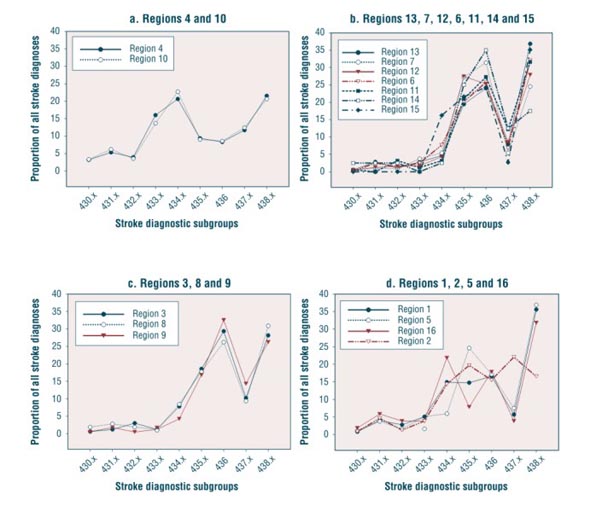
When broken down into the specific diagnostic codes available in administrative records, inpatient data continue to demonstrate a considerable urban/rural contrast. Rural areas code 436 (26.6%), and 435.9 (24.2%) (unspecified transient cerebral ischemia) considerably more often than urban areas (11.7% and 9.9% respectively). The frequencies of specific codes have a wider range among urban facilities than rural facilities: of the 58 types of diagnosis that were made in Alberta inpatient facilities, 39 were reported with greater frequency in urban areas. In the outpatient data, the two most common codes (436 and 435.9) are used with similar frequency in rural (21.0%, 16.9%) and urban (23.8%, 16.7%) areas. The biggest difference in the frequency of outpatient diagnoses between urban and rural areas is for 438.9 (unspecified late effects of cerebrovascular disease): 15.1% coded in rural areas and 3.8% coded in urban areas. However, as with inpatient facilities, diagnoses coded in urban facilities are distributed more widely across all diagnoses coded: of the 57 types of diagnoses that were made in Alberta outpatient facilities, 38 were reported with greater frequency in urban areas. Regional differences The matrices of CBVD subgroup diagnostic codes by region are shown as profiles in Figures 4a-e and 5a-d. With the exception of 4e (which is best understood as a residual grouping), the success of this strategy is visible in the graphs; regions with similar diagnostic profiles are generally grouped together. Regional differences in diagnostic codes within the CBVD subgroups are most noticeable in outpatient data (Figures 4a-4e). Three diagnostic subgroups make up a significant majority of all CBVD coding in most regions: 435.x, 436 and 438.x. In regions 6, 11 and 15, a majority of records are coded as 438.x (Figure 4a). In regions 13 and 14, 436 makes up the majority of diagnostic codes (Figure 4b). In regions 1, 4, 7 and 9 (Figure 4c), 435.x and 436 share a similar proportion of the overall CBVD coding, and regions 2, 3, 5, 8 and 12 see similar proportions of records coded between sub-groups 435.x, 436 and 438.x (Figure 4d). Regions 10 and 16 possess diagnostic patterns notably different from the other regions (Figure 4e). For region 10, 434.x is coded in over 30% of the cerebrovascular disease records, significantly more often than in the other regions. In region 16, 430.x is coded frequently, although the total number of diagnoses in this region is small. The remaining regions show similar patterns: 436 and 438.x are most commonly coded, and 430.x to 434.x are coded considerably less frequently. The regional variations in coding among inpatient data can be classified into two main groups (Figures 5a-5d). First, regions 10 and 4 exhibit very similar patterns of coding, characterized by a more uniform distribution and a smaller proportion of 436 diagnoses (Figure 5a). The most commonly coded subgroups in these two regions are 434.x and 438.x. In most of the remaining regions, the most common codes are 435.x, 436 and 438.x, although the relative proportions among these three diagnoses differ. Regions 1, 2, 5 and 16 do not conform to either of these patterns in particular, although 435.x, 436 and 438.x are commonly coded in these regions (Figure 5d). In this case, diagnostic codes are divided more evenly between the subgroups in general. Discussion There are quantifiable differences between regions and between rural and urban areas in the frequency of CBVD coding by the three-digit diagnostic subgroupings. Furthermore, these differences in coding profiles vary between the inpatient and outpatient data. The differences may be explained by genuine differences in the burden and/or epidemiology of CBVD, by regional differences in medical coding practices or differences in the methods of diagnosis, or they may reflect geographic differences in the organization of stroke care. The data may also indicate that inpatient and outpatient facilities are utilized differently across the province. Thus, our results merely provide a description of regional differences in coding and cannot be used to explain the causes of these differences. Our results do, however, reveal a number of issues that researchers should consider when using administrative data to analyze regional differences in CBVD frequency. Urban facilities code a wider range of diagnoses than rural facilities in the inpatient and outpatient data systems. Overall, urban/rural differences in patterns of diagnostic coding are greater among inpatient data. In the inpatient setting, rural facilities code over 25% of their CBVD records as 436, whereas urban areas code roughly 12% of their records as 436. For outpatient data, a very similar proportion of diagnoses are coded as 436 in rural and urban areas (~30%). Another frequently coded diagnosis, 435.9, also shows a similar and notable urban/rural contrast in inpatient facilities, though differing little in outpatient facilities. Indeed, the pattern of diagnostic codes 436 and 435.9 demonstrates a similarity between diagnostic patterns in rural inpatient records and outpatient records as a whole. There are two distinct regional patterns visible in the inpatient data, which re-illustrate the urban/rural contrasts already noted. Inpatient facilities in regions 10 and 4 (which include Edmonton and Calgary respectively) code the CBVD subgroups with virtually identical frequency, the largest proportions of diagnoses being coded as 433.x, 434.x and 438.x. The vast majority of specialists and neurologists are located in these two urban centres. If, as suggested earlier, neurologists determine a larger proportion of diagnoses within hospital inpatient data, then this pattern may reflect a greater degree of consistency and diagnostic certainty among neurologists. The similarities between Calgary and Edmonton may reflect similar disease frequency, coding standards, or a combination of both factors. |
||||||||||||||||||||||||||||||||||||||||||||||
|
Among outpatient data, the regional variations are noteworthy. The magnitude of variation within the patterns suggests that the three most common diagnostic codes in the majority of regions (435.x, 436 and 438.x) may represent similar classification phenomena to physicians and/or medical coders. Evidence for this conclusion is twofold. First, the magnitude of variation is unlikely to be represented by real differences of disease in the population. For example, in regions 6, 11 and 15, over 50% of the diagnoses for CBVD are coded as 438.x. In regions 1, 4, 7, 9, 10, 13 and 14, less than 10% of records have the same diagnosis. It seems implausible that such a large magnitude of variation would be due to true regional differences in epidemiology. Second, regions with similar demographic characteristics and similar numbers of neurologists nonetheless exhibit markedly different patterns of diagnosis. Regions 4 and 10 are urban areas that have similar populations in terms of demographic features and health. Nevertheless, they differ greatly in how frequently 434.x is coded. Over 30% of outpatient records for CBVD are coded as 434.x in region 10; in region 4, less than 12% of the records are similarly coded. This analysis was transaction based, and therefore the geographic component was defined by the facility a patient visited and not his or her place of residence. This was an important detail of our analysis since it allowed us to observe the trends in coding (separate from trends in disease frequency) and identify the degree to which coding differs regionally. However, any tendency for rural living people to specifically seek service at urban inpatient and/or outpatient facilities (i.e., seek treatment at facilities outside their region of residence) influences our findings. Rural records may frequently represent initial contacts that are followed up in urban facilities, where more precise codes will be used. This is an important question for future research - how often do rural residents receive more definitive and/or accurate diagnoses in non-local facilities? Estimates of disease frequency may also be complicated by multiple visits to different facilities; rural people may receive non-specific diagnoses in a rural facility before they are transferred to an urban facility, where a more specific diagnostic code is obtained. When determining the disease status of a given individual, one would need to decide which of the two codes is more appropriate. Nevertheless, our findings do suggest that obtaining information exclusively from medical records in rurally located facilities may not be sufficient for surveillance or research purposes. Regional differences in the availability of specialized diagnostic equipment and necessary expertise may hide real differences in epidemiology. This may be because rural living people tend to seek services in urban areas, or it may reflect distinctly different coding practices among rural facilities. Whatever the reason, facilities in rural health regions have widely different patterns of CBVD coding, in many cases in both the hospital inpatient and outpatient settings. This could have an effect on geographic estimates of CBVD frequency in general, even when case definitions are person based. Our findings also illustrate the importance of person-oriented data in health surveillance and research, particularly when regional comparisons are being made. Cross-sectional data may be a geographically and otherwise biased representation of CBVD in which rural residents receive a disproportionately large number of non-specific diagnostic codes. Our findings may indicate that rural residents receive a non-specific diagnosis in rural areas, and that more specific codes are received only after transfer to an urban facility. As such, even though a first encounter may have been in a rural facility, the diagnostic codes associated with an encounter at the urban facility may be better suited for defining the characteristics of the individual's illness. Tracking the complete diagnostic and service history of individuals may help to mitigate some of this bias. For cases in which people receive different diagnoses from different facilities over time, extended information can be collected and analyzed as a whole to obtain a more precise measure of illness. This could also offset the uncertainty associated with ICD-9 codes used in administrative data. Although location of residence may still influence people's utilization habits and ultimately the patterns of CBVD, person-oriented administrative data surveillance offers the best option for addressing these problems related to administrative data. Conclusions There is some evidence to suggest that hospital inpatient data collected from urban areas offers the most consistent CBVD diagnostic coding in Alberta's administrative health data system. This may be a result of the availability of diagnostic equipment and specialists, or the training and expertise of medical coders, or a combination of these and other factors. This does not eliminate the possibility of confounding or inaccuracy in the diagnostic coding, but it does suggest that the error is similar among large urban areas, and therefore comparisons based on inpatient data are probably meaningful. The inconsistency of diagnoses made in rural areas suggests that a) some geographic patterns obtained through the administrative data system in CBVD may still be confounded by variations in coding (despite the similarities of Edmonton and Calgary) and b) estimates of disease incidence will be increasingly obscured with the use of increasingly detailed ICD-9 diagnostic codes. Our results also suggest that either rural residents receive distinctly different (and in general, less specific) diagnostic codes than urban residents, or rural residents frequently attend urban facilities for diagnosis. If the former, then further research must be done to assess whether this differential coding is reflective of differential treatment. If the latter, then research must be undertaken to evaluate the effect that commuting to urban areas for diagnosis and treatment may have on the health of rural residents. In addition, validation work is necessary to confirm the existence of diagnostic bias from region to region and to characterize its type and direction. Geographic differences in the distribution of diagnoses may be explained by regionally specific coding practices, regional differences in disease burden, or a tendency for people in some regions to use local service centres selectively. Finally, further work is required that tracks utilization across the system as a whole and follows patients' utilization habits across geographic area, time and type of service. Acknowledgements Funding for this project was provided by Health Canada, Alberta Health and Wellness, and the Heart and Stroke Foundation of Canada. References 1. Statistics Canada, Health Statistics Division. Selected leading causes of death by sex. URL: http://www.statcan.ca/english/Pgdb/health36.htm. Extracted January 23rd, 2003. 2. Heart and Stroke Foundation of Canada. The changing face of heart disease and stroke in Canada. Ottawa: Heart and Stroke Foundation of Canada, 1999. 3. Wilson E, Taylor G, Phillips S, Stewart PJ, Dickinson G, Ramsden VR, et al. Creating a Canadian stroke system. Can Med Assoc J 2001;164:1853-55. 4. Johnson KC, Mao Y. National stroke surveillance program needed in Canada. Can Med Assoc J 2001;165:886-87. 5. Thacker SB , Berkelman RL. Public health surveillance in the United States. Epidemiol Rev 1988;10:164-90. 6. Thacker SB, Stroup DF. Future directions for comprehensive public health surveillance and health information systems in the United States. Am J Epidemiol 1994; 140:383-97. 7. Declich S, Carter AO. Public health surveillance: historical origins, methods and evaluation. Bull WHO 1994;72:285-304. 8. Mayo NE, Chockalingham A, Reeder BA, Phillips S. Surveillance for stroke in Canada. Health Rep 1994;6:62-72. 9. Puckett CD. The educational annotation of ICD-9-CM. Reno, Nevada: Channel Publishing 1998. 10. Reker DM, Hamilton BB, Duncan PW, Shu-Chuan JY, Rosen A. Stroke: Who's counting what? J Rehab Res Develop 2001;38: 281-89. 11. Ellekjaer H, Holmen J, Kruger O, Terent A. Identification of incident stroke in Norway: hospital discharge data compared with population-based stroke register. Stroke 1999;30:56-60. 12. Leppala JM, Virtamo J, Heinonen OP. Validation of stroke diagnosis in the National Hospital Discharge Register and the Register of Causes of Death in Finland. Eur J Epidemiol 1999;15:155-60. 13. Benesch C, Witter DM, Wilder AL, Duncan PW, Samsa GP, Matchar DB. Inaccuracy of the International Classification of Diseases (ICD-9-CM-CM) in identifying the diagnosis of ischemic cerebrovascular disease. Neurology 1997;49:660-64. 14. Leibson CL, Naessens JM, Brown RD, Whisnant JP. Accuracy of hospital discharge abstracts for identifying stroke. Stroke 1994;25:2348-55. 15. Lackland DT, Bachman DL, Carter TD, Barker DL, Timms S, Kohli H. The geographic variation in stroke incidence in two areas of the southeastern stroke belt: the Andersson and Pee Dee Stroke Study. Stroke 1998;29:2061-68. 16. Engstrom G, Jerntorp I, Pessah-Rasmussen H, Hedblad B, Berglund G, Janzon L. Geographic distribution of stroke incidence within an urban population. Stroke 2001; 32:1098-1103. 17. Liu L, Reeder B, Shuaib A, Mazagri R. Validity of stroke diagnosis on hospital discharge records in Saskatchewan, Canada: implications for stroke surveillance. Cerebrovasc Dis 1999;9:224-230. 18. Mayo NE, Danys I, Carlton J, Scott SC. Accuracy of hospital discharge coding for stroke. Can J Cardiol 1993;9(Suppl):121D-124D. 19. Phillips SJ, Cameron KA, Chung CR. Stroke surveillance revisited. Can J Cardiol 1993; 9(Suppl):124D-125D. 20. Statistics Canada. 1996 Census dictionary, final edition. Cat. No. 92-351-UIE. Ottawa: Statistics Canada; 1999. 21. Weller SC, Romney AK. Metric scaling: correspondence analysis. Sage University Press Series on Quantitative Applications in the Social Science, 07-075. Newbury Park, CA: Sage, 1990. 22. Everitt BS, Dunn G. Applied multivariate data analysis, 2nd edition. New York: Oxford University Press, 2001. Author References Nikolaos Yiannakoulias, Health Surveillance, Alberta Health and Wellness, Edmonton, Alberta, Canada Lawrence W Svenson, Health Surveillance, Alberta Health and Wellness, and Department of Public Health Sciences, University of Alberta, Edmonton, Alberta, Canada Michael D Hill, Department of Clinical Neurosciences, University of Calgary, and Department of Community Health Sciences, University of Calgary, and Department of Medicine, University of Calgary, Calgary, Alberta, Canada Donald P Schopflocher, Health Surveillance, Alberta Health and Wellness, and Department of Public Health Sciences, University of Alberta, Edmonton, Alberta, Canada Robert C James, Department of Community Health Sciences, University of Calgary, Calgary, Alberta, Canada Andreas T Wielgosz, Centre for Chronic Disease Prevention and Control, Health Canada, and Division of Cardiology, The Ottawa Hospital, Ottawa, Ontario, Canada Thomas W Noseworthy, Department of Community Health Sciences, University of Calgary, Calgary, Alberta, Canada Correspondence: Lawrence W Svenson, Health Surveillance,
Alberta Health and Wellness, PO Box 1360 STN MAIN, Edmonton, Alberta,
Canada T5J 2N3; |
||||||||||||||||||||||||||||||||||||||||||||||
| Last Updated: 2003-03-20 | |||