|
|
|
Learning Outcomes
Students will be able to show, using graphs and statistics, how much
forested area is burned over a ten year period in Canada and in their
province or territory.
|
Summary
In this activity students will begin to understand the impact fire
has on the forested land. They will take the knowledge they have gained
in the activity and have a better understanding of how forest fires
vary from year to year and do not affect all areas of the country the
same.
|
|
Activity Information
- Grade level: Senior
- Subject: Math, Biology
- Skills: Graphing, critical analysis, statistical analysis
- Duration: 1.5 to 2 hours
- Group Size: any size
- Setting: Indoors
- Materials: Fire occurence charts, graph paper
|
|
Background
The amount of forest that burns changes every year. In fact, how much
burns in one year affects how much will burn in the future. If we track
the occurence of fire over a long enough time we can see a pattern emerging.
Usually if there are several years with very small area burned, we may
later experience one or more years of larger forest fires.Forest fires
are a natural occurrence that are affected by a number of environmental
factors. As forests are such long-lived organisms we need to track fire
occurrences over as long a time as possible in order to understand what
is going on.
|
|
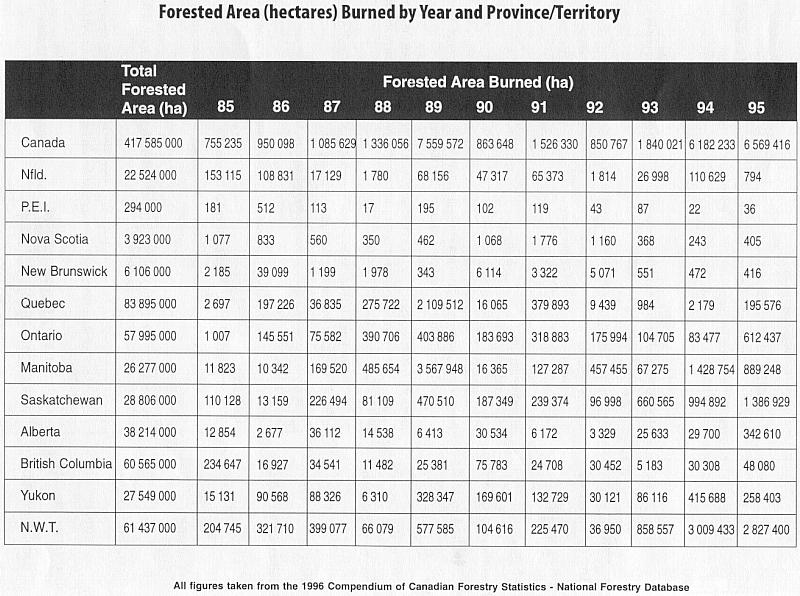
Activity
- Using the information provided, determine the amount of area burned
by fire each year for a ten year period in both Canada and your province
or territory.
- Graph your results.
- Compare the results. Does the amount of area burned in your province
or territory correspond with the national average? lf not what could
have caused the different results?
- Do you see any patterns emerging? If so what are they? Ten years
is a very short time in the life of the forest; what might be a better
time scale to use when determining forest fire occurrence patterns?
|
|
Evaluation
Have students do a short report interpreting wildland fire figures
|
|
Extension
- Since the boreal forest is also called the "fireforest" what
might we expect of provinces with a large amount of boreal forest
type in it?
- Graph the results of other provinces and compare them to yours.
|
 Home > Advanced > Teacher's Aids > Classroom Activities > Wildland Fire Figures