Common menu bar
Piste de navigation
Poverty Profile: Special Edition
A Snapshot of Racialized Poverty in Canada
Table of Contents
- Highlights
- What do we mean by the term "racialized persons"?
- Racialized Canadians have a greater risk of living in poverty
- Worsening outcomes
- What's special about this bulletin
- Putting the profile in context
- Concentrated in three provinces
- More women than men live in poverty
- More likely to live with family
- More likely to be married
- Many are children
- Many are immigrants
- Many are recent immigrants
- Almost all are first generation
- Many speak languages other than English or French
- Most common visible minority group is Chinese
- Many different ethnic origins
- High geographic mobility, much of it linked to immigration
- Higher levels of education
- Labour market participation differs by age group
- Manufacturing and retail trade are key industries
- Jobs in sales and services are common
- Less likely to be self-employed
- More likely to spend time looking after children
- Lower total and after-tax incomes
- Higher employment incomes
- Methodology notes
- Selected readings
- Acknowledgements
- Endnotes
Highlights
Compared to non-racialized persons living in poverty, racialized persons living in poverty are more likely to be:
- young
- married
- immigrants
- highly educated, and
- unemployed.
Overall their incomes are lower than non-racialized persons living in poverty. But, when they work full year in a full-time job, their employment incomes are higher than their non-racialized counterparts.
What do we mean by the term racialized persons?
We use this term to mean persons, other than Aboriginal peoples, who are non-Caucasian in race or non-white in colour.
In this bulletin, the term “racialized persons” refers to those people who self-described as a visible minority on the 2006 Census. For more information about terminology, refer to the Methodology section at the end of the bulletin.
Racialized Canadians have a greater risk of living in poverty
Racialized communities face high levels of poverty. The 2006 Census showed that the overall poverty rate in Canada was 11%. But for racialized persons it was 22%, compared to 9% for non-racialized persons.
Within the racialized community, poverty rates varied widely, from a high of 40% for those who identified as Korean to a low of 11% for those who identified as Filipino.
In two of Canada’s largest cities, more than half of all persons living in poverty were from racialized groups:
- 58% in Vancouver; and
- 62% in Toronto.
Worsening outcomes
Poverty in racialized communities is a growing problem. For example, in Toronto, the number of racialized families living in poverty increased 362% between 1980 and 2000, far greater than their population growth of 219%.1
The problem is especially severe among more recent immigrants, the vast majority of whom belong to racialized groups. In general, over the past two decades poverty rates have been rising among immigrants and falling among the Canadian born.2 This goes hand in hand with the steep decline in the relative earnings of immigrants over that time period. The decline occurred even though education levels were rising among immigrants. One study estimated that by the late 1990s, 41% of chronically poor immigrants had degrees.3
What's special about this bulletin?
A statistical profile of people living in poverty
When we looked for statistical information about the racialized community in Canada, we found many demographic and socio-economic profiles.
What we did not find was profiles that focused only on people living in poverty.
To fill this gap, we created a snapshot of the demographic and socio-economic characteristics of racialized people living in poverty in Canada. We used 2006 census data to create the profile.
We also looked at differences between this group and non-racialized persons living in poverty.
Limits to the profile
First, this profile is an overview of all racialized persons living in poverty. It does not look at specific racialized groups. We recognize that there is great diversity within the racialized community that is not captured in this overview.
Second, many of the factors that make up this snapshot are co-dependent. For example, language ability can affect employability. These relationships can be lost when looking at each factor individually. We encourage readers to step back from any particular issue and consider the big picture.
Finally, the reasons for the differences we found between racialized and non-racialized persons living in poverty are beyond the scope of this statistical profile. Readers interested in the “why” may wish to use our list of selected readings at the end of the bulletin to further explore this question.
Putting the profile in context
This profile focuses on racialized persons living in poverty. Many of the results reflect the overall make-up of the entire racialized population of Canada. For example, overall the racialized population is relatively young. It is no surprise, then, that the racialized population living in poverty is also young. Here are some key statistics about the racialized population in Canada, according to the 2006 census.
Growing population: The racialized population is growing at a faster rate than the non-racialized population. By 2031, it is projected that about one Canadian in three could belong to a racialized group, up from one in 20 in 1981.4
Geographically concentrated: More than half (54%) of the racialized population lives in Ontario, followed by British Columbia (20%), Quebec (13%) and Alberta (9%). Toronto is home to 43% of all racialized persons in Canada.
Relatively young: Thirty-eight percent of the racialized population is under 25 years old, compared to 30% of the non-racialized population.
Most live with family members: Only 8% of racialized persons do not live with any family members, compared to 15% of non-racialized persons.
Many are immigrants: Two-thirds of racialized persons are immigrants, with the majority coming from countries in Asia. A quarter of all racialized immigrants came to Canada recently, from 2001 onwards.
Much diversity: Racialized persons come from many different backgrounds. South Asian (25%), Chinese (24%) and Black (15%) represent the largest groups, although there is much diversity within these three groups.
Often highly educated: Forty-four percent of racialized persons aged 25 to 64 years hold a university certificate, diploma or degree, compared to 25% of non-racialized persons.
Lower incomes: The median income for racialized persons in 2005 was $19,100 compared to $27,100 for non-racialized persons.
Most work, but employment incomes are lower: The employment rate for the core working-age group5 of racialized persons was 75% at the time of the 2006 census, and the unemployment rate was 6%. Employment incomes were lower for racialized persons than non-racialized – a median of $22,400 compared to $27,900.
Concentrated in three provinces
There were 1.1 million racialized persons living in poverty in Canada in 2006. They made up:
- 4% of the total population
- 22% of all racialized persons
- 32% of all persons living in poverty.
Just over half (52%) lived in Ontario, followed by British Columbia (20%) and Quebec (18%).
Toronto was home to 41% of all racialized persons living in poverty. Vancouver was a distant second, with 18%, followed by Montreal at 17%. Together, these three cities were home to 76% of racialized persons living in poverty.
Different geographic distribution for non-racialized persons
The 2.4 million non-racialized persons living in poverty were not as heavily concentrated in Ontario. About a third (32%) lived in Ontario, followed by Quebec (30%) and British Columbia (13%).
By city, 16% of poor non-racialized persons lived in Montreal, followed by Toronto (11%) and Vancouver (6%). This totals to 34%, a far cry from the 76% of poor racialized persons living in these three cities.
More women than men live in poverty
Racialized women living in poverty outnumbered men by a factor of 52% to 48%.
This is similar to the non-racialized population, where 54% of those living in poverty were women and 46% were men.
More likely to live with family
Most racialized persons living in poverty lived with other family members (81%). For poor non-racialized persons, the number was much lower (58%). In other words, only 19% of poor racialized persons did not live with any family members compared to 42% of poor non-racialized persons.6
Much of the difference is accounted for by the high number of non-racialized persons in poverty who lived alone – 29% compared to 10% of poor racialized persons.
More likely to be married
Among racialized persons 15 years and older who lived in poverty, more were married than single (44% compared to 41%).
This is in stark contrast to non-racialized persons living in poverty where 19% were married and 52% were single.
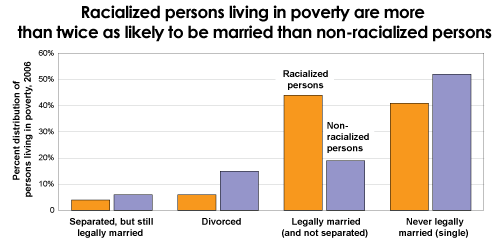
Non-racialized persons living in poverty were more likely to live in a common-law relationship – 8% compared to 3% of racialized persons.
Many are children
The population of racialized persons living in poverty is young. Almost half (46%) are less than 25 years old.
- 27% were less than 15 years old.
- 19% were 15 to 24 years old.
Ten percent were 55 years and older.
For non-racialized persons living in poverty, the age distribution is older. Only 36% were less than 25 years old.
- 18% were less than 15 years old.
- 17% were 15 to 24 years old.
Almost a quarter (23%) were 55 years and older.
Many are immigrants
The majority of racialized persons (66%) living in poverty were immigrants. A further 8% were non-permanent residents.7 The remaining 25% were born in Canada.
For non-racialized persons, 12% of those living in poverty were immigrants.
Persons from racialized groups made up 54% of all immigrants in Canada. However, they made up 71% of all immigrants living in poverty.
For racialized persons, almost three in four poor immigrants were born in Asia and the Middle East. For non-racialized groups, almost three in four poor immigrants were born in Europe, with most coming from Eastern and Southern Europe.
View from the cities
Asia and the Middle East was the most common place of birth for racialized immigrants living in poverty in all three cities, but the proportions varied widely:
- Montreal – 47% of poor racialized immigrants were born in Asia and the Middle East
- Toronto – 74%
- Vancouver – 91%.
Many are recent immigrants
Almost two-thirds (61%) of the racialized immigrants living in poverty came to Canada in the previous ten years, between 1996 and 2006. Among these, seven out of ten arrived in the previous five years, 2001 to 2006. A small number (9%) of those living in poverty immigrated before 1981.
Among non-racialized immigrants living in poverty, a smaller number (37%) immigrated to Canada in the previous ten years. They were more likely to have immigrated before 1981(42%).
Almost all are first generation
Ninety percent of racialized persons living in poverty are first generation immigrants.8 This may be a reflection both of the large number of recent immigrants in this population as well as the challenges they face in establishing themselves in their new country.
Only 15% of non-racialized persons living in poverty are first generation. Most (72%) are third generation or more.
Many speak languages other then English or French
The majority have a mother tongue that is not English or French
Almost three-quarters (72%) of racialized persons living in poverty have a mother tongue other than English or French.For non-racialized persons, the corresponding number is 12%.The most common mother tongues among racialized persons living in poverty are Chinese languages. For poor non-racialized persons, they are German, Italian and Russian.
View from the cities
Chinese languages were the most common mother tongue among racialized persons living in poverty in Toronto (28%) and Vancouver (54%). In Montreal, the most common mother tongue was Arabic (23% of poor racialized persons).
More than a third use English or French at home
One in three (33%) racialized persons living in poverty said that English was the language spoken most often at home. For 6%, the language was French. For another 5%, it was English and a non-official language.
Over half (54%) of racialized persons living in poverty said that a language other than English or French was spoken most often at home. This is lower than the 72% who reported that their mother tongue was neither English nor French.
Among non-racialized persons living in poverty, 66% said that English was spoken most often at home, followed by French (26%) and other languages (6%).
Most persons living in poverty have knowledge of English and/or French. Only 10% of racialized persons and 1% of non-racialized persons did not have knowledge of either official language.
Most common visible minority group is Chinese
The breakdown by visible minority groups for racialized persons living in poverty is very similar to that for the total racialized population.
Close to a quarter (24%) of racialized persons living in poverty identified as belonging to the Chinese group, followed by South Asian (20%) and Black (18%).
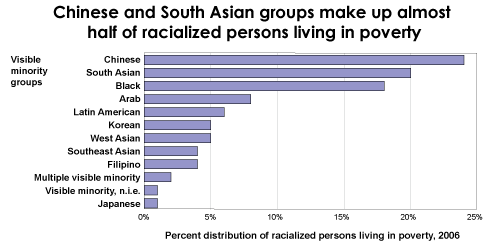
These visible minority groups defined by the federal Employment Equity Act hide much of the diversity within the groups. For example, South Asian includes people belonging to Indian, Pakistani, Sri Lankan and Bangladeshi groups. The visible minority grouping of Black can include people with African or Caribbean roots.
Many different ethnic origins
In the census, people could identify one or more ethnic origins. That is why the sum of the different ethnic origins may be greater than 100%.
The diversity among racialized persons living in poverty is evident when we look at ethnic origins.
For racialized persons living in poverty, the East and Southeast Asian groups were the most frequently cited ethnic origin (40%). The category was dominated by the Chinese group, followed by the smaller Korean, Filipino and Vietnamese groups.
The second most cited origin was South Asian (20%). The East Indian group made up about half of this category, followed by the Pakistani group.
Other frequently cited origins were African (11%), Caribbean (9%) and Arab (9%).
For non-racialized persons living in poverty, the most frequently cited ethnic origins were Canadian (38%), followed by British Isles (36%), European (34%) and French (20%). Aboriginal origins, which fall in this group due to our use of the concept of visible minority, were cited by 10%.
View from the cities
The most common visible minority group varied by city:
- Montreal – Black (27% of poor racialized persons)
- Toronto – South Asian (28%)
- Vancouver – Chinese (51%).
In both Toronto and Vancouver, the most common ethnic origin among poor racialized persons was East and Southeast Asian – 35% of persons in Toronto and 75% in Vancouver. In Montreal, the most common ethnic origins were East and Southeast Asian along with Arab. Both origins were reported by 21% of racialized persons living in poverty
High geographic mobility, much of it linked to immigration
Racialized people living in poverty are more likely to move than other people living in poverty. In 2006, 68% were living at a different address than they were five years earlier. This is higher than the comparable number of 56% for the non-racialized population living in poverty.
Among poor racialized persons who moved, the most common move was from another country to Canada. This reflects the high number of recent immigrants who live in poverty.
If we look at mobility status over just one year, the difference between racialized and non-racialized persons living in poverty pretty well disappears. For example, 30% of racialized persons were living at a different address in 2006 than they were in 2005. The number for poor non-racialized persons was similar at 26%.
People living in poverty tend to move more often than people who don’t live in poverty. People living in poverty may be forced to move in search of more affordable and suitable housing, or if they are dissatisfied with neighbourhood conditions. They may move in search of better employment opportunities or better access to services.
Higher levels of education
Overall, racialized persons living in poverty had higher levels of education than non-racialized persons.
For example, looking at those with less than high school graduation shows that non-racialized persons living in poverty were more likely to fall into this category (34%) compared to racialized persons (24%).
At higher levels of education, 11% of non-racialized persons living in poverty had a university certificate or degree, compared to 25% of racialized persons.
When we look at the working-age population (25 to 64 years old), the differences are even larger.
Table 1: Percent of persons, 25 to 64 years old, living in poverty by highest level of education
|
Non-racialized persons |
Racialized persons |
|
|---|---|---|
|
Less than high school |
29% |
17% |
|
University certificate or degree |
13% |
32% |
The high levels of education for racialized persons reflect the high levels of education for immigrants, who make up two-thirds of racialized persons living in poverty.
Racialized persons more likely to have studied outside Canada
For those racialized persons living in poverty who had a post-secondary qualification9, the majority (68%) received their qualification outside Canada. The rest (32%) received their qualification inside Canada.
For non-racialized persons, the reverse was true. The vast majority (85%) received their qualification inside Canada, while a small number (15%) received it outside Canada.
Some differences in field of study
For both racialized and non-racialized persons living in poverty who had a post-secondary qualification, the two most common fields of study were:
- business, management and public administration
- architecture, engineering and related technologies.
Looking at other fields of study, racialized persons living in poverty were more likely to specialize in the sciences and maths. Thirteen percent studied sciences or mathematics/computers, compared to 7% of non-racialized persons living in poverty.
Labour market participation differs by age group
Racialized youth less likely to be in the labour force
Among youth aged 15 to 24 years and living in poverty, racialized youth had lower rates of labour force participation and employment than other youth.
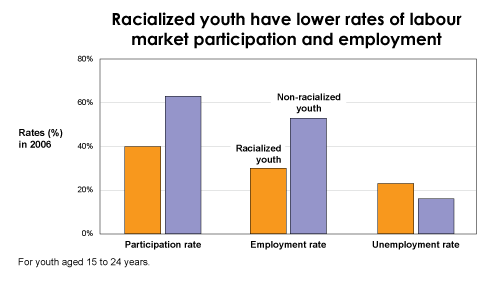
Some of this difference may be explained by the fact that, in general, school attendance is higher for racialized youth than other youth. Young immigrant students are also less likely to combine work and school than Canadian-born youth.10
For those youth living in poverty who want to work, racialized youth had a higher unemployment rate (23% compared with 16% for non-racialized youth).
Many adults work, but are still living in poverty
In 2006, 64% of racialized adults aged 25 to 54 who were living in poverty participated in the labour force, that is, they were either employed or looking for work. This is basically the same rate as non-racialized persons living in poverty (63%).
Higher unemployment rates for racialized adults
The employment rates were the same for racialized and non-racialized persons living in poverty – 53%.
Unemployment rates were higher for racialized persons living in poverty – 17% compared to 15% for other persons.
View from the cities
Unemployment rates for racialized adults living in poverty were much higher in Montreal (28%) compared to Toronto (15%) and Vancouver (13%).
Different patterns for men and women
Among men living in poverty, racialized men have higher rates of labour force participation and employment than other men. However, they have the same unemployment rate – 15% - as other poor men.
For women living in poverty, racialized women have lower rates of labour force participation and employment than other women. In addition, they have higher rates of unemployment.
Tables 2.1-2.3: Labour force status of working-age adults (25-54 years) living in poverty, 2006
Table 2.1: Participation rate
| Racialized persons | Non-racialized persons | |
|---|---|---|
| Women | 55% | 57% |
| Men | 74% | 68% |
Table 2.2: Employment rate
| Racialized persons | Non-racialized persons | |
|---|---|---|
| Women | 44% | 48% |
| Men | 63% | 58% |
Table 2.3: Unemployment rate
| Racialized persons | Non-racialized persons | |
|---|---|---|
| Women | 19% | 16% |
| Men | 15% | 15% |
The age of children impacts the labour force participation of women
Women living in poverty are less likely to participate in the labour force when children under six years old live in their household. They are more likely to participate when the children are all six years and older.
For both age groups of children, racialized women living in poverty have slightly lower participation and employment rates than non-racialized women, and they have higher unemployment rates.
Women living in poor households are less likely to participate in the labour force than women from non-poor households, no matter the age of the children. For example, in households where all children were under six years old, 30% of racialized women from poor households were employed, compared to 61% of racialized women in households that were not poor.
Manufacturing and retail trade are key industries
Among those living in poverty who worked, racialized men were most likely to have jobs in these industries:
- manufacturing (13%)
- retail trade (13%)
- accommodation and food services (13%).
The industry distribution for non-racialized men living in poverty was slightly different:
- construction (14%)
- manufacturing (11%)
- retail trade (11%).
Racialized men were more likely than non-racialized men to work in transportation and warehousing, as well as professional, scientific and technical services.
Women living in poverty who worked were most likely to have jobs in these three industries:
- retail trade (16% of racialized women compared to 17% of non-racialized women)
- accommodation and food services (15% compared to 17%)
- health care and social assistance (13% for both groups).
Poor racialized women were almost twice as likely to work in manufacturing than other poor women (9% compared to 5%).
Some of the heaviest job losses during the 2008-2009 recession were in the manufacturing and construction sectors11 - two industries that employed many of the working poor.
Jobs in sales and services are common
Almost half of poor women in the paid labour force had jobs in sales and services occupations. Among these types of occupations, racialized women were:
- more likely to work as childcare and home support workers than other women
- less likely to work in food and beverage occupations.
Among men living in poverty, the most common occupations were related to:
- sales and services
- trade, transport and equipment operators (includes construction trades).
Racialized men were more likely to have occupations in the first category (31% of workers). Non-racialized men were more likely to have occupations in the second (28% of workers).
Occupations in services tend to have limited job security, few employment benefits, and very low wages.12
Less likely to be self-employed
People living in poverty who were over 15 years old and worked in the paid labour force were mainly paid employees (82% of racialized persons and 79% of non- racialized persons).
Non-racialized persons were more likely to be self-employed: 20% compared to 17% of poor racialized workers.13
Men living in poverty were more likely to be self-employed than women. Poor non-racialized men were more likely to be self-employed than poor racialized men.
For both racialized and other persons living in poverty and working, only 1% were unpaid family workers.
More likely to spend time looking after children
Poor racialized men and women were more likely to spend time on unpaid childcare activities than other persons living in poverty:
- Almost half (48%) of poor racialized women compared to 35% of other poor women.
- More than a third (37%) of poor racialized men compared to 23% of other poor men
However, when we look at those persons who devoted long hours to unpaid childcare activities, the breakdowns are about the same between racialized and non-racialized persons living in poverty.
- For women, about one in five spent 30 hours or more each week in childcare activities (20% of poor racialized women compared with 18% of other poor women).
- For men, a small number spent 30 hours or more each week (7% of poor racialized men compared with 6% other poor men).
Lower total and after-tax incomes
The data show incomes in 2005 for individuals who are 15 years and older. Like the rest of this profile, the income data shown is for people living in poverty.
The median income is the midpoint in the income series. That is, half the individuals have incomes above the median and half the individuals have incomes below the median.
Total income higher for women
In 2005, 15% of racialized persons living in poverty reported no income of their own. This was almost twice the proportion for non-racialized persons living in poverty (8%).
Poor racialized persons had lower median total income than other persons living in poverty ($7,800 compared with $9,300).
To put the incomes of persons living in poverty in perspective, the median total income of persons not living in poverty was $24,700 for racialized persons and $30,100 for non-racialized persons.
Median incomes were higher for women living in poverty than for men in both the racialized and non-racialized groups. This is opposite to the pattern observed for persons not living in poverty, where the median incomes of men were higher than those of women.
Table 3: Median total income of individuals living in poverty, 2005
| Racialized persons | Non-racialized persons | |
|---|---|---|
| Both sexes | $7,800 | $9,300 |
| Women | $8,600 | $10,100 |
| Men | $6,700 | $7,800 |
View from the cities
Median total income for racialized persons living in poverty was noticeably lower in Vancouver ($6,500) than in Toronto ($8,000) and Montreal ($8,800).
After-tax income higher for women
In 2005, the median after-tax income for individuals living in poverty was lower for racialized persons ($7,800) than non-racialized persons ($9,100).
For both racialized and non-racialized persons living in poverty, women’s median after-tax incomes were higher than those for men.
As with total income, this is opposite to the pattern observed for persons who do not live in poverty. For those persons, women’s median after-tax incomes are only 69% to 75% of men’s incomes.
Higher employment incomes
Racialized persons living in poverty had higher median employment income in 2005 than other persons living in poverty ($6,600 compared to $6,200).
To put it in perspective, the median employment income for people not living in poverty was $26,500 for racialized persons and $30,000 for non-racialized persons.
Men living in poverty had higher median employment incomes than women in both racialized and non-racialized groups. This is opposite to what we see for total income and after-tax income. It indicates that the higher total incomes and after-tax incomes for women living in poverty are driven by sources other than earnings.
We were not able to identify the other sources of income from our data. However, it is probable that the main source of this difference is child benefits. Child tax benefits in Canada are usually paid to mothers. In 2005, a family living in poverty that had one child could have received up to $3,000 in benefits.
View from the cities
The pattern flips on its head when we look at the cities. Median employment income was lower for poor racialized workers in Montreal, Vancouver and Toronto. This change occurs because in the cities, incomes for poor non-racialized workers were about $1,000 higher than the national median while incomes for racialized workers stayed close to the national median.
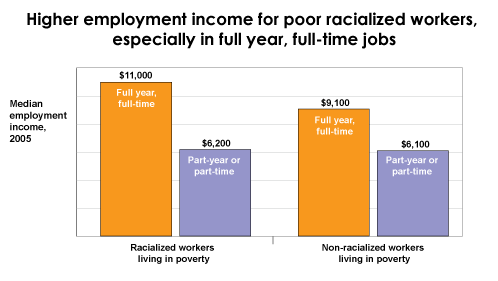
Employment income is highest for those working full year, full-time
For racialized persons living in poverty, median employment income was 1.8 times higher for those who worked full year, full-time than for those who worked part year or part-time.14 For non-racialized persons living in poverty, the gap was smaller at 1.5 times.
Among poor women working full year, full-time, racialized women had higher median income than other women. On the flip side, when working part year or part-time, their median income was lower than that of other poor women.
For men living in poverty, racialized men had higher median employment income than other men, regardless of full-time or part-time status.
View from the cities
Full year, full-time workers living in poverty
Median employment income was higher for racialized workers than for other workers in Montreal, Toronto and Vancouver. The gap between the two groups was smaller in the cities than at the national level.
Part year or part-time workers living in poverty
Median employment income was lower for racialized workers than other workers, except for men in Toronto.
Full-time, part-time status
About one in four (23%) racialized workers living in poverty worked full year, full-time. This is just below the percentage for non-racialized persons (25%).
The remainder worked part year or part-time.
The breakdown for poor racialized and non-racialized women workers was exactly the same: 20% worked full year, full-time, while 80% worked part year or part-time.
Poor racialized men were less likely to work full year, full-time than their non-racialized counterparts – 26% of workers compared to 30%.
Methodology notes
Data source
Detailed data about racialized and non-racialized persons living in poverty is only available from the Census. The National Council of Welfare purchased 2006 Census semi-custom tabulations – called target group profiles – from Statistics Canada. The target group profiles provide a fixed set of census characteristics for a custom target group. Our custom target groups were persons who self-identified as “visible minority” and persons who did not. These two categories were then further broken down into those living in poverty and those not living in poverty.
Definitions
Visible minority: The Census uses the concept of visible minority from the federal Employment Equity Act. The Act defines visible minorities as ‘persons, other than Aboriginal peoples, who are non-Caucasian in race or non-white in colour.’
Racialization: The process through which groups come to be designated as different, and on that basis subjected to differential and unequal treatment. In the present context, racialized groups include those who may experience differential treatment the basis of race, ethnicity, language, economics, religion, culture, politics, etc. (Canadian Race Relations Foundation Glossary)
Racialization of poverty: A phenomenon where poverty becomes disproportionately concentrated and reproduced among racialized group members.
Poverty: After-tax low income cut-offs (LICOs) are used to measure poverty in this bulletin. For further details about LICOs and poverty measures, see our Poverty Profile 2007 bulletin Methodology, Definitions and Information Sources. The low income cut-offs (LICO) are only available for persons in private households in the ten provinces. That means the data in this bulletin does not include residents of the Yukon, the Northwest Territories and Nunavut, persons living on Indian reserves and residents of institutions.
Rounding
In some text, tables or charts, the components may not add up exactly to the displayed total. This is because we derive the totals from unrounded components. The totals are not calculated by adding up the rounded components.
Selected readings
Here are a few readings to help you understand the causes and impact of racialized poverty in Canada.
- Block, S. Ontario’s Growing Gap: The Role of Race and Gender. Ottawa: Canadian Centre for Policy Alternatives, 2010.
- Canadian Council on Social Development. “Unequal Access: A Canadian Profile of Racial Differences in Education, Employment and Income,” Canadian Race Relations Foundation, 2000.
- Colour of Poverty. Understanding the Racialization of Poverty in Ontario (series of 10 factsheets), 2007.
- Galabuzi, G. “Social Exclusion.” In Social Determinants of Health (second edition), edited by Dennis Raphael. Toronto: Canadian Scholars’ Press Inc., 2009.
- Galabuzi, G. Canada’s Economic Apartheid: The Social Exclusion of Racialized Groups in the New Century. Toronto: Canadian Scholars’ Press Inc., 2006.
- Reitz, Jeffery & Rupa Banerji. “Racial Inequality, Social Cohesion and Policy Issues in Canada,” in Belonging? Diversity, Recognition and Shared Citizenship in Canada, edited by Keith Banting, Thomas Courchene and F. Leslie Seidle. Institute for Research on Public Policy, 2007.
Much work has been done that looks specifically at immigrants in Canada. Here is just a short sample of some of this work.
- Boudarbat, Brahim and Thomas Lemieux. “Why are the relative wages of immigrants declining? A distributional approach.” Canadian Labour Market and Skills Researcher Network, Working Paper No. 65 (2010).
- Picot, G., Feng Hou and Simon Coulombe. “Chronic low income and low-income dynamics among recent immigrants.” Ottawa: Statistics Canada, 2007. Statistics Canada, catalogue no. 11F0019MIE294.
- Picot, G. and A. Sweetman. “The deteriorating economic welfare of immigrants and possible causes: Update 2005”. Ottawa: Statistics Canada, 2005. Statistics Canada, catalogue no. 11F0019MIE2005262.
- Reitz, Jeffrey G. “Immigrant employment success in Canada, part II: Understanding the decline.” Journal of International Migration and Integration, 8(1), 37-62 (2007).
- Worswick, C. “Immigrants’ declining earnings: Reasons and remedies.” C.D. Howe Institute Backgrounder #81 (April 2004).
If you have other suggested readings you would like to share, please send them to us at info@ncw-cnb.gc.ca.
Acknowledgements
The Council would like to thank Grace-Edward Galabuzi, Margaret Sokol, Eden Thompson and Carla Valle-Painter for their comments on an earlier version of this paper.
January 2012
Endnotes
1 United Way of Toronto and the Canadian Council on Social Development. Poverty by Postal Code: The Geography of Neighbourhood Poverty, 1981-2001. Toronto: United Way of Toronto, April 2004.
2 Picot, Garnett and Feng Hou. The rise in low income rates among immigrants in Canada. Statistics Canada Catalogue no. 11F0019MIE2003198, June 2003.
3 Picot, Garnett, Feng Hou and Simon Coulombe. Chronic Low Income and Low-income Dynamics Among Recent Immigrants. Statistics Canada Catalogue no. 11F0019MIE2007294, January 2007.
4 Statistics Canada. Projections of the diversity of the Canadian population, 2006 to 2031. Ottawa: Statistics Canada, 2010. Statistics Canada catalogue no. 91-551-X.
5 Core working-age is defined as persons 25 to 54 years old.
6 Persons who do not live with any family members may live alone or they may live with non-relatives.
7 Non-permanent residents refers to people from another country who had a Work or Study Permit, or who were refugee claimants at the time of the census, and family members living in Canada with them.
8 Among those persons who are 15 years and older. First generation immigrants are defined as those persons born outside Canada as well as non-permanent residents.
9 Includes post-secondary degrees, diplomas or certificates, i.e. trades certificates, college diplomas or university certificates or diplomas held by persons 18 to 64 years old.
10 Jean Lock Kunz. Being Young and Visible: Labour Market Access among Immigrant and Visible Minority Youth. Human Resources Development Canada. May 2003.
11 Statististics Canada. “Study: Canada’s employment downturn.” The Daily, November 12, 2009.
12 Martin Prosperity Institute. “Supersized and Precarious: The Service Class in Canada.” Rotman School of Management, University of Toronto. November 16, 2009.
13 Includes incorporated and unincorporated self-employment.
14 Full-time, full-year earners worked 49 to 52 weeks, mostly full time (i.e. 30 hours or more per week). Individuals with self-employment income are included. Net income is used for the self-employed individuals.