Ninety-seven percent of electors surveyed said they were aware that a federal by-election took place on December 12, 2022, in their riding.
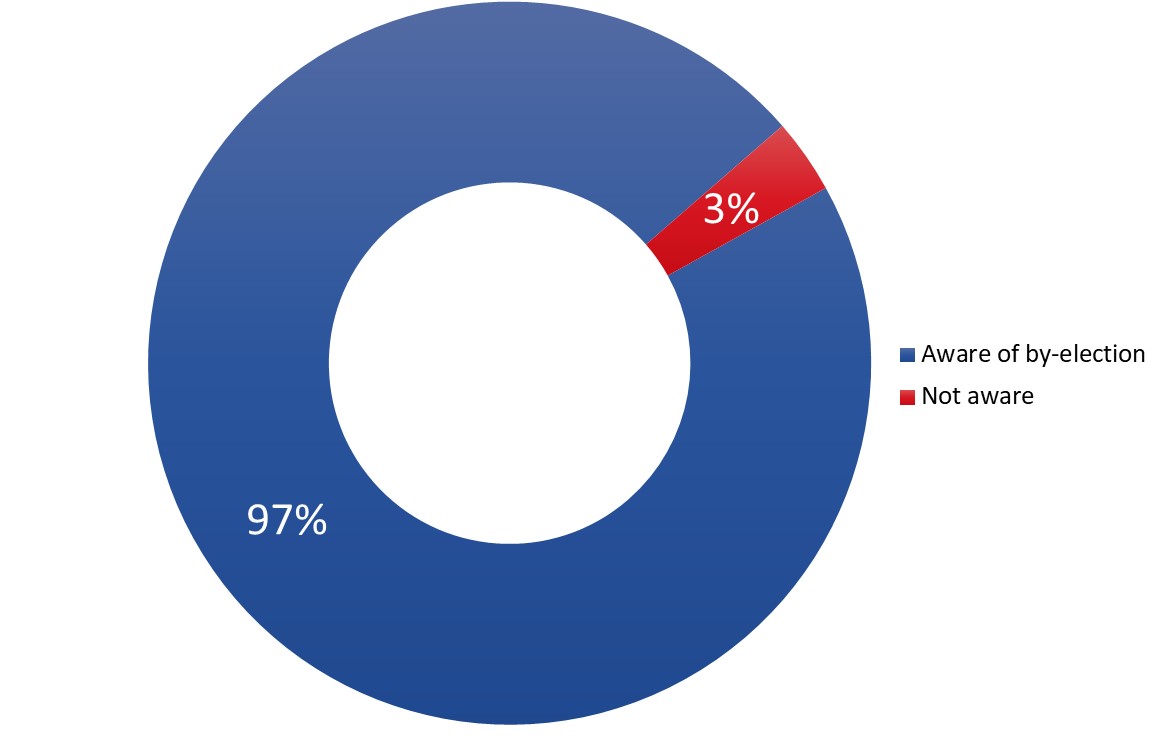
Q6: Did you know that a federal by-election took place on December 12, 2022, in your riding? Base: n=400; all respondents.
This pie chart shows how many respondents said they were or were not aware of the by-election. Ninety-seven percent said they were aware of the by-election. Three percent said they were not aware.
Awareness of the by-election was lower among:
Two-thirds (66%) were aware that electors can register at the polling place and then vote immediately after. In contrast, one in 10 were not aware that this is possible, and one-quarter said they did not know one way or the other.
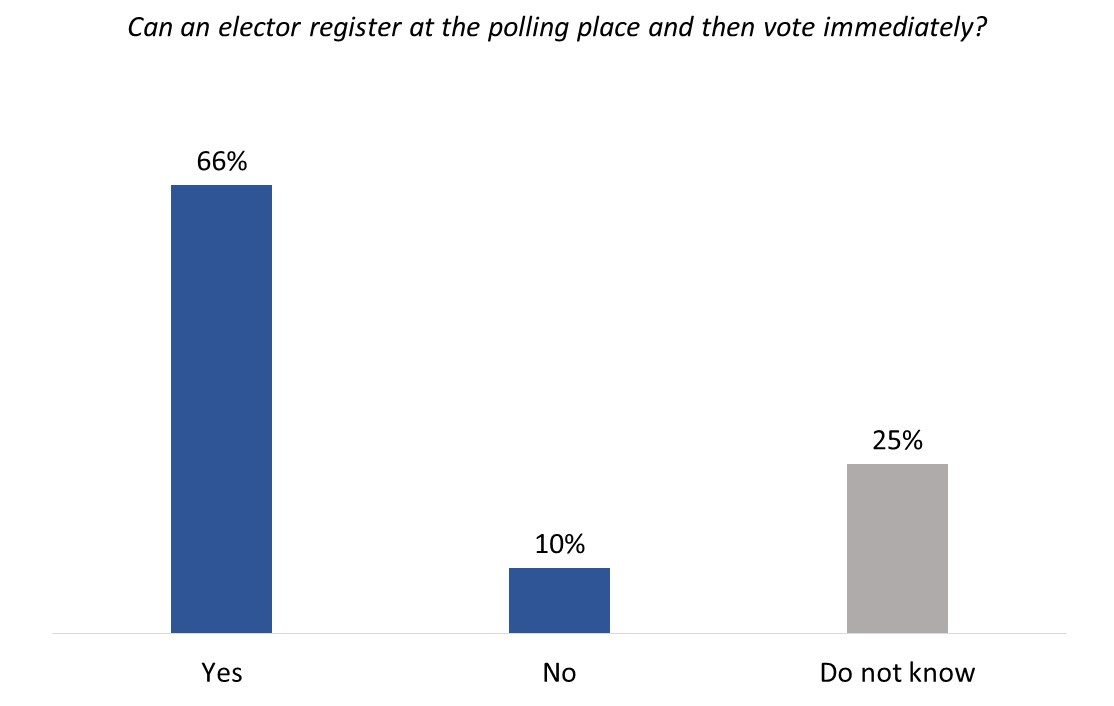
Q7. If an elector is not registered on election day and wants to vote, can they register at the polling place and then vote immediately after? Base: n=400; all respondents.
The vertical bar chart shows the percentage of voters who believe electors can register at the polling place and then vote immediately. The breakdown is as follows:
Those between the ages of 18 and 34 (57%) were less likely than electors aged 35 to 54 (74%) to be aware that electors can register at the polling place and vote immediately after.
Over half (58%) of surveyed electors said it is possible for Canadian electors to check, update or complete their voter registration on Elections Canada's website. Only 6% said that it is not possible, while just over one-third (37%) said they did not know one way or the other.
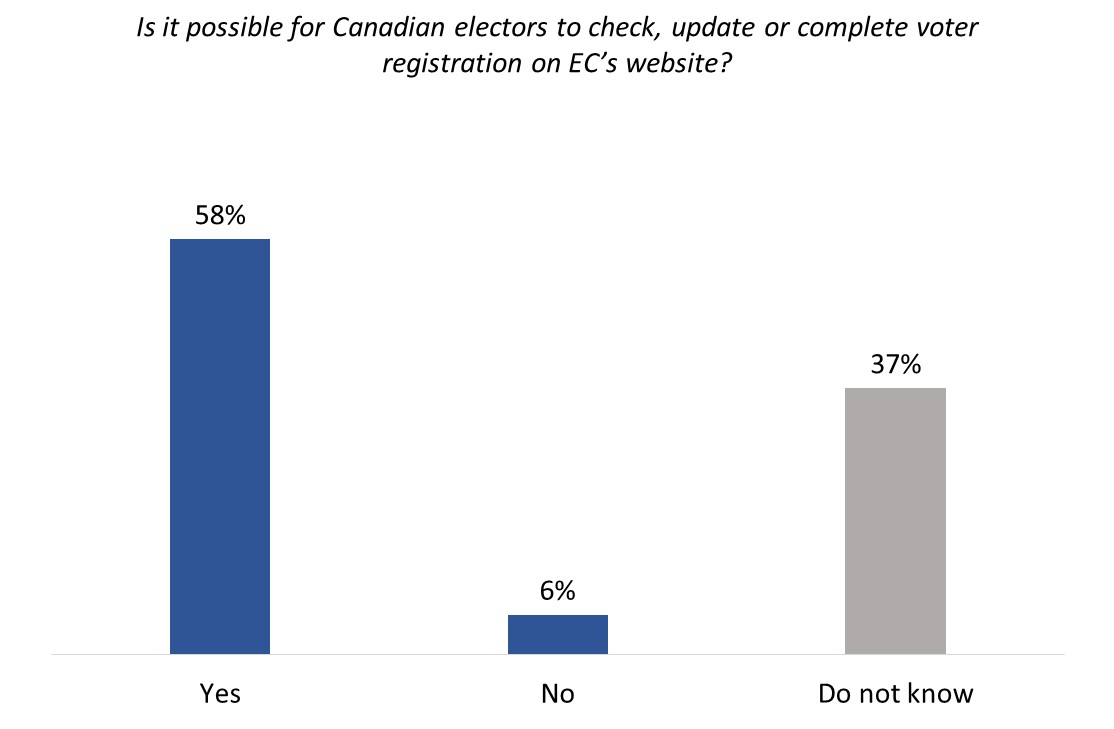
Q8. Is it possible for Canadian electors to check, update or complete their voter registration on Elections Canada's website? Base: n=400; all respondents.
The vertical bar chart shows the percentage of voters who were aware that Canadian electors can check, update or complete their voter registration on Elections Canada's website. The breakdown is as follows:
The likelihood of knowing it is possible for electors to check, update, or complete their voter registration on Elections Canada's website decreased as age increased, from 73% of those aged 18 to 34, to 47% of those aged 55+.
The vast majority of respondents know that electors have to present a proof of identity (96%) and address (89%) in order to vote in a Canadian federal election.
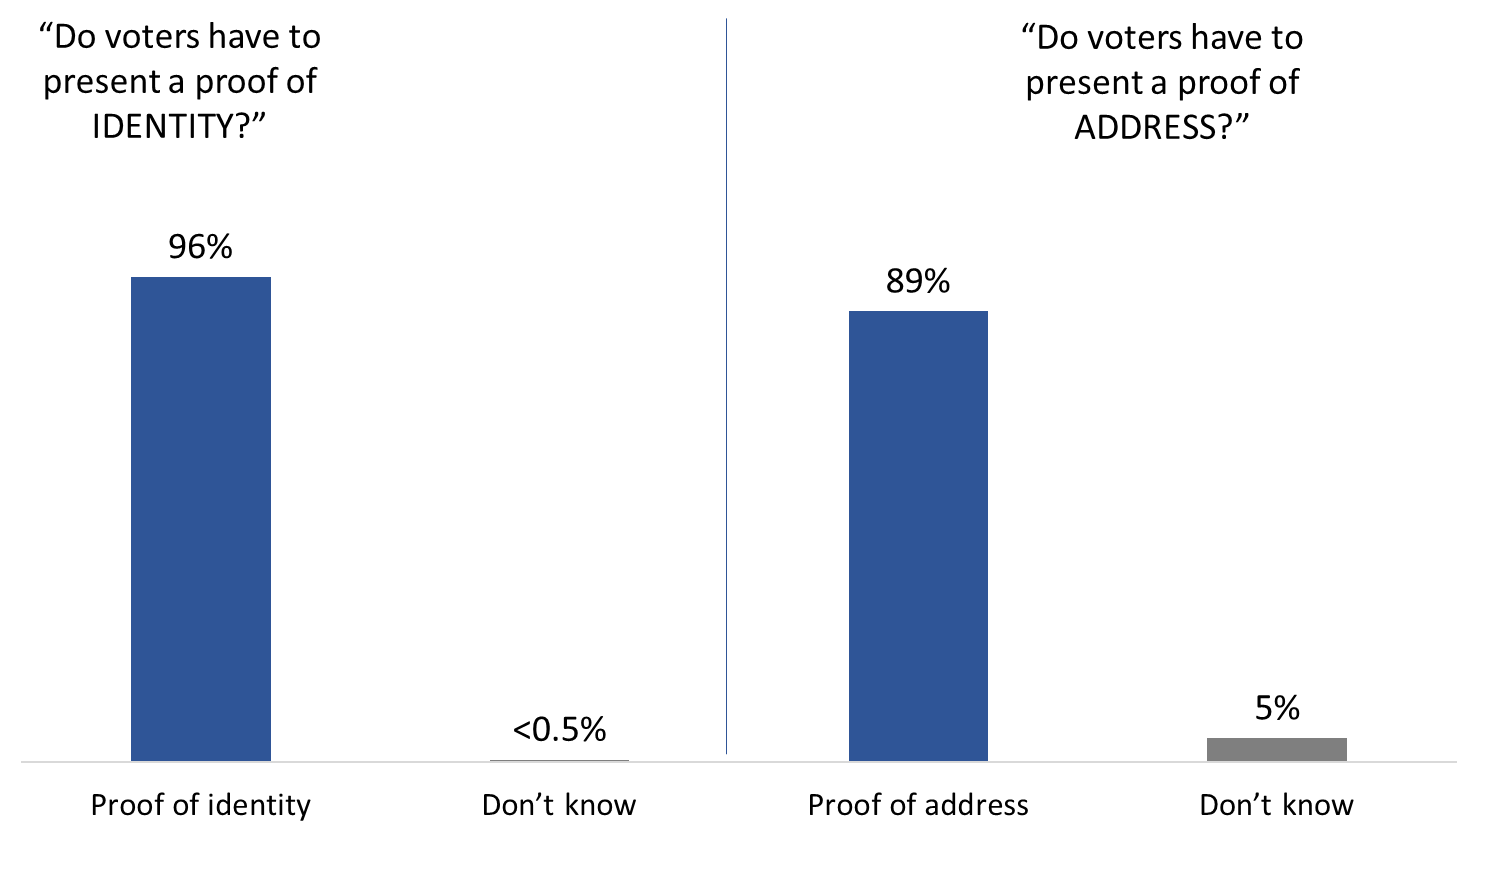
Q9. In order to vote in a Canadian federal election, do voters have to present a proof of IDENTITY?
Q10. In order to vote in a Canadian federal election, do voters have to present a proof of ADDRESS?
Base: n=400; all respondents.
The vertical bar chart (left) shows the percentage of those who believe voters must show proof of identity. 96 percent think proof of identity must be shown; less than 0.5 percent don't know.
The vertical bar chart (right) shows the percentage of those who believe voters must show proof of address. 89 percent think proof of address must be shown; 5 percent don't know.
All respondents were asked to identify the current ways that electors can vote in a federal election. The vast majority (92%) identified voting in person at a polling station on election day, followed by voting at advance polls in person (72%) and voting by mail (62%). Fourteen percent said it is possible to vote at a local Elections Canada office or the office of the returning officer before election day, and 11% said it is possible to vote online, although they did not specify how. All other responses were mentioned by smaller proportions as indicated in Figure 5.footnote 1
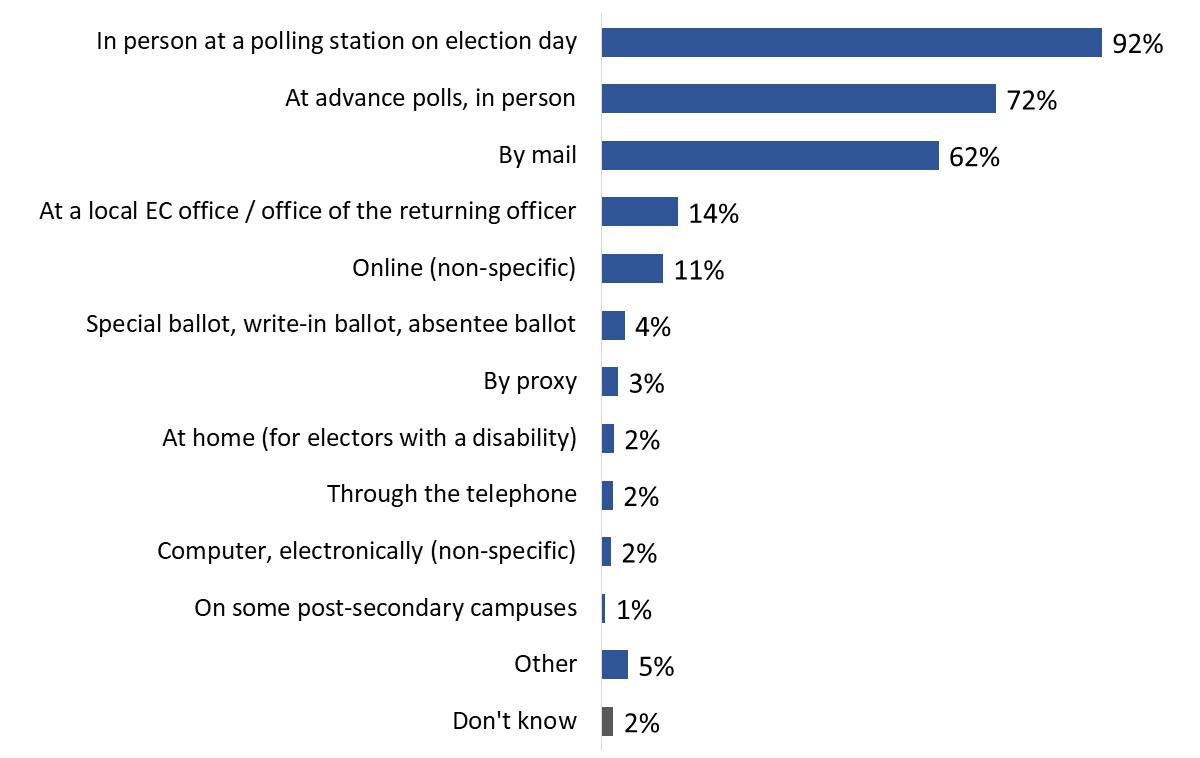
Q11. To the best of your knowledge, what are the current ways that electors can vote in a federal election? (Multiple responses accepted). Base: n=400; all respondents.
This horizontal bar chart shows the percentage of respondents who knew they could vote at an advance polling station, at the Elections Canada office, and by mail. The breakdown is as follows:
Notable subgroup differences include the following:
More than nine in 10 (94%) of those aware of the federal by-election said they received a voter information card (VIC) addressed to them personally and telling them where and when to vote during the campaign. Nearly all electors who received a VIC reported it had the correct name (98%) and address (99%).
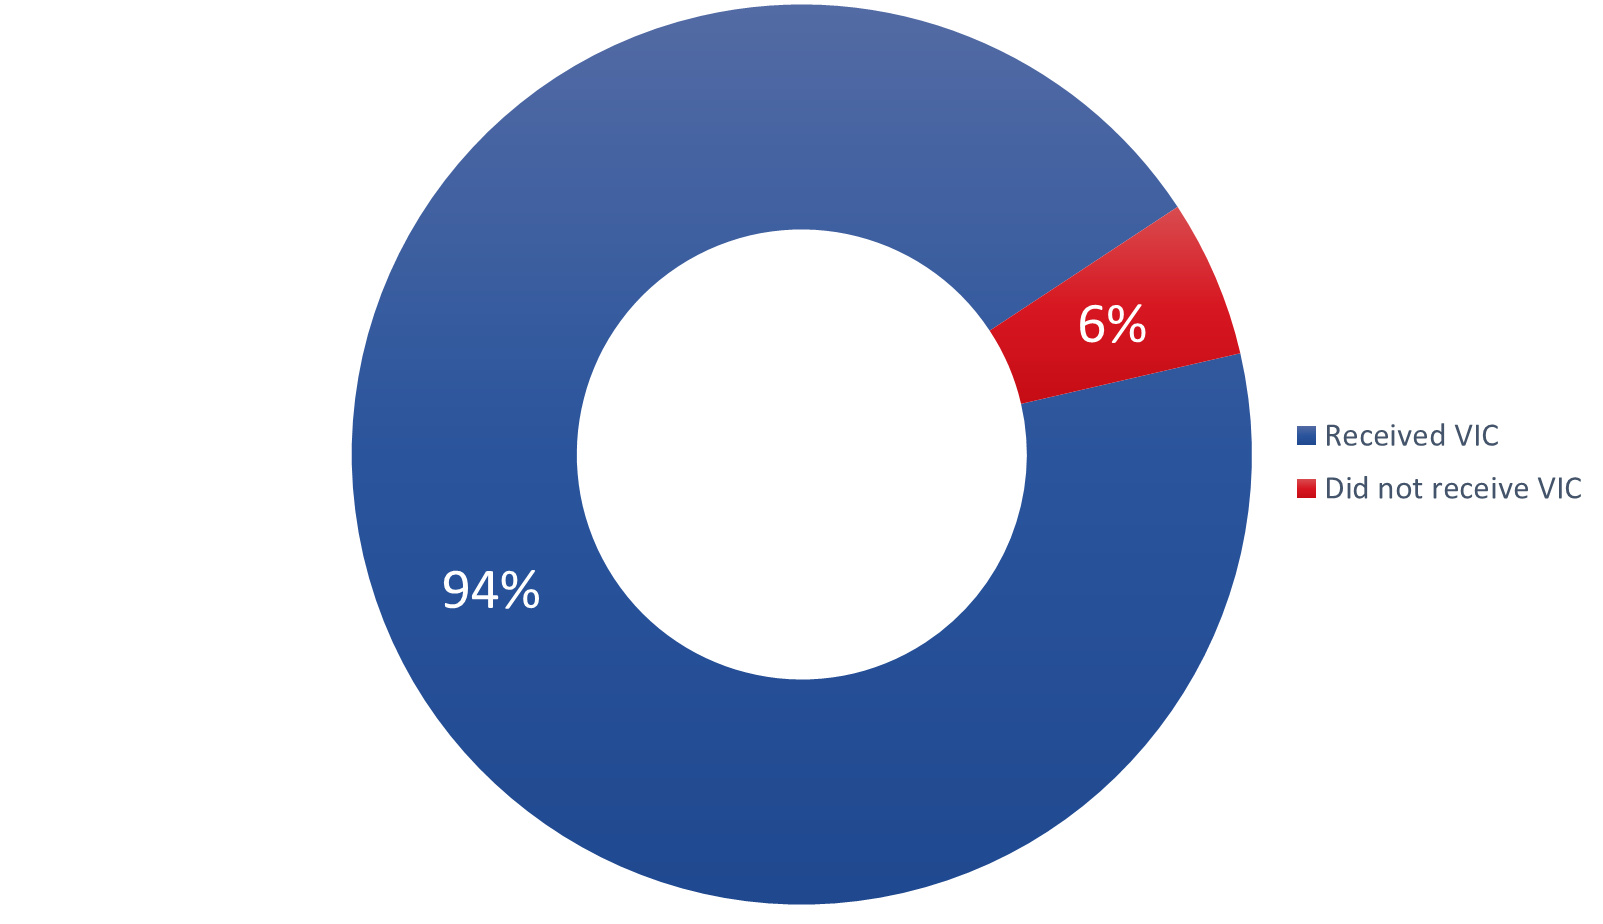
Q12. During the campaign, did you receive a voter information card addressed to you personally and telling you where and when to vote? Base: n=389; those aware of the by-election.
This pie chart shows the percentage of respondents who received their Voter Information Card, or VIC. 94 percent received their VIC and 6 percent did not receive their VIC.
The following groups of electors were less likely to say they received a VIC:
Respondents aware of the by-election (n=389) were asked if they recalled seeing or hearing advertising from Elections Canada about where, when, and how to vote. Nearly two-thirds (64%) recalled advertising on at least one medium or format. Specifically, approximately one-quarter recalled advertising from EC on social media (24%) or on the radio or an audio platform (23%). Following this, roughly one in five recalled advertising from EC when browsing or on a mobile application (22%) or reading a local newspaper (20%).
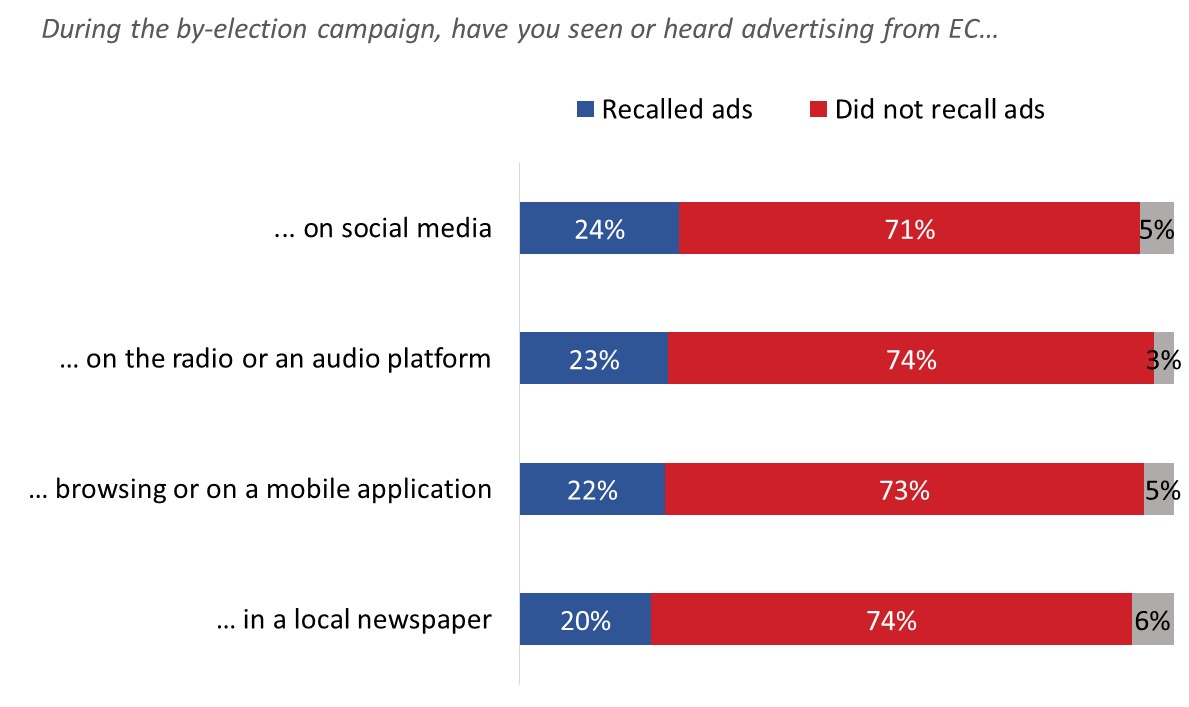
Q17-Q20. During the federal by-election campaign, did you see or hear advertising from Elections Canada about where, when, and how to vote on....? Base: n=389; those aware of the by-election.
The horizontal bar chart shows the percentage of respondents who saw or heard advertising from Elections Canada on social media, the radio or an audio platform, while browsing or on a mobile application, and in a local newspaper. The breakdown is as follows:
Notable subgroup differences include the following:
One-quarter (25%) of electors aware of the by-election said they recalled seeing or hearing advertisements from EC in other formats. Figure 8 lists the other formats mentioned by respondents.footnote 2
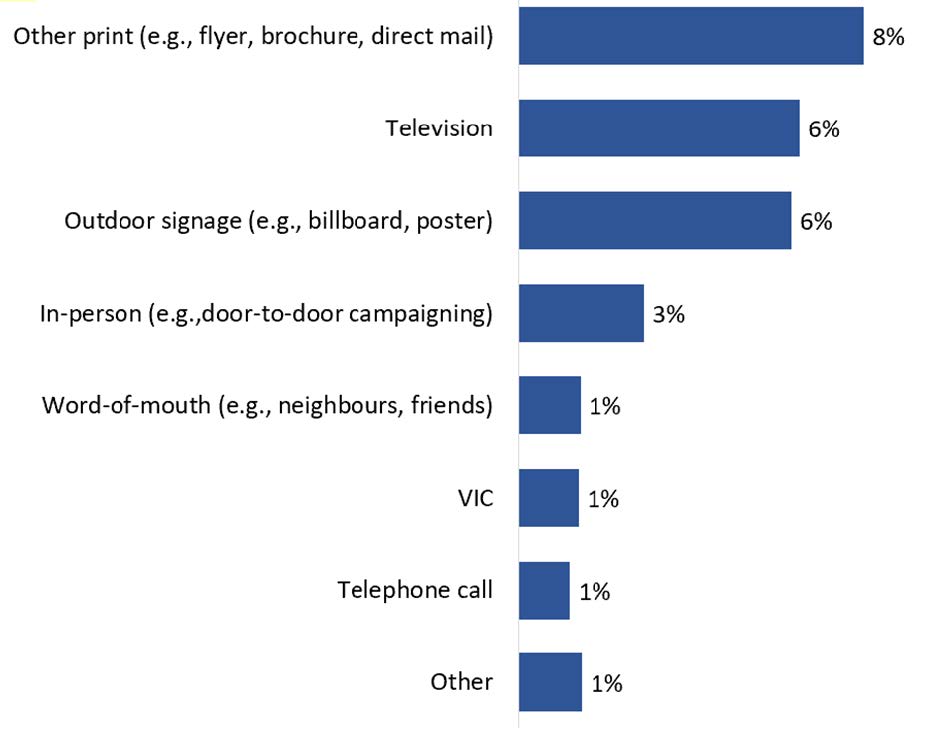
Q21: What other format did you see or hear advertising from Elections Canada about where, when, and how to vote during the by-election campaign? Base: n=389; those aware of the by-election.
The horizontal bar chart shows the percentage of respondents who saw or heard advertising from Elections Canada on other sources. The breakdown is as follows:
More than nine in 10 (95%) electors aware of the by-election felt informed about how, when, and where to vote for the December 12, 2022, federal by-election, with over three-quarters (77%) saying they felt very informed.
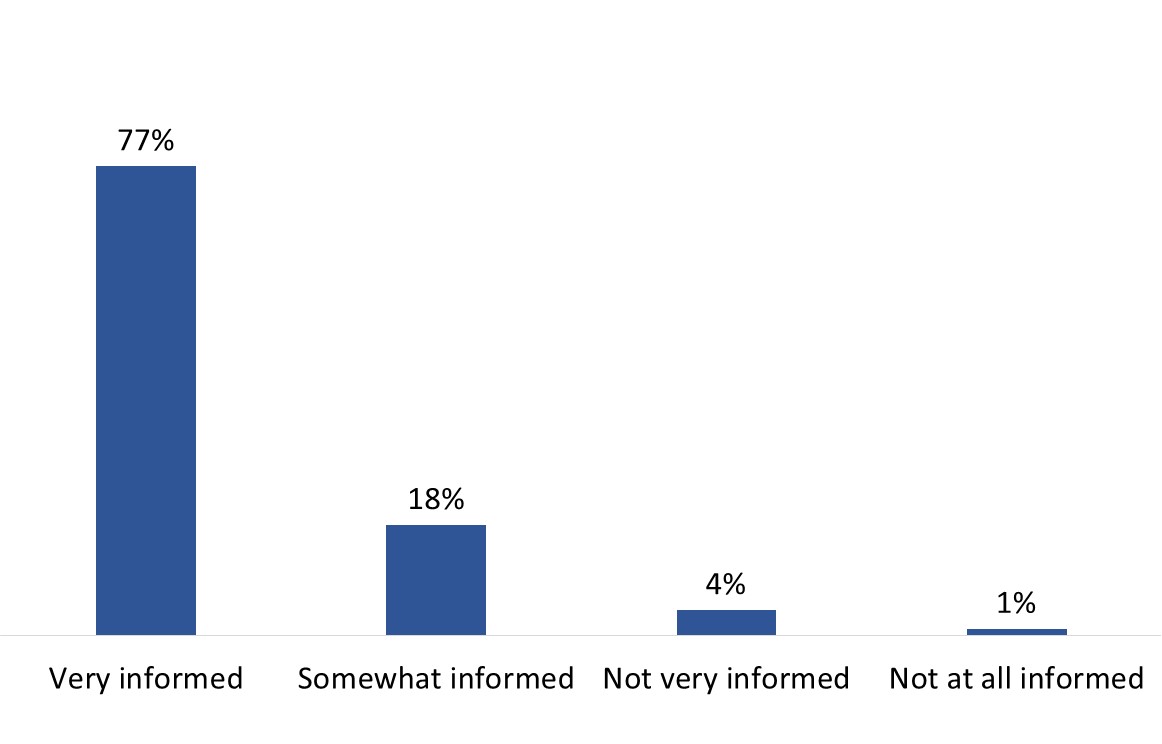
Q15. Overall, how well-informed do you feel you were about when, where, and how to vote in the by-election? Base: n=389; those aware of the by-election.
The vertical bar chart shows how well respondents felt they were informed about how, when, and where to vote. The breakdown is as follows:
Those who voted in the by-election (98%) were more likely to feel informed about the by-election than those who did not vote in it (86%), as were those who received their VIC (97%) compared to those who did not (55%).
In addition, the following respondents were less likely to feel very informed:
Nearly one-quarter of electors aware of the by-election did something to make sure they were registered to vote. Most people who said they took action checked that they were already registered (18%). Following this, much smaller proportions took the action of registering to vote recently (3%) or updating their registration information (2%). In contrast, three-quarters (75%) of electors aware of the by-election did nothing to find out whether they were registered to vote in the federal by-election (most likely because they were already registered to vote).
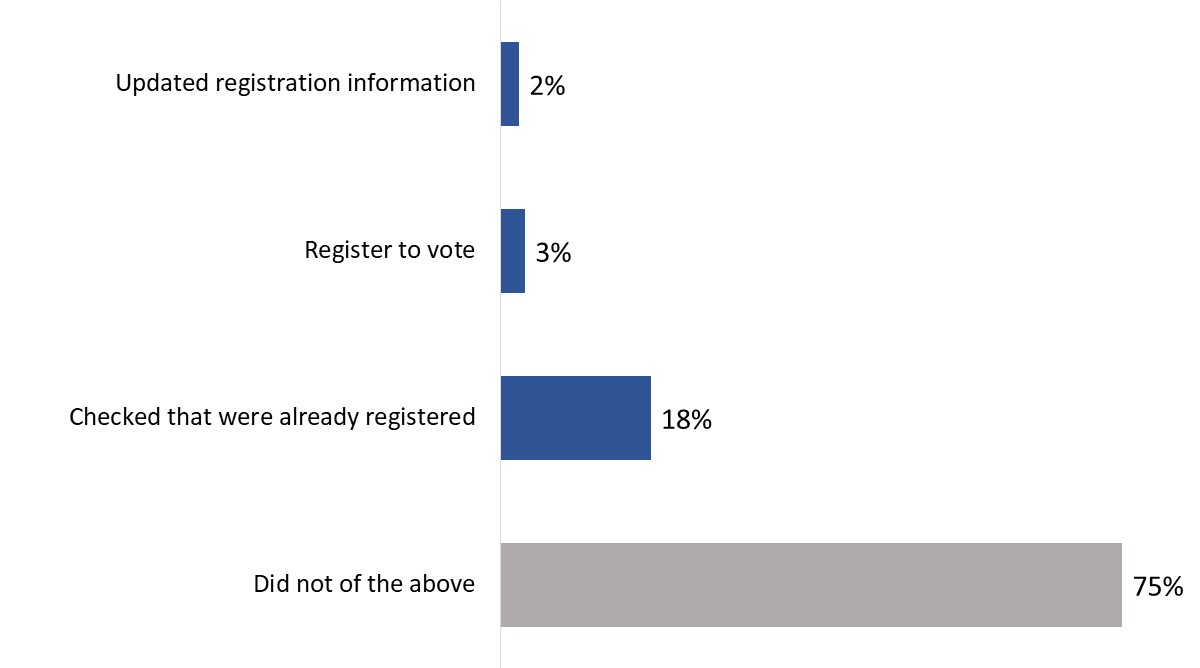
Q26: What, if anything, did you do to make sure you were registered to vote in this federal by-election? Did you...? Base: n=389; those who said they were aware of the by-election. [Dk/nr: 1%]
This horizontal bar chart shows thevarious steps taken by respondents to find out if they were registered to vote. The breakdown is as follows:
The likelihood of saying they did nothing to check if they were registered to vote was lower among 18- to 34-year-olds (61%), compared to electors aged 35 to 54 (81%) and electors 55+ (78%).
Among those who said they checked their registration for the December 12, 2022, federal by-election (n=86), over four in 10 (43%) said they made sure their voter information card was correct. Additionally, nearly one-quarter (23%) said they used Elections Canada's online voter registration system on its website. Following this, 15% said they contacted Elections Canada through their website. Other methods used to check if they were registered were mentioned in much smaller proportions, as illustrated in Figure 11.
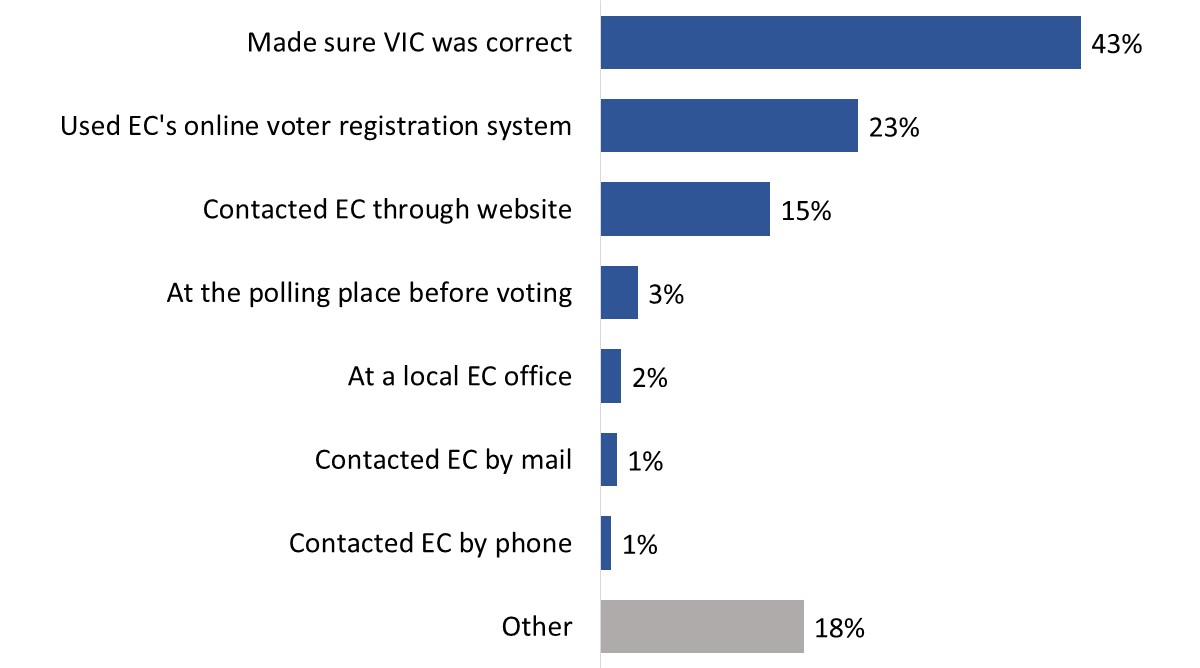
Q27: How did you make sure you were registered? [Multiple responses accepted] Base: n=86; those checked their registration. [Dk/nr: 7%]
This horizontal bar chart shows the percentage of respondents who used each method to find their registration status. The breakdown is as follows:
Three-quarters (74%) of electors who were aware of the by-election held on December 12, 2022, in their riding said they voted in it.
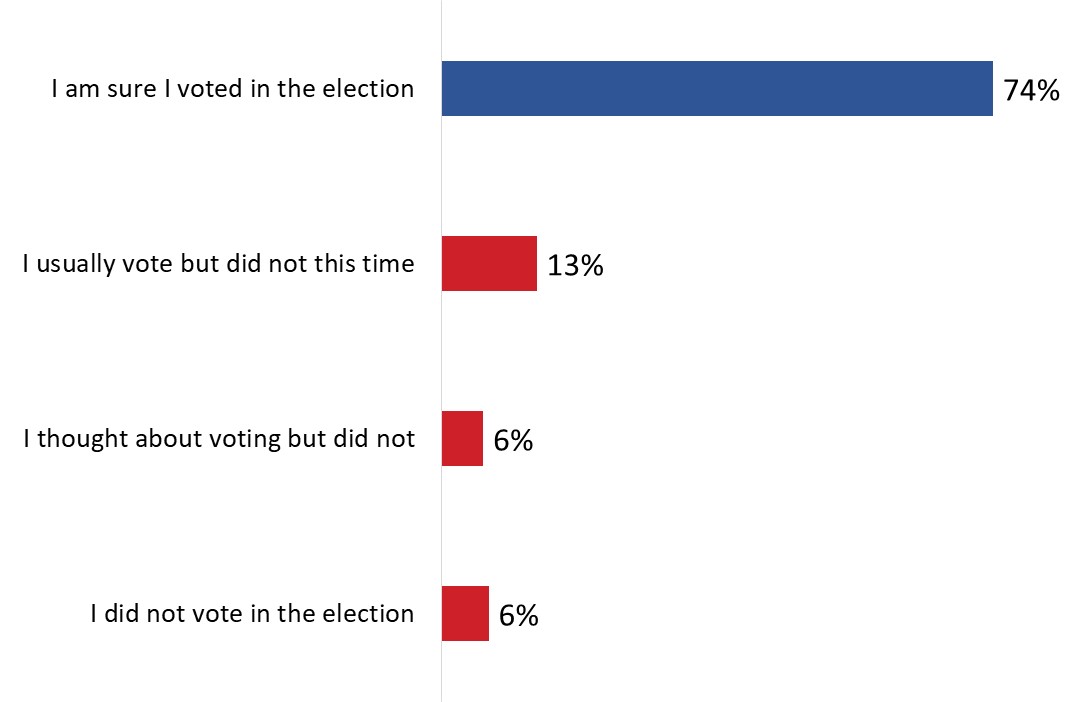
Q28: Many people don't or can't vote for a variety of reasons. Which of the following statements describe you? Base: n=389; those who said they were aware of the by-election. [Dk/nr: 1%]
This horizontal bar chart shows the percentage of respondents who agreed with statements about voting in the by-election. The breakdown is as follows:
Electors less likely to report that they voted include:
Of the respondents who said they did not vote in the by-election (n=84), almost six in 10 (57%) said they did not vote due to everyday life and health reasons. Approximately one-quarter (23%) reported not voting due to political reasons and 6% for reasons related to the electoral process. The "other reasons" category included forgetting to vote and religious or other beliefs, among others.
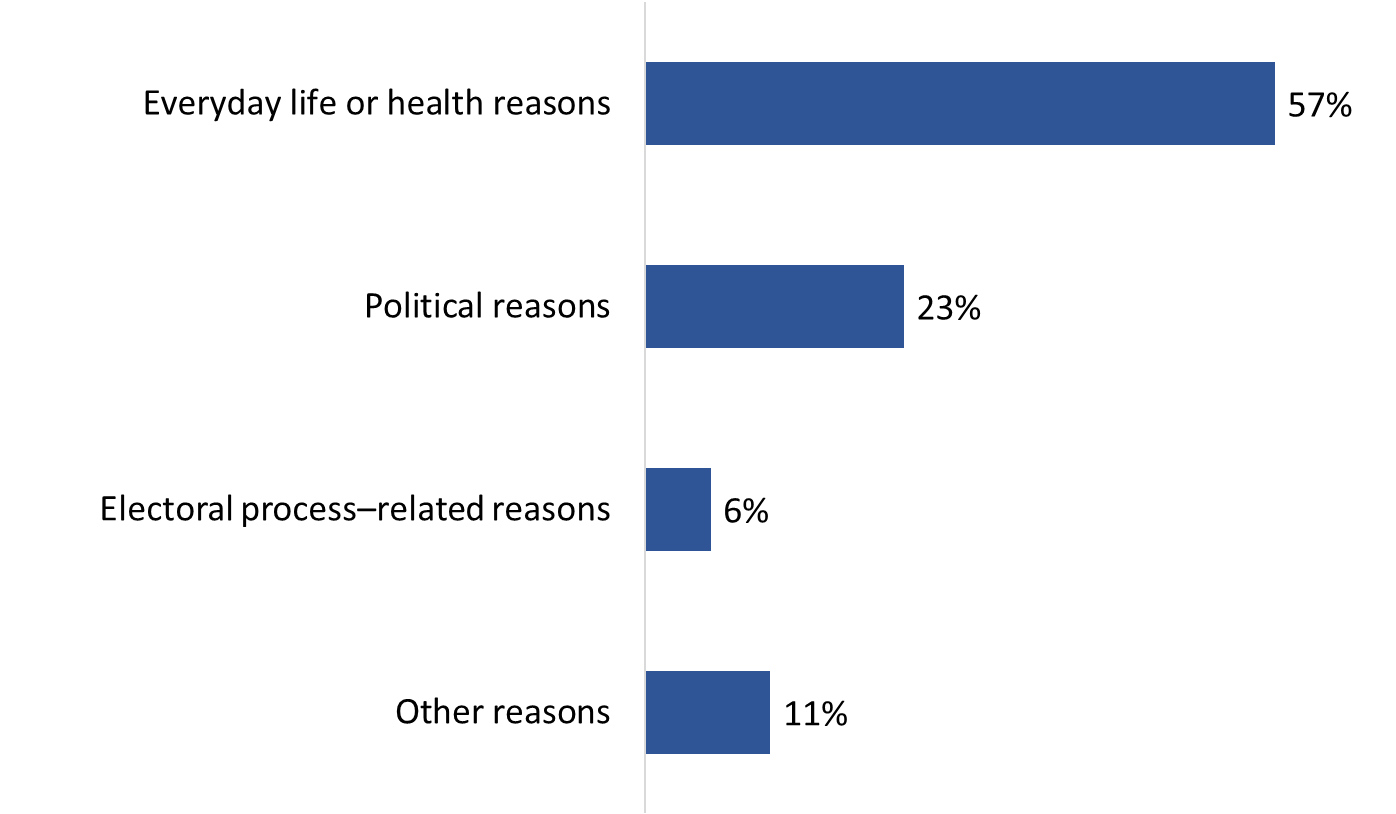
Q29: What is the main reason you did not vote? Base: n=84 respondents who did not vote. [Dk/nr: 3%]
This horizontal bar chart shows the percentage of respondents who selected each reason for not voting in the by-election. The breakdown is as follows:
The table below provides a detailed breakdown of the reasons why surveyed electors did not vote during the December 12, 2022, federal by-election.
| Reasons for not voting | % |
|---|---|
| Everyday life or health reasons | 57% |
| Too busyfootnote 3 | 42% |
| Illness or disability | 11% |
| Out of town | 4% |
| Political reasons | 23% |
| Felt voting would not make a difference | 6% |
| Lack of information about campaign issues and parties' positions | 6% |
| Not interested in politics | 5% |
| Did not like candidates/parties/campaign | 5% |
| Did not know who to vote for | 1% |
| Electoral process–related reasons | 6% |
| Lack of information about voting process (e.g., when/where to vote) | 2% |
| Issues with VIC | 1% |
| Transportation problem/polling station too far | 1% |
| Polling place was not accessible | 1% |
| Other reasons | 11% |
| Forgot to vote | 8% |
| Other reasons | 4% |
[Dk/nr: 3%]
Over half (54%) of electors who said they voted in the by-election reported doing so at a polling station on election day, while nearly four in 10 (39%) reported going to an advance polling station to vote. Very few reported voting at a local Elections Canada office (4%) or by mail (2%).
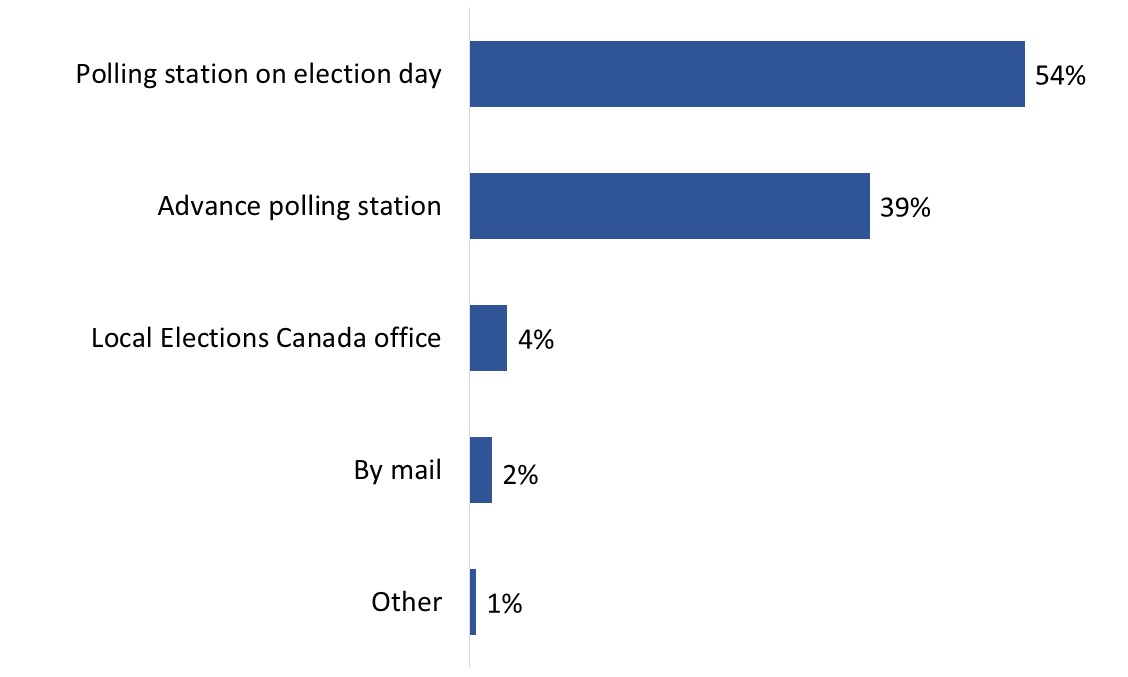
Q33: Which method did you use to vote? Was it... Base: n=301; all respondents who voted.
This horizontal bar chart shows the percentage of respondents who used each method to vote. The breakdown is as follows:
Electors aged 35 to 54 were more likely to have voted on election day (65% versus 50% of those aged 55+), while those aged 55+ were more likely to have voted at advance polls (45% versus 27% of 35- to 54-year-olds).
Three-quarters (74%) of those who said they voted in personfootnote 4 (n=293) reported doing so between noon and 8:30 p.m.
Of the voters who voted on election day (n=163), almost three in 10 (29%) said they went to vote in the afternoon (between noon and 4:00 p.m.) and approximately half (52%) reported voting in the evening (from 4:00 p.m. until the closing of the polls). Fifteen percent reported voting in the morning (from the opening of the polls until noon). The rest (3%) could not recall what time it was when they went to vote.
Nearly two-thirds (64%) of those who voted at an advance polling station (n=120) on December 2, 3, 4, and 5, 2022, reported doing so in the afternoon (between noon and 4:00 p.m.) or the evening (from 4:00 p.m. until the closing of the polls). One-quarter (26%) reported voting in the morning (from the opening of the polls until noon) and the rest (10%) could not recall what time it was when they went to vote.
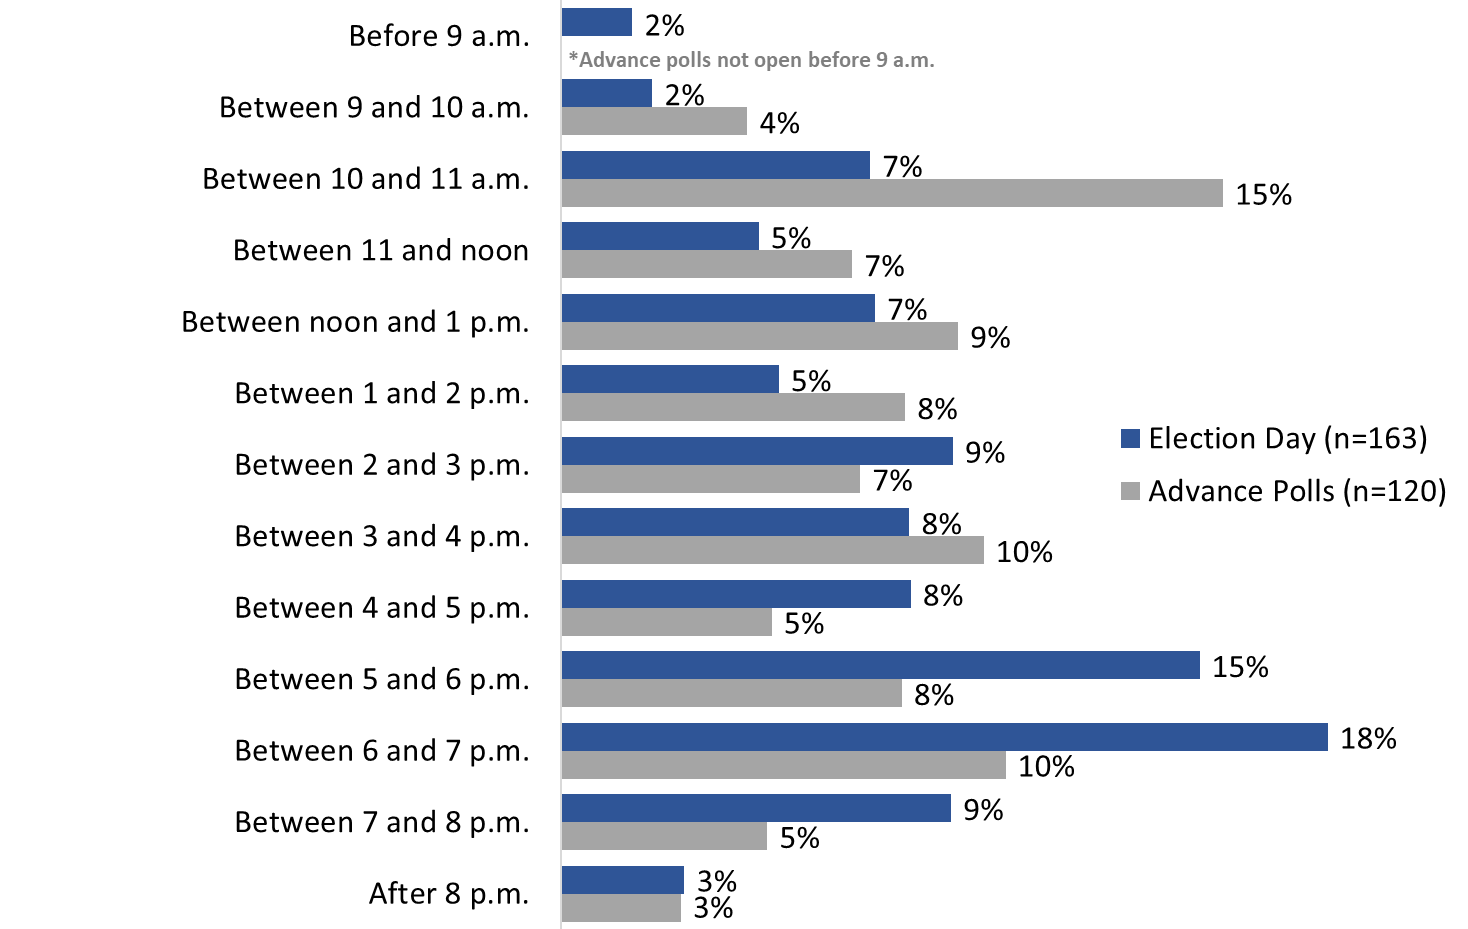
Q34. Do you remember approximately what time it was when you went to vote? Base: respondents who voted on election day, or at an advanced poll. (Election day n=163; advanced polls n=120)
The horizontal bar chart shows the time of day that electors went to vote, comparing those who voted on election day (the blue or top bar) to those who voted at advance polls (the grey or bottom bar). The breakdown is as follows:
Among those who voted in person (n=290)footnote 5, nearly six in 10 (58%) said it took five minutes or less to travel to the polling station, advance polling station, or local Elections Canada office, while three in 10 (30%) said it took between six and 10 minutes. Few reported that it took more than 10 minutes for them to travel to the polling place.
Figure 17 presents reported travel time by voting place: to a polling station on election day or to an advance polling station. Those who voted at a polling station on election day (64%) were more likely than those that voted at an advance polling station (51%) to say it took them five minutes or less to travel to the polling place.
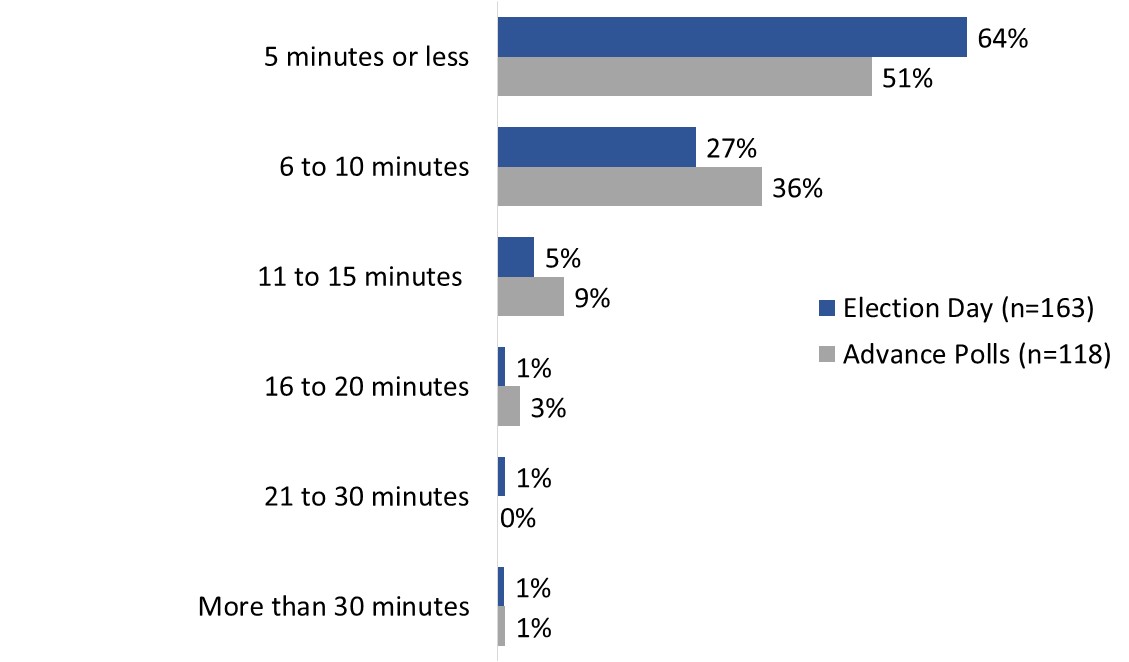
Q35. To the best of your knowledge, how long did it take you to travel to the polling station/advance polling station/local Elections Canada office? Base: respondents who voted at a polling station or advanced polling station and recalled what time of day they went to vote. (Election day n=163; advance polls n=118)
This horizontal bar chart shows how long it took respondents to travel to vote, comparing voting on election day (blue or top bar) to voting at advance polls (grey or bottom bar). The breakdown is as follows:
More than nine in 10 (94%) said the distance to the polling station from their home was reasonable, with 76% saying it was very reasonable.
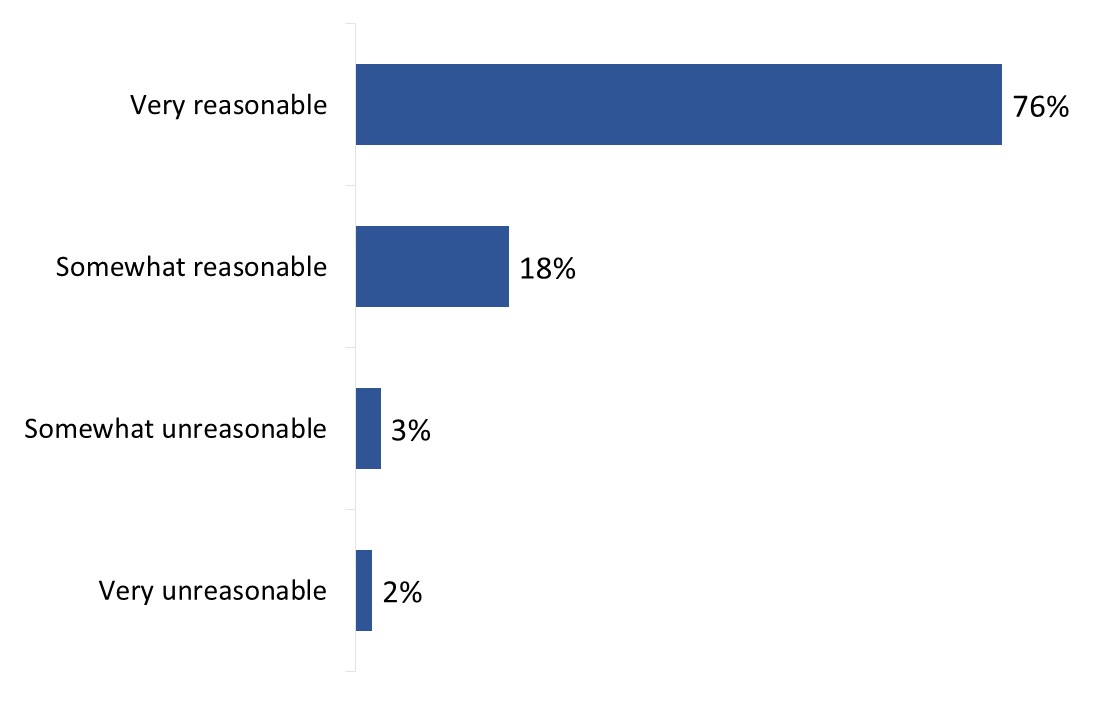
Q36. Was the polling station/advance polling station/local Elections Canada office a very reasonable, somewhat reasonable, somewhat unreasonable, or very unreasonable distance from your home? Base: n=293; respondents who voted at a polling station, advance polling station, or local Elections Canada office. [Dk/nr: 1%]
This horizontal bar chart shows the percentage of respondents who found the travel time to vote at their polling station to be reasonable. The breakdown is as follows:
Over nine in 10 (95%) who voted at a polling station, advance polling station, or local Elections Canada office said the building where they voted was at least somewhat suitable, with three-quarters (73%) saying it was very suitable.
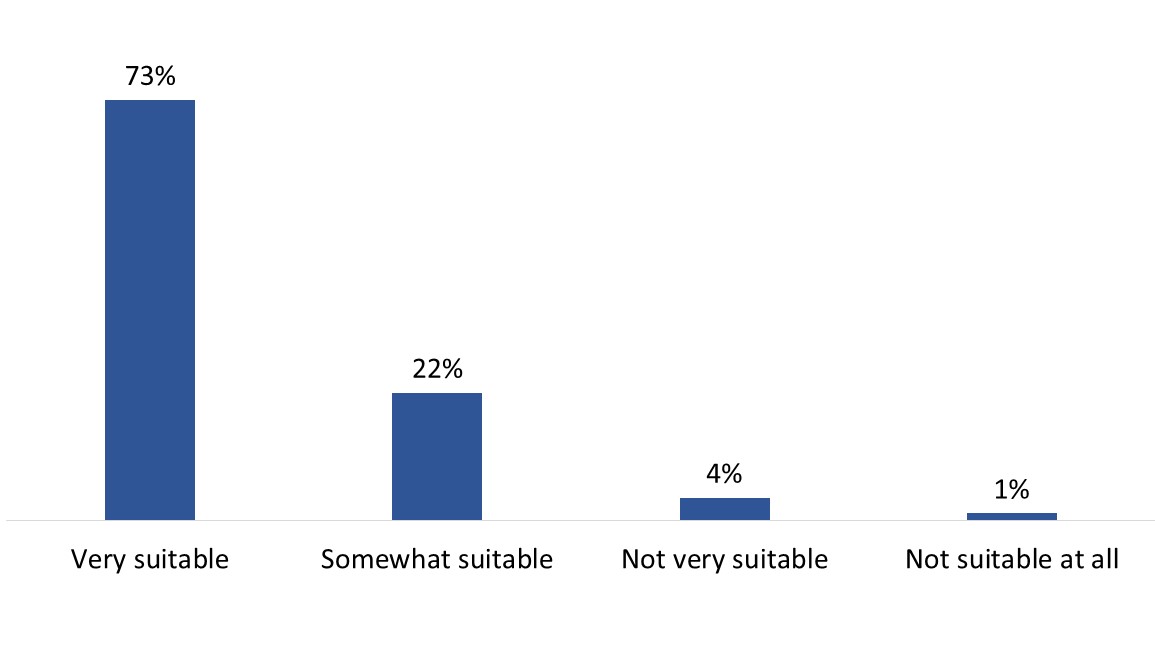
Q39. Would you say that the building where you voted was...? Base: n=293; respondents who voted at a polling station, advance polling station, or local Elections Canada office. [Dk/nr: 2%]
This vertical bar chart shows the percentage of respondents who found the voting facilities suitable. The breakdown is as follows:
Electors with a disability (87%) were less likely than those without a disability (97%) to say the polling station was suitable.
Ninety-three percent of those who voted at a polling station, advance polling station, or local Elections Canada office said the health and safety measures in place for COVID-19 made them feel safe during their visit.footnote 6 Three-quarters (76%) felt very safe with the COVID-19 health and safety measures.

Q40. Thinking about the health and safety measures for COVID-19 that were in place at the polling station/advance polling station/local Elections Canada office, would you say you felt very safe, somewhat safe, somewhat unsafe or very unsafe during your visit? Base: n=293; respondents who voted at a polling station, advance polling station, or local Elections Canada office. [Dk/nr: 2%]
This vertical bar chart shows the percentage of respondents who found the voting facilities safe. The breakdown is as follows:
Of those who felt unsafe (n=14), most attributed this feeling to the fact that not everyone at the facility was wearing a mask.footnote 7 Other reasons included people not respecting physical distancing, having to share objects such as pencils, a perception that there were too many people in the building, and the impression that Elections Canada staff were not respecting health and safety guidelines.
Nearly two-thirds (64%) of those who voted in the by-election said voting took them five minutes or less, with most of the rest saying it took them between six and 15 minutes (31%).
Figure 21 presents the estimated amount of time it took to vote once electors arrived at a polling station on either election day or an advance voting day. Two-thirds (67%) of those who voted at a polling station on election day said it took five minutes or less compared to 61% of those who voted at an advance polling station.
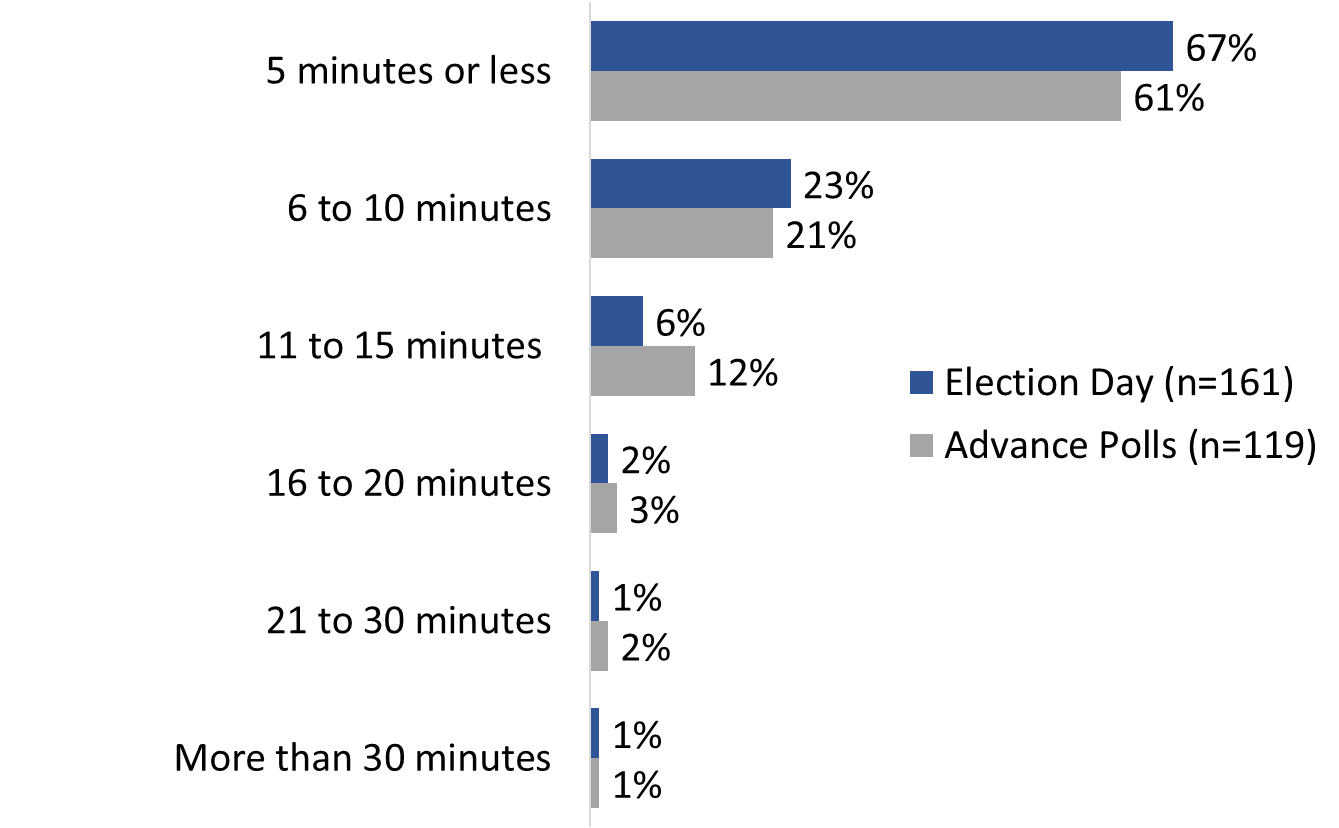
Q42. To the best of your knowledge, how long did it take you to vote once you arrived at the polling station/advance polling station/local Elections Canada office? Base: n=respondents who voted at a polling station or advanced polling station and recalled the experience. (Election day n=161; advance polls n=119)
This horizontal bar chart shows how long it took respondents to vote, comparing election day (blue or top bar) to advance polls (grey or bottom bar). The breakdown is as follows:
A strong majority (96%) of those who voted in person (n=290) said the time it took to vote was reasonable.
Ninety-one percent of electors who voted at an Elections Canada office, advance poll, or polling station on election day said they brought their VIC with them.
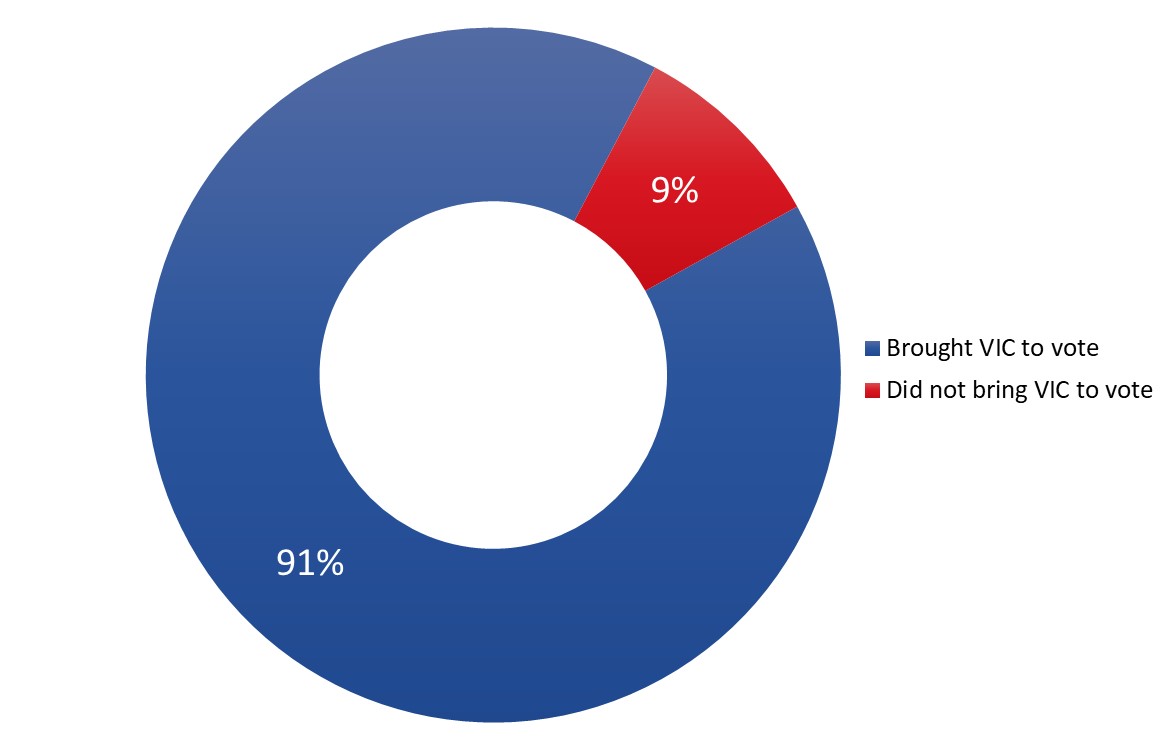
Q44. Did you bring your voter information card with you to the [polling station/advance polling station/local Elections Canada office]? Base: n=285; respondents who got their VIC and voted.
This pie chart shows the percentage of respondents who voted who brought their voter information card, or VIC, to vote. Ninety-one percent brought their VIC. Nine percent did not bring their VIC.
Virtually all (99%) respondents who voted in the by-election found it easy to meet the identification requirements, with 97% describing it as very easy.
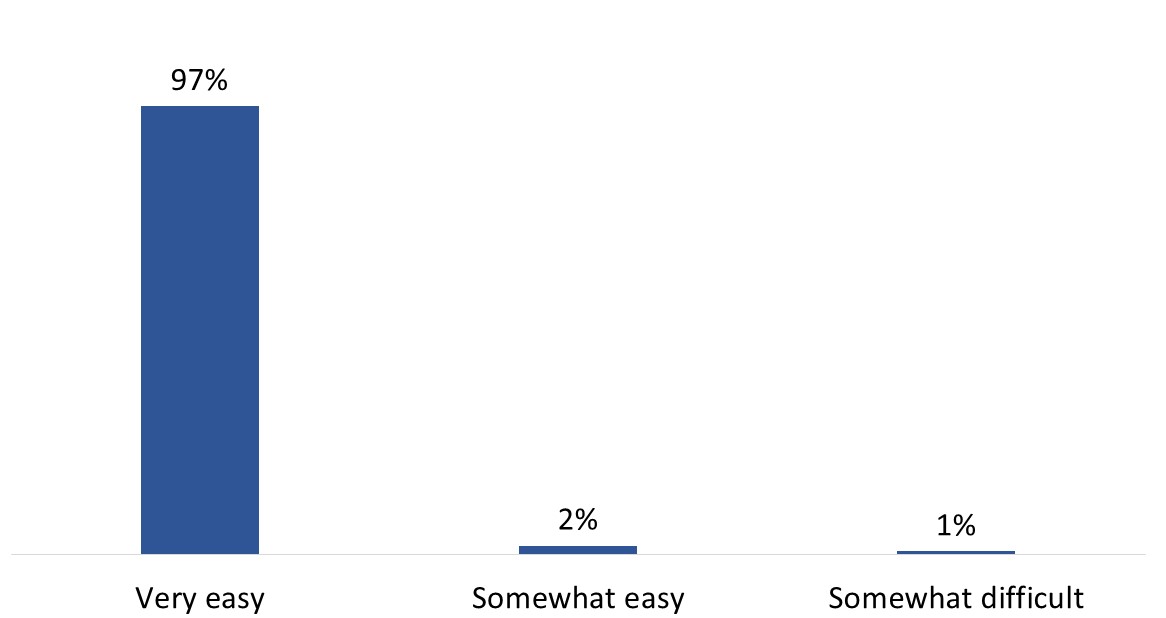
Q45. Overall, was it very easy, somewhat easy, somewhat difficult or very difficult to meet the identification requirements when you voted? Base: n=301; respondents who voted. [Dk/nr: <0.5%]
This vertical bar chart shows how easy respondents said it was for them to meet identification requirements at polling stations. The breakdown is as follows:
There were a total of 40 candidates in the by-election, which required Elections Canada to use a modified large-format ballot paper with two columns of candidate names.
Eighty-four percent of respondents who voted in the by-election said the ballot was at least somewhat easy to complete, with nearly two-thirds (63%) saying it was very easy. Fifteen percent said it was at least somewhat difficult to complete the ballot.

Q48. Thinking about the paper ballot you used to vote in the by-election, was it very easy, somewhat easy, somewhat difficult or very difficult to complete your ballot? Base: n=301; respondents who voted and identified a voting method.
This vertical bar chart shows how easy respondents said it was to use the paper ballot. The breakdown is as follows:
Electors with a disability (73%) were less likely than those without a disability (87%) to say it was easy to complete their ballot.
Among those who found it difficult to complete the ballot (n=46), 95% attributed this to the list of candidates being too long or having difficulty finding their choice of candidate on the list; 19% mentioned the ballot paper being too large to handle or difficult to fold.
Ninety-five percent (95%) of those who said they voted in the by-election found it at least somewhat easy to vote, with over eight in 10 (83%) saying it was easy.
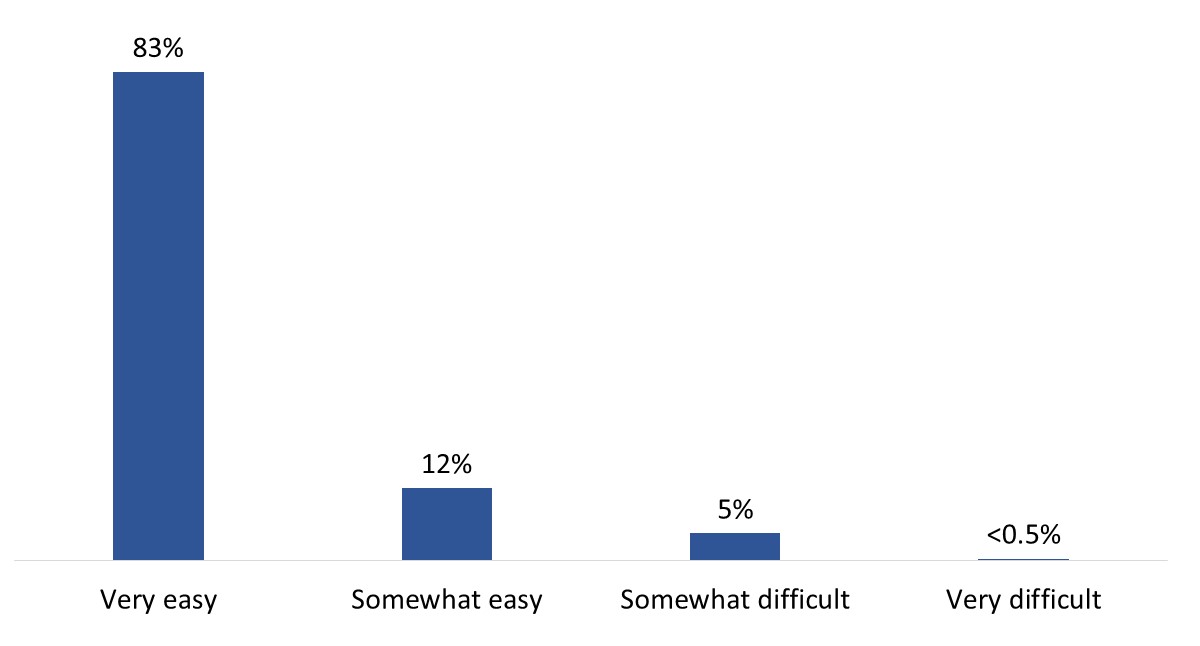
Q50. Overall, was it very easy, somewhat easy, somewhat difficult or very difficult to vote? Base: n=301; respondents who voted and identified a voting method.
This vertical bar chart shows how easy respondents said it was to vote. The breakdown is as follows:
The following subgroups of electors were less likely to say it was very easy to vote:
Virtually all (98%) of those who said they voted in the by-election were at least somewhat satisfied with the services provided by Elections Canada staff, with 86% saying they were very satisfied.
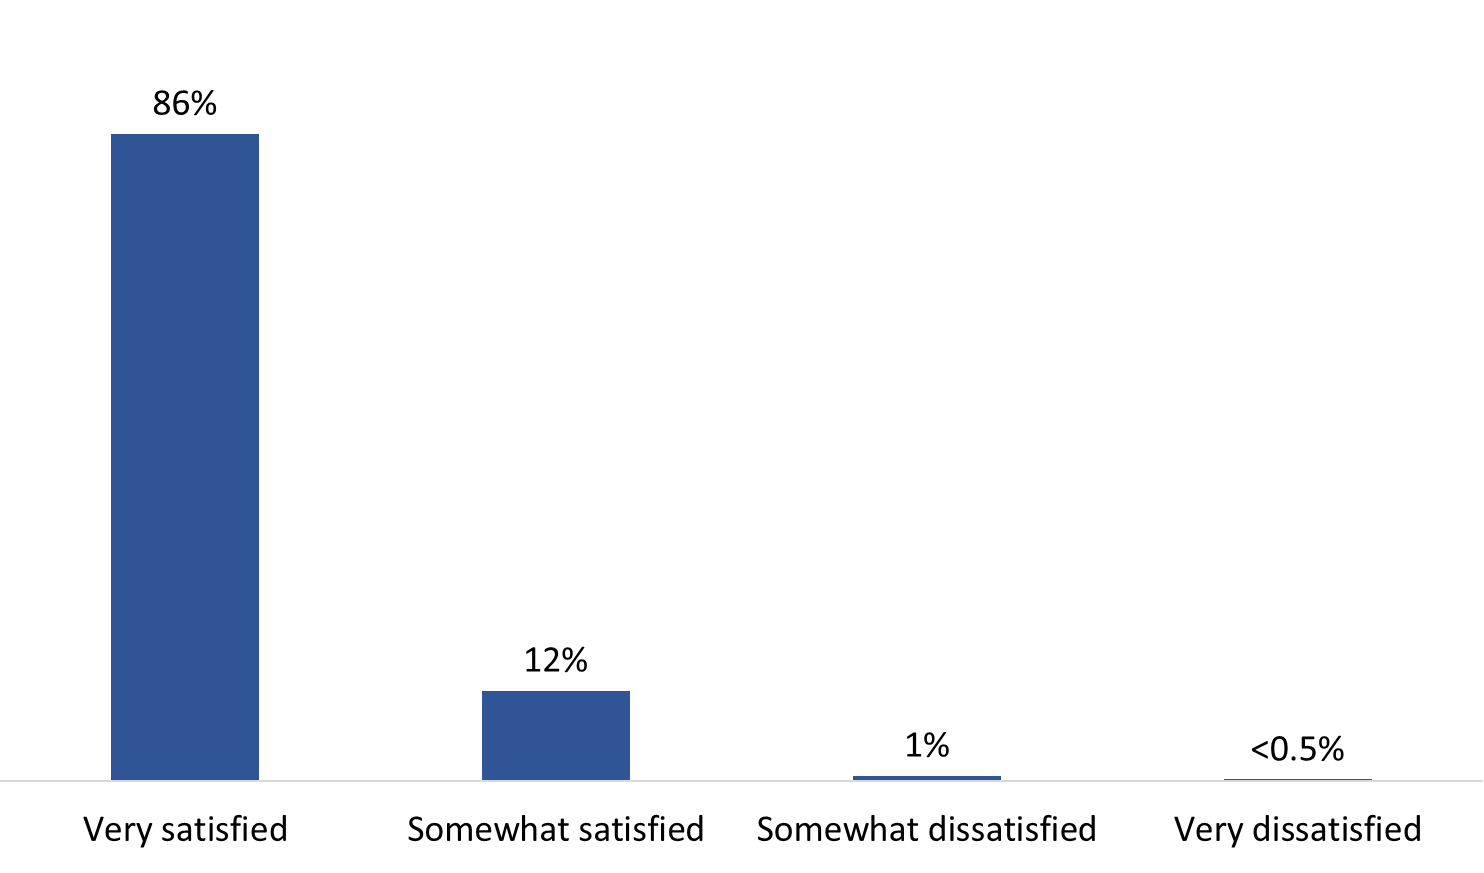
Q46. Overall, were you very satisfied, somewhat satisfied, somewhat dissatisfied or very dissatisfied with the services provided by Elections Canada staff when you voted? Base: n=293; respondents who voted in person.
The vertical bar chart shows the level of satisfaction with Elections Canada staff among those who voted. The breakdown is as follows:
Over nine in 10 (95%) respondents who said they voted in the by-election were at least somewhat satisfied with their overall voting experience, with 79% saying they were very satisfied.
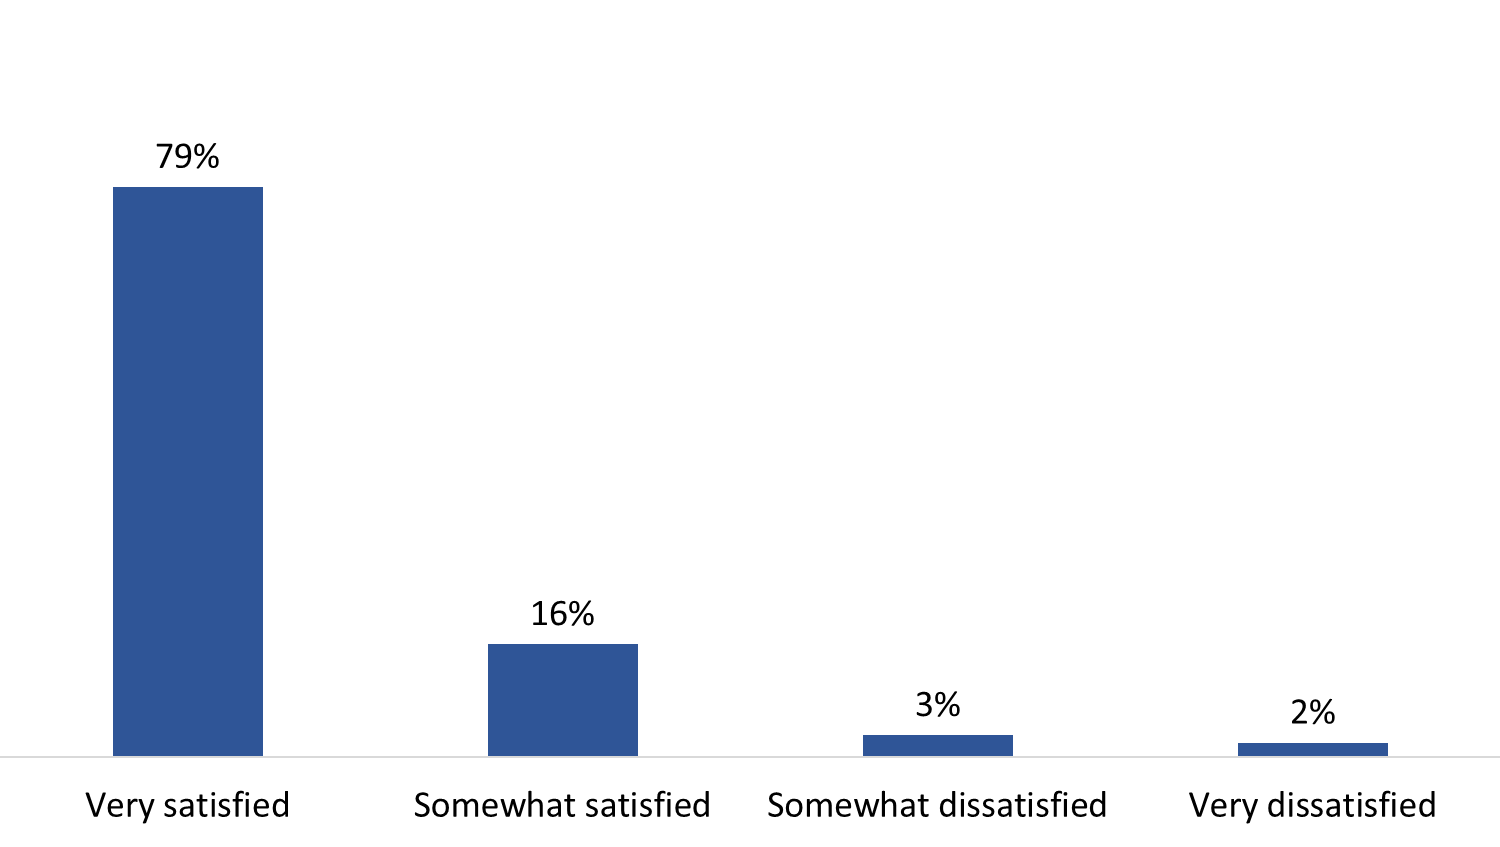
Q51. Overall, how satisfied were you with your voting experience? Would you say that you were...? Base: n=301; all respondents who voted. [Dk/nr: <1%]
This vertical bar chart shows voters' level of satisfaction with their voting experience. The breakdown is as follows:
Those who voted at an advance polling station (85%) were more likely than those who voted on election day (74%) to say they were very satisfied with their voting experience.
Eight in 10 electors (80%) surveyed thought that Elections Canada ran the December 12, 2022, by-election at least somewhat fairly, with 68% saying very fairly.
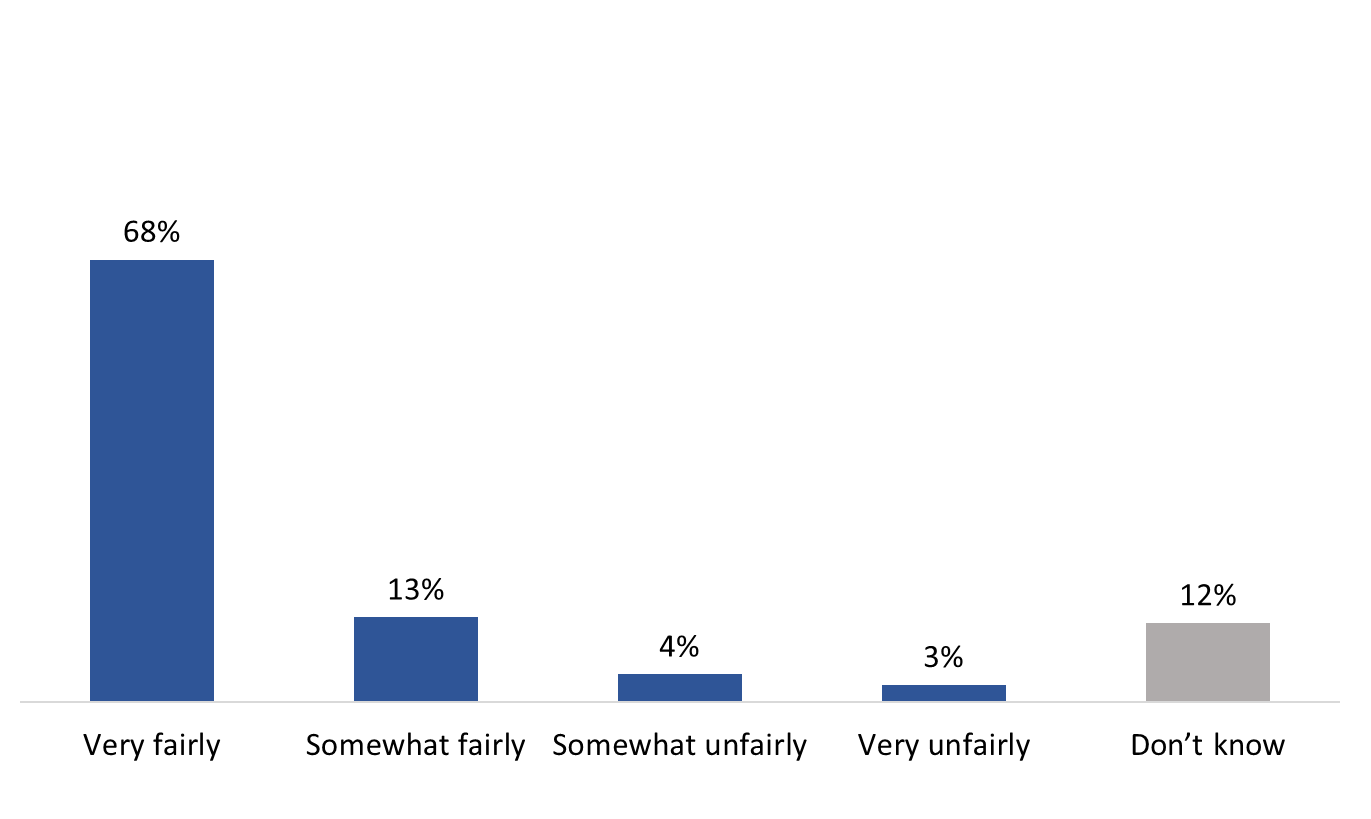
Q52. Thinking about the December 12 federal by-election, would you say that Elections Canada ran the election...? Base: n=400; all respondents. Prefer not to answer: less than 1 percent.
The vertical bar chart shows respondents' perceptions of Elections Canada's fairness in running the by-election. The breakdown is as follows:
Electors under 55 years of age (57% of 18- to 34-year-olds and 59% of 35- to 54-year-olds compared to 79% of electors 55+) and those who did not vote in the by-election (41% compared to 79% of voters) were less likely to say Elections Canada ran the by-election very fairly.
Those who felt that Elections Canada ran the election somewhat or very unfairly (n=24) were asked if there is a specific reason for this opinion. Concerns about the electoral process itself were commonly mentioned, which included the following perceptions: a lack of information about the by-election and where to vote, the election period was too short, a lack of polling stations, and concerns about the number of candidates. Other reasons mentioned more than once included general concerns about media bias and/or lack of trust in elections or the electoral system.
Nine in 10 respondents (90%) trusted the accuracy of the election results, with two-thirds (67%) expressing a very high level of trust. A very small proportion of respondents (6%) had low trust in the accuracy of the results, while 3% said they did not know.
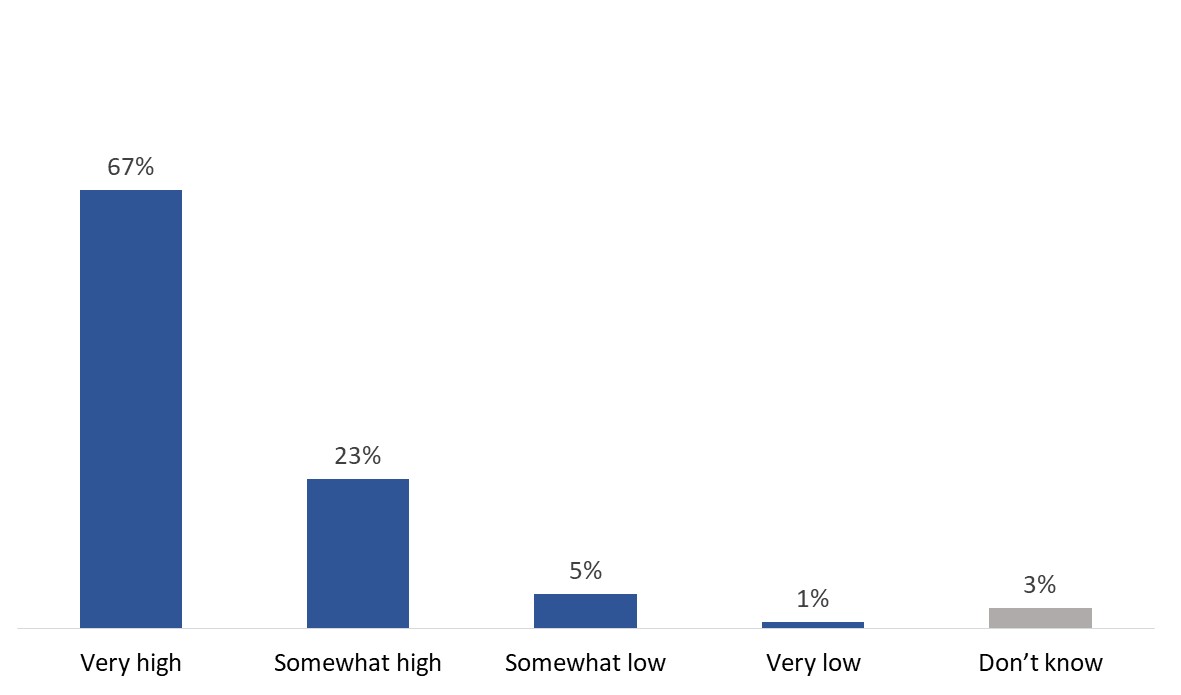
Q54. What level of trust do you have in the accuracy of the election results in your riding? Is it...? Base: n=400; all respondents.
This vertical bar chart shows respondents' level of trust in the accuracy of the election results in their riding. The breakdown is as follows:
The following electors were less likely to have a very high level of trust in the accuracy of the election results:
Those who indicated that they have low trust in the accuracy of the election results (n=24) were asked if there was a specific reason for their low trust. For the most part, respondents tended to mention that the outcome of the by-election was not what they expected or a general lack of trust in the government, politicians and/or civil servants. A handful of reasons related to the electoral process tended to mention doubts about ballots being marked using pencils or the accuracy of ballots being counted by hand instead of by machine.
Return to footnote 1It is currently not possible to vote online, through the telephone, by computer or electronically in a federal election.
Return to footnote 2EC does not run ads on television or use telephone calls or in-person campaigning to advertise by-elections. In addition, a portion of the responses in the "other print" and "outdoor signage" categories may represent advertising from non-EC sources, such as candidates.
Return to footnote 3Of the respondents who were too busy to vote (n=23*), more than half (57%) said they had other priorities that day. Smaller proportions said that something came up and made them change their plans (18%) or that they do not have time in their daily schedule to vote (17%). *Exercise caution interpreting these findings due to the small sample size.
Return to footnote 4This includes voting at a polling station on election day, at an advance polling station, or at a local Elections Canada office.
Return to footnote 5This includes voting at a polling station on Election Day, at an advance polling station, or at a local Elections Canada office.
Return to footnote 6This by-election was held at a time when COVID-19 health and safety measures were in place, including poll workers wearing masks, plexiglass barriers, hand sanitizer stations, and physical distancing markers.
Return to footnote 7Elections Canada recommended that electors follow local public health measures, but masking in the polling place was not mandatory.