Section V: Spending and human resources—2017 to 2018 Departmental Plan
Document navigation for "2017 to 2018 Departmental Plan"
This section presents an overview of Public Services and Procurement Canada's (PSPC) planned spending and human resources for the next three consecutive fiscal years, starting with 2017 to 2018. Planned spending is also compared with the current and previous years' actual spending.
Planned spending
Departmental spending trend graph
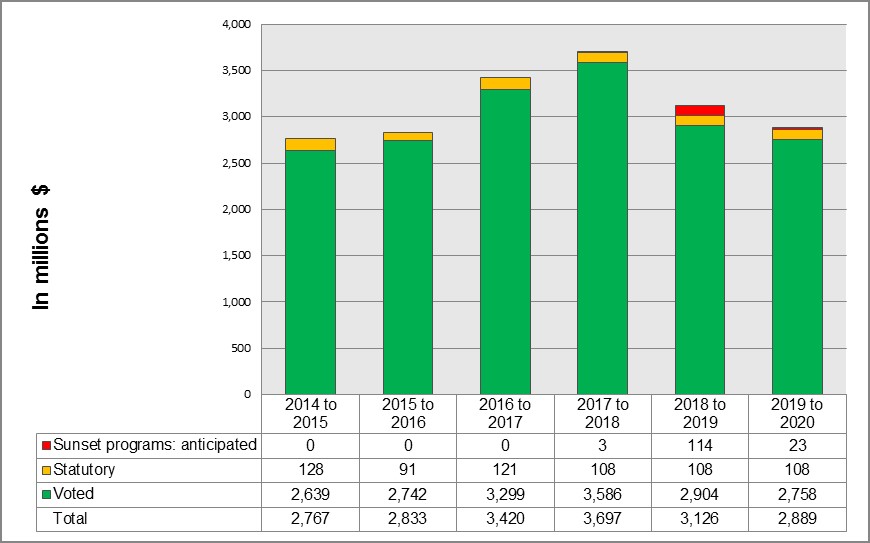
Text version
This bar graph illustrates the spending trend for Public Services and Procurement Canada for fiscal years 2014 to 2015, 2015 to 2016, 2016 to 2017, 2017 to 2018, 2018 to 2019 and 2019 to 2020. Financial figures are presented in millions of dollars along the y-axis (vertical), starting at $0, ending at $4 billion and increasing by $500 million. These are graphed against fiscal years 2014 to 2015 to 2019 to 2020 on the x-axis (horizontal).
There are three items identified for each fiscal year: anticipated sunset programs, statutory spending and voted spending.
In 2014 to 2015, actual spending was $0 for anticipated sunset programs, $128 million for statutory items and $2,639 million for voted items.
In 2015 to 2016, actual spending was $0 for anticipated sunset programs, $91 million for statutory items and $2,742 million for voted items.
In 2016 to 2017, forecast spending is $0 for anticipated sunset programs, $121 million for statutory items and $3,299 for voted items.
In 2017 to 2018, planned spending is $3 million for anticipated sunset programs, $108 million for statutory items and $3,586 million for voted items.
In 2018 to 2019, planned spending is $114 million for anticipated sunset programs, $108 million for statutory items and $2,904 million for voted items.
In 2019 to 2020, planned spending is $23 million for anticipated sunset programs, $108 million for statutory items and $2,758 for voted items.
Total spending for 2014 to 2015 was $2,767 million; for 2015 to 2016 was $2,833 million; and the total forecast spending for 2016 to 2017 is $3,420 million. The total planned spending for 2017 to 2018 is $3,697 million; for 2018 to 2019 is $3,126 million; and for 2019 to 2020 is $2,889 million.
Narrative: Departmental spending trend graph
The departmental spending trend graph presents trends in the department's planned and actual spending over time. The data represents actual spending for fiscal year 2014 to 2015 to fiscal year 2015 to 2016, forecast spending for fiscal year 2016 to 2017 and planned spending for fiscal year 2017 to 2018 to fiscal year 2019 to 2020. The data is broken down between sunset programs: anticipated, statutory and voted expenditures to demonstrate the impact of the anticipated renewal of sunset funding over the three-year planning period.
The variances to the sunset programs shown in the graph above are the result of:
- $2.8 million for the Cost and Profit Assurance Program to be completed in 2016 to 2017
- $114.1 million for the following projects and initiatives to be completed in 2017 to 2018:
- federal infrastructure initiative
- the initial funding period of the Build in Canada Innovation Program
- $22.6 million for the following projects and initiatives to be completed in 2018 to 2019:
- Carling campus
- surplus federal real property homelessness initiative
Totals may not add up due to rounding.
| Programs and internal services | 2014 to 2015 expenditures | 2015 to 2016 expenditures | 2016 to 2017 forecast spending | 2017 to 2018 Main Estimates | 2017 to 2018 planned spending | 2018 to 2019 planned spending | 2019 to 2020 planned spending |
|---|---|---|---|---|---|---|---|
| Acquisitions | 144,689,521 | 151,557,532 | 150,910,497 | 153,731,765 | 153,731,765 | 114,121,744 | 114,337,355 |
| Accommodation management and real property services | 2,032,720,121 | 2,112,305,111 | 2,597,779,524 | 2,994,281,729 | 2,994,281,729 | 2,380,190,423 | 2,234,497,300 |
| Receiver General for Canada | 116,448,841 | 109,908,581 | 122,831,240 | 128,471,892 | 128,471,892 | 106,537,458 | 106,521,313 |
| Integrity programs and services | 22,035,911 | 20,273,364 | 21,475,704 | 18,651,926 | 18,651,926 | 15,189,099 | 15,189,099 |
| Federal pay and pension administration | 115,698,499 | 128,954,893 | 156,729,638 | 80,895,164 | 80,895,164 | 77,426,283 | 77,514,154 |
| Linguistic management and services | 57,727,343 | 51,299,267 | 67,167,738 | 64,762,500 | 64,762,500 | 65,106,226 | 64,033,141 |
| Specialized programs and services | 47,133,036 | 24,537,710 | 33,048,888 | 27,562,369 | 27,562,369 | 27,700,366 | 27,769,860 |
| Procurement Ombudsman | 3,889,948 | 3,830,009 | 4,172,565 | 4,080,925 | 4,080,925 | 4,080,925 | 4,080,925 |
| Subtotal | 2,540,343,220 | 2,602,666,467 | 3,154,115,793 | 3,472,438,270 | 3,472,438,270 | 2,790,352,524 | 2,643,943,147 |
| Internal services subtotal | 226,820,291 | 230,649,243 | 265,672,681 | 221,643,915 | 221,643,915 | 221,602,215 | 221,611,043 |
| Total | 2,767,163,511 | 2,833,315,710 | 3,419,788,474 | 3,694,082,185 | 3,694,082,185 | 3,011,954,739 | 2,865,554,190 |
Narrative: Budgetary planning summary for programs and internal services
As part of the Departmental Plan, PSPC is informing Canadians on how the department expects to effectively deliver on its programs and services in order to fulfill the government's priorities.
The variances observed over the planning period are explained as follows:
- the increase of $652.6 million from the 2014 to 2015 expenditures to the 2016 to 2017 forecast spending is primarily the result of:
- higher expenditures for the recapitalization of major assets and the repair, maintenance and operation of federal buildings
- the variance of $274.3 million between the 2016 to 2017 forecast spending and the 2017 to 2018 main estimates is primarily caused by:
- higher expenditures for the repair, maintenance and operation of federal buildings to provide a safe and secure workplace
- increase in the rehabilitation of major assets, to reduce risks related to health and safety and to ensure long-term stewardship of these assets
- the decrease of $828.5 million between the 2017 to 2018 main estimates and the 2019 to 2020 planned spending is primarily related to:
- the end of the federal infrastructure initiative (Budget 2016) for the rehabilitation of major assets to reduce health and safety risks as well as the end of the incremental funding for the repair, maintenance and operation of federal buildings to provide a safe, healthy and secure workplace
- the completion of major projects, which are part of the parliamentary precinct rehabilitation, such as the West block and the government conference centre in 2018
- the end of the initial funding period of the Build in Canada Innovation Program
| Programs and internal services | 2014 to 2015 FTEs | 2015 to 2016 FTEs | 2016 to 2017 forecast FTEs | 2017 to 2018 planned FTEs | 2018 to 2019 planned FTEs | 2019 to 2020 planned FTEs |
|---|---|---|---|---|---|---|
| Acquisitions | 1,694 | 1,712.34 | 1,491.05 | 1,551 | 1,542 | 1,542 |
| Accommodation management and real property services | 3,409.8 | 3,410.4 | 3,577.04 | 3,509.28 | 3,100.44 | 3,040.44 |
| Receiver General for Canada | 328 | 319 | 289.04 | 307 | 307 | 307 |
| Integrity programs and services | 363.58 | 354 | 368.40 | 398 | 382 | 382 |
| Federal pay and pension administration | 1,607 | 1,773 | 1,559.08 | 2,022 | 2,022 | 2,022 |
| Linguistic management and services | 1,263.77 | 1,197 | 1,124.65 | 1,114.85 | to be determinedFootnote 1 | to be determinedFootnote 1 |
| Specialized programs and services | 481 | 479.65 | 572.91 | 609 | 620 | 622 |
| Procurement Ombudsman | 25.02 | 25.14 | 26.50 | 23.03 | 23.03 | 23.03 |
| Subtotal | 9,172.17 | 9,270.53 | 9,008.67 | 9,534.16 | to be determinedFootnote 2 | to be determinedFootnote 2 |
| Internal services subtotal | 2,469.33 | 2,474.62 | 2,700.4 | 2,801.63 | 2,810.43 | 2,811.83 |
| Total | 11,641.5 | 11,745.15 | 11,709.07 | 12,335.79 | to be determinedFootnote 2 | to be determinedFootnote 2 |
Narrative: Planned human resources (full-time equivalents)
The variation in PSPC's planned FTEs is mainly due to:
- increased numbers of FTEs in the following programs:
- 1.4 Integrity programs and services: due to the implementation of a professional development plan
- 1.7 Specialized programs and services: mainly due to growth to meet the needs of new back office services
- 1.9 Internal services: due to the need for additional resources to deliver on new service lines due to additional elements found in the Treasury Board Secretariat (TBS) Standard on Security Screening
- offset by decreased numbers of FTEs in the following programs:
- 1.1 Acquisitions: due to the end of the initial five-year period of the Build in Canada Innovation Program
- PSPC is working with central agencies to identify a source of funds for future years
- 1.2 Accommodations management and real property services: due to projects related to the federal infrastructure initiatives coming to completion
- 1.1 Acquisitions: due to the end of the initial five-year period of the Build in Canada Innovation Program
Estimates by vote
For information on PSPC's organizational appropriations, consult the 2017 to 2018 main estimates.
Future-oriented condensed statement of operations
The future-oriented condensed statement of operations provides a general overview of Public Services and Procurement Canada's operations. The forecast of financial information on expenses and revenues is prepared on an accrual accounting basis to strengthen accountability and to improve transparency and financial management.
Because the future-oriented condensed statement of operations is prepared on an accrual accounting basis, and the forecast and planned spending amounts presented in other sections of the Departmental Plan are prepared on an expenditure basis, amounts may differ.
A more detailed future-oriented statement of operations and associated notes, including a reconciliation of the net costs of operations to the requested authorities, are available in the 2017 to 2018 Consolidated Future-Oriented Statement of Operations.
| Financial information | 2016 to 2017 forecast results | 2017 to 2018 planned results | Difference (2017 to 2018 planned results minus 2016 to 2017 forecast results) |
|---|---|---|---|
| Total expenses | 6,327,748,406 | 6,667,425,130 | 339,676,724 |
| Total revenues | 3,143,312,487 | 3,163,492,698 | 20,180,211 |
| Net cost of operations before government funding and transfers | 3,184,435,919 | 3,503,932,432 | 319,496,513 |
Narrative: Future-oriented condensed statement of operations for the year ended March 31, 2018
The net cost of operations is forecasted to increase by $319.5 million in 2017 to 2018 to $3,503.9 million which is mainly the result of the forecasted increase in total expenses in 2017 to 2018, when compared to 2016 to 2017. This increase is mainly attributed to:
- repair, maintenance and operating costs of federal buildings to provide a safe, healthy, and secure workplace
- rehabilitation of major public infrastructures, to reduce risks related to health and safety, and to ensure long-term stewardship of these assets
Document navigation for "2017 to 2018 Departmental Plan"
- Date modified: