|
[Abstract] [Full Text] [PDF]
Direct determination of unbound lipophilic ligands in aqueous solutions Inge N. Bojesen1* 1 Department of Medical Biochemistry and Genetics, Lab. B., University of Copenhagen, The Panum Institute. Blegdamsvej 3, DK-2200 Copenhagen N. Denmark. Biol. Proced. Online 2004;6:226-234. doi:10.1251/bpo93 Indexing terms: Erythrocyte membrane; Ligands; Binding sites. |
Due to their hydrophobic nature, lipophilic compounds are always bound to proteins when transported in the organism. The transfer of such compounds between their binding proteins and cells as well as intracellular trafficking is mediated by a very low water-phase concentration of monomers. The use of protein filled resealed red cell membranes (erythrocyte ghosts) as semipermeable bags enables us to determine directly such water-phase concentrations in a biological system where the lipophilic compound is in equilibrium with the compound bound to its binding protein. Equilibrium dissociation constants (Kd’s) and number of binding sites are determined by regression analyses of data. We describe the method with the hydrophobic anion arachidonate and the neutral N-arachidonoylethanolamide as examples.
Many biological active compounds are lipophilic. Their interaction with their binding proteins have attracted much interest because of the demonstration of the physiological importance of the small quantity of such ligands in blood plasma and other body fluids. In binding studies as well as in transport studies a crucial parameter is the concentration of unbound ligand, which is very low and consequently difficult to measure. It is important to realize that the limited solubility in aqueous solutions of such compounds prohibits the use of solutions lacking binding proteins for the experiments. Such investigations suffer from the problem of aggregation and adsorption phenomenon. Often the lipophilic ligands are added to aqueous solutions dissolved in ethanol, but in such cases nothing is known about the monomer concentration and it is likely to exceed the physiological concentration. Meaningless results may be obtained and at best pharmacological effects are investigated rather than physiological effects. Fatty acids were some of the first poorly water-soluble compounds to be studied (1-14). The first information on water-phase concentrations of these lipophilic anions appeared in the fifties (1, 2). The concentrations were estimated by the classical heptane-water phase partition method. However this method suffers from great technical difficulties due to unpredictable dimerization and/or formation of higher aggregates in the two phases, which resulted in erroneously high concentrations (3, 4). The use of alternative methods such as dialysis did not solve the problem because of the slow diffusion of the ligand to solutions without protein (5-7). This is independent of the choice of membrane. In the following years we succeeded in revising the original measurements by the use of the method presented here which involves erythrocyte ghosts (8-10). In general, the water-phase concentrations we have obtained are more than an order of magnitude lower, for the highly hydrophobic oleic acid up to 40 times, than the previous measurements. Later, equally low concentrations have been found in two other studies (11-13). In these studies “reporter-proteins” are used as spectrofluorometric probes for measurement of fatty acid concentrations in aqueous solutions. In a third study (14) all the difficulties of the classical phase partition method is discussed and it is suggested that concentration values in the low range may also be obtainable by this method. Overall there is presently agreement that the aqueous concentrations of fatty acids lie in the nanomolar range. Reliable determinations of monomer ligand concentrations are a prerequisite for the determinations of the number and affinity of the binding sites usually expressed as Ka. Previously, we have used the method described here to find the number of binding sites on BSA and Ka for five different long-chain fatty acids (15) and for the cannabinoid N-arachidonoylethanolamide (anandamide) (16) and the method has been used by others to study the palmitate-albumin interaction (17). In the present paper we have addressed the albumin binding of the polyunsaturated hydrophobic anion arachidonate and of the neutral anandamide. The first compound constitutes only a small part of the total acids in plasma but it is an important precursor of a series of biological active compounds. Anandamide is an important endocannabinoid with a key vasodilator role in hypotension associated with hemorrhagic, endotoxic and cardiogenic shock (18).
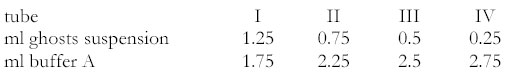
The labelled hydrophobic ligand must have a high degree of purity, since the method is especially sensitive to water-soluble impurities. [(5,6,8,9,11,12,14,15)-3H] arachidonic acid, specific activity 209 Ci mmol-1 and [(5,6,8,9,11,12,14,15)-3H] N-arachidonoylethanolamine, specific activity 215 Ci mmol-1 were obtained from NEN Life Science. A high specific activity of the radioactive hydrophobic ligands is required for the measurement of the very low water-phase concentrations. Unlabelled arachidonic acid and N-arachidonoylethanolamine were from Sigma and BIOMOL respectively. Bovine serum albumin (BSA) fraction V (fatty acid free) was from Boehringer Mannheim GmbH, Germany. Glass beads (diameter 106 μm) from Sigma were washed with chromosulfuric acid, washed with distilled water and dried before use. Normally the “water insoluble” hydrophobic compounds have a tendency to stick to tube walls, pipettes etc. Corex glass tubes from DuPont Instruments cleaned in chromosulfuric acid are used to minimize adsorption phenomena. Disposable polypropylene pipette tips can be used. Independent of utensils the adsorption is at its minimum when ghosts are present. Preparation of ghostsA uniform population of albumin-filled resealed membranes of human erythrocytes (pink ghosts) was prepared according to the directions given by Schwoch and Passow (19) and carried out as described by Funder and Wieth (20): Erythrocytes were isolated from heparinized human blood, washed with 165 mM KCl solution and cooled to 0°C. One volume suspension (haematocrit 40%) was added to ten volumes haemolysing solution: 3.8 mM acetic acid, 4 mM MgSO4, 0.5 mM EGTA/EDTA (1:1), containing albumin to a final concentration of 0.1% or 0.2% (15-30 μM), at 0°C, pH 4.1-4.2. The pH hereby increased to 6.0-6.2. Five minutes later one volume 2 mM KCl containing 25 mM Trisma base (Sigma) was added, raising pH to 7.3. After further 10 min at 0°C the lysate was transferred to 37°C for 45 min and the ghosts resealed. The resealed ghosts were isolated by centrifugation 20 000 x g for 5 min at 4°C in head SS-34 in a Sorval RC 5C and washed three times in 165 mM KCl, 2 mM phosphate buffer containing 0.02 mM EGTA/EDTA , pH 7.3 (buffer A) at 4°C. The addition of 125I-albumin to the lysate was found to have reached 93.8 % equilibration with the intracellular phase of resealed ghosts. 3.4 % of the initial haemoglobin remained in the ghosts. The ghosts were used within 2 days and were stored in buffer A containing 0.1% or 0.2% albumin at 0°C. Preparation of solutions (charge-buffers) for labelling of resealed ghostsLabelled and unlabelled ligands were dissolved in 50 μl benzene to give suitable final molar ratios of ligand to protein (ν). These 50 μl benzene is just enough to moisten 200 mg of the glass beads. The benzene was sublimated at a pressure below 16 mm Hg. Up to 10 μg material can be deposited on this amount of beads as a monomolecular layer. Charge-buffers were prepared by shaking such ligand-loaded beads in buffer A containing appropriate concentration of protein at 37°C for 15 min with a frequency of 85 strokes per min and amplitude 3 cm. This ensured a clear solution of protein bound lipophilic ligand and the recovery of arachidonate in albumin containing charge-buffer was 94-98%, a little less for anandamide (80-90%). The preparation of aqueous solutions of monomer lipophilic ligands in equilibrium with protein bound ligand is difficult. The method described here with deposition of the lipophilic compound on glass beads and subsequent incubation of the coated beads with protein containing solutions ensures a homogeneous solution without aggregates. Such solutions should always be used for studying effects of lipophilic ligands. Determination of water-phase concentration of ligandGhosts were packed by centrifugation for 7 min at 26500 x g, head SE-12 in the Sorval RC 5C centrifuge. 1 volume of packed ghosts (0.3 to 0.55 ml) was equilibrated with 1.5 volume of charge-buffer. The equilibration time for the different temperatures must be determined in advance by taking aliquots for counting. After more than 99% equilibrium between charge-buffer and ghosts, the samples were centrifuged (see above), charge-buffers were removed for scintillation counting (2 x 25 μl) and the ghosts were transferred to a new tube containing 5 ml buffer A without protein. Further 15 ml buffer A were added and by a steady rotating-movement a homogeneous suspension of ghosts was obtained. A total of 4 washings with 20 ml buffer A were carried out. Washings were carried out rapidly at low temperature, which means that the equilibrium water-phase concentration of ligand is not reached within the time of washing. This keeps the depletion of ligand from ghosts to a minimum. After the washings the packed ghosts were suspended in 2.6 ml buffer A and this suspension is distributed into four tubes according to the following scheme:
Ghosts and buffer were mixed gently and the glasses were placed at appropriate temperature with gentle shaking (see above). The equilibrium was obtained very quickly even at 0°C. Ghosts were deposited in the bottom of the tubes by centrifugation for 12 min as described above and 2 x 200 μl ghost-free supernatant were removed from the top of each tube for scintillation counting. The supernatant must be removed quickly to avoid convection of the deposited ghosts due to their low density (d = 1.04 g ml-1). It is important that ghosts are handle gently. In general no air may be flushed into the suspensions, either by pipetting or by shaking. Theory and calculationsThe equilibrium dissociation Kd is defined as: Kd = [L] [protein]/[protein-L] (1) Where [L] is the water-phase concentration of ligand and [protein-L] the concentration of protein bound ligand. We consider the general case where one protein molecule can bind up to N molecules of a ligand and that the binding sites are equivalent and independent i.e. the binding is non-cooperative, then we can write Kd as (21): Kd = [L] [N - ν]/ν (2) The term ν, which is normally defined as the number of bound ligand molecules per protein molecule, is defined here as the ratio of total number of ligand molecule to total number of protein molecules. This is justifiable because the number of molecules in the water-phase is about thousand times less than the number of bound molecules. Equation 2 can be rearranged to give: [L]/ ν = (1/N) [L] + Kd/N (3) On basis of determinations of corresponding values of n and [L], the plot according to (Equation 3) will give N and Kd and Ka as 1/Kd. Often the concentration range is known of bound hydrophobic ligand, as is protein concentration in plasma or in body fluids. Therefore an approximately range of ν values is known and charge-buffers are prepared accordingly. The ν values are calculated on basis of counting rates of charge-buffer (Ca dpm ml-1) samples after use. ν = Ca / (S [protein]) (4) where S is the specific activity of the ligand in dpm nmol-1 and [protein] is 15 or 30 nmol ml-1. The premises of the methodThe method takes advantage of the very strong binding of lipophilic ligands to proteins and to biological membranes. The binding capacity of the red blood cell membrane for individual lipophilic compounds can vary. The same is the case with the affinity. The lower capacity and/or the lower affinity of the membrane the higher protein concentration must be inside the ghosts in order to minimize the depletion of lipophilic ligand. The method is based upon the following premises. Equilibrium between the charge-buffers and the ghosts containing binding protein implies that the water phase concentrations of ligand ([L]) are the same everywhere and in equilibrium with ligand bound to protein inside and outside the ghosts as well as to ghost membrane. Since the charge-buffer can be quantitatively removed from the ghosts without any significant depletion of the ligand, the final water-phase concentration is necessarily the same as in the charge-buffer. The water-phase concentrations were calculated from counting rates of duplicates of ghost-free supernatant (Cs dpm ml-1) as Cs/S. The supernatants in each preparation contain a variable small amount of ligand-binding components released from a few damaged ghosts besides unbound ligand. Therefore, the data were subjected to a regression analysis with the reciprocal dilution factor as independent variable. The intercept value is the true concentration of ligand monomer (see Fig. 1A and B). Before a new lipophilic ligand is investigated, it is important to make sure that ghosts are not depleted considerably in comparison to the precision of the method. If this is the case, the ν value will be reduced but the method can still be used. The remaining ligand fraction in washed ghosts has to be determined and the relation of membrane binding and water-phase concentration must be known. It can be done by washing experiments with BSA-free as well as with BSA-filled ghost and measurement of the extracellular volume of weighted ghosts by [14C] methylated BSA,125I-BSA or by [3H] inulin (22). Scintillation counting and statisticsThe counting of the radioactive samples was effectuated in a liquid scintillation counter TRI-CARB 2200 CA (from Packard Instrument Company, IL) after the addition of 3.9 ml Ultima Gold scintillation fluid (Packard Instrument Company, Inc. Downwers Grove IL). Up to 400 μl aqueous solution can be counted with 3.9 ml Ultima Gold. The counting rate has an error smaller than 1% and the efficiency of 3H was 67%. Data analyses were performed by ORIGIN version 6 (Microcal Software, Inc, MA). Regression lines of plots and the statistics of slopes and intercepts were estimated by standard methods. Standard deviation (SD) of estimated parameters N and Kd values were calculated according to the general function given by Armitage (23), neglecting the unknown contribution of covariance. Weighted means of Kd values were calculated by giving single estimates the weights of the reciprocal variances of estimates (23).
As mentioned above it is important to ensure that only insignificant amount of ligand is washed out from the ghosts during the procedure. This is ensured by a series of washing experiments with albumin-free as well as albumin-filled ligand labelled ghosts. For fatty acids no significant depletion is seen. In the case of anandamide only a depletion of a few percent from the membrane is found whereas no depletion is seen from the enclosed albumin-anandamide complex. Figure 1 illustrates the relation between supernatant ligand concentrations of a washed ghost suspension and the reciprocal value of the dilution factors. If only the true water-phase concentration of monomer is present in the supernatant of such washed ligand labelled ghost, the regression line will be horizontal. However, the slopes of the regression lines are always above zero indicating that the supernatants contain a small quantity of dispersed binding capacity in the form of a small fraction of damaged ghosts and/or released protein, which will bind some ligand called dispersed-bound-ligand (DB). The concentration of DB increases in proportion to the ghost volume fraction. Therefore the supernatant ligand concentration corresponding to ghosts concentration of zero, the ordinate intercept, is the true monomer concentration of the ligand (Table 1 and 2). Figure 1A and B show examples of ligand supernatant concentrations at 37°C of four volume fractions of a washed ghost suspension initially in equilibrium with a charge-buffer containing BSA-bound ligand.
Ghosts of very low density may be present in the supernatant and as already pointed out a critical point is the separation of supernatant from ghosts immediately after centrifugation. Counting the ghosts in the supernatant with a Coulter Multisizer never gives more than 1 nl of ghosts in 200 μl supernatant of dilution I (see method) which amount to about 2% or less of the monomer. This number does not exceed the precisions by which our extrapolated monomer concentration is determined (Table 1 and 2). The precisions of our determinations differ widely. The average standard errors are 13.4% and 12.2% for anandamide and arachidonate respectively. The main reason is the different slopes of the regression lines, reflecting different small amount of binding capacity in the supernatants.
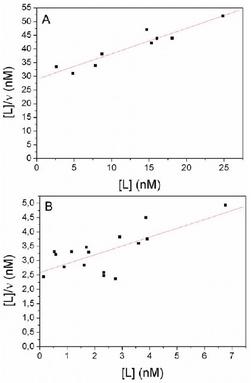
The determination of the number of binding sites (N) and Kd values are obtained by analyses of anandamide and arachidonic acid data after linearization according to equation (Equation 3). Figures 2A and B show examples of such plots. The values of N, Kd and Ka together with the levels of significance (P) and the coefficient of correlation (r) of the regression analyses are shown in Table 3. Three equivalent binding sites on BSA for arachidonate are suggested and one for anandamide.
The presented method is expected to provide physiological relevant information because it closely simulates a physiological situation with the ligand bound to its native protein in the present of biological membranes. Inside the semipermeable bags of resealed red cell membranes the ligand leaves its protein binding sites as a monomer and appears in the water phase as such. The system has the further merit that equilibria are established very rapidly due to the enormous surface area of the large number of semipermeable bags. It may be necessary to increase the equilibration time if the dissociation rate constant of ligand-protein complexes is very low. The sensitivity of the method depends on the specific activity of the ligand and high sensitivity requires the use of tritium-labelled compounds with high specific activity. As mentioned above, water-insoluble lipophilic compounds are always transported bound to their binding proteins and the technique described here profits of the very strong binding of such lipophilic ligands to ghosts filled with their binding proteins. The extensive washings are necessary to remove the charge-buffer containing the binding protein and most of the dispersed binding capacity (DB). Therefore as mentioned the washings are done rapidly and at low temperature. This keeps the depletion of ligand to a minimum. None of the compounds we have studied show significant depletion during the washing procedure. In principle depletion may arise also in the dilution step. However, this would primarily affect the measured water-phase concentration obtained from the most diluted suspensions. In other words, the point signifying water-phase concentration of the most diluted sample would be below the regression line defined by less diluted suspensions. This has not been observed. As mentioned above the slopes of the regression lines are a consequence of the dispersed bound ligand. The variations in the slope could in principle arise through insufficient washings. This was excluded by failure of further washings to reduce the slope. A more likely explanation is a variation in the stability of the ghosts from different human donors. Attempts to make ghosts from readily available bovine red cells gave almost the same results and very probably the stability of ghosts from bovine donors also varies. As regards aggregation there is no indication that such phenomenon is significant when the present method is used. The great number of ghosts seems to prevent aggregation. In contrast to the method described here, the phase partition method (1-4) measures the water-phase concentration indirectly from the uptake in heptane and the heptane-water partitions in separate experiments and it uses a liquid-binder heptane. Also the two other methods (11-13), using fatty acid binding proteins, which have been modified by a fluorescent compound, measure the free fatty acid concentration indirectly as the difference between totally added fatty acid and measured bound fatty acid both of which are large numbers. By the present method it is possible by analyses of the data to determine dissociation equilibrium constants (Kd’s) as well as number of binding sites on carrier proteins. The studies using the fluorescent probe ADIFAB and BSA-HCA (7hydroxycoumarin-4-acetic acid) give arachidonic acid Kd values, which are in the same range as our Kd values (11-13). However, the values depend somewhat of the method of analysis. Data analysis according to a multiple stepwise equilibrium model using six constants reveals the presence of three high affinity binding sites with Kd values from 22-28 nM at 37°C (11), whereas analysis of the same data according to a single site equilibrium binding constant gives a Kd of 1.63 μM (12). The use of BSA-HCA gives a Kd value of arachidonic acid of 62 nM at 20°C (13). Our data on equilibrium binding constants of anandamide to BSA are the first data available. As regards the number of binding sites on BSA for arachidonic acid recent determination of binding characteristics of albumin and fatty acids is mostly based upon crystallographic studies and NMR-spectroscopy. The first kinds of studies are not immediately comparable with our studies as very high unphysiological n values are used (24). Furthermore human serum albumin has been the preferred albumin and interpretation of binding data for human serum albumin in terms of BSA structure should proceed with caution as both albumins only share 76% sequence homology. On the other hand NMR spectra reveal three primary high affinity-binding sites for long-chain fatty acids when physiological ν values are used (25, 26). The number of binding sites for anadamide on BSA has not previously been studied. The finding of only one binding site was unexpected. Interestingly however, NMR studies reveal a decreasing number of binding sites on BSA with increasing chain lengths of fatty acids, with only one site for hexacosanoic acid (27). In the light of anandamide being a larger molecule than arachidonic acid, it is probably important information. Thus results have been achieved that are in line with our determinations, obtained by a very different technique. In conclusion, the present method is generally applicable for lipophilic compounds, it measures directly the water-phase concentration and it uses the relevant protein-binder as a dispersed biological “reference-binder.” Furthermore the monomer ligand concentrations are prerequisite for the determination of the number of binding sites on the protein and of the equilibrium dissociation constants Kd’s through which important thermodynamic information can be obtained. When first Kd is known, this in turn allows one to calculate the water-phase concentrations at all n values by means of Equation 2.
I want to thank Stig E. Bojesen for important comments on the manuscript and Aase Frederiksen for skilful technical assistance. The work is supported by a grant from Novo Nordisk Foundation, Copenhagen Denmark.
|
|||||||||||||||||||||||||||||||||||||||||||||||||||||||||||||||||||||||||||||||||||||||||||||||||||||||||||||||||||||||||||||||||||||||||||||||||||||||||||||||||||||||||||||||||||||||||||||||||||||||||||||||||||||||||||||||||||||||||||||||||||||||||||||||||||||||||||||||||||||||||||||||||||||||||||||||||||||||||||||||||||||||||||||||||||||||||||||||||||||||||||||||||||||||||||||||||||||||||||||||||||||||||||||||||||||||||||||||||||||||||||||||||||||||||||||||||||||||||||||||||||||||||||||||||||||||||||||||||||||||||||||||||||||||||||||||||||||||||||||||||||||||||||||||||||||||||||||||||||||||||||||||||