|
 |
Introduction
The past decade has seen a
burgeoning interest in research and policy analysis with respect to problem
gambling. Despite the community focus of much of this work, there is little
evaluation research at present concerning the impact of problem gambling
on health and social services in general or the specialized sector of
services, now in many communities for treating problem gambling. Thus,
there is a need to broaden the research frame for problem gambling to
include health services research and policy analysis (Aday, Begley, Lairson
& Slater, 1998). One of the key aspects of services research includes
"performance monitoring" of publicly funded services that provide treatment
to problem gamblers. Generally, this kind of monitoring and evaluation
is a fundamental part of services research in the addiction field (Dennis,
1999). To date, there have been a small number of studies about the characteristics
of problem gamblers in specialized treatment services (e.g., Crisp et
al., 2000); however, only one study has been done in a Canadian context
(Beaudoin & Cox, 1999). The results suggest that gambling to relieve
dysphoria or escape from life problems characterize a large subset of
problem gamblers in treatment. In addition, in contrast to other U.S.
studies where older males predominate (Volberg, 1994), their treatment
sample was approximately one-third female, and 43% were between the ages
of 18 and 34. Other studies in some jurisdictions suggest that female
problem gamblers increasingly participate in treatment (Moore, 1998; Stinchfield
& Winters, 1996). Crisp et al. (2000) report on the gender differences
in the types of gambling activities and related problems that were reported
at initial assessment for entry into the program.
Specialized treatment services
for problem gambling have rapidly expanded across Ontario in response
to needs at the community level; provincial policy since 1996 directs
a proportion of gambling revenue to treatment programs for problem gambling,
community information services and prevention and research. Currently,
2% of slot machine gross revenue is committed to expand the problem gambling
initiatives in the province. This funding totaled $3.5 million in 1998/1999,
$10 million in 1999/2000, and $17 million in fiscal 2000/2001. The share
of funding that went to treatment was $2.2 million (1998/1999), $3.1 million
(1999/2000) and about $6 million in 2000/2001.
As part of this funding envelope,
specialized treatment services for problem gambling have been developed
largely through designated funding to existing addiction treatment services.
As of this writing, 43 substance-abuse programs have received supplementary
funding for a service component dedicated to problem gambling. Under the
auspices of general health and social services that focused specifically
on the Chinese-Canadian community, another problem gambling program was
funded by the Ontario Substance Abuse Bureau (OSAB). The Mnjikaning First
Nation at Rama, Ontario, also funded a specialized gambling treatment
program for the First Nations community. (Data from
this treatment centre are not included in the present report.) Thus, there
were 45 programs in operation, and 44 of them were funded by OSAB. OSAB's
commitment to specialized problem gambling treatment programs increased
from three agencies and $1 million in funding in 1995/1996 to 44 agencies
and just under $6 million in funding in 2001. Included in this figure
is funding for seven new programs targeted at special populations (ethno-cultural,
older adults, women and youth).
It should be kept in mind that
OSAB-funded treatment agencies are not the only sources available to Ontario
citizens seeking help for gambling related problems. This report does
not consider additional guidance or treatment received from existing non-OSAB
funded sources, such as Gamblers Anonymous/GAMANON, Employee Assistance
Programs or religious groups.
Drug and Alcohol Treatment
Information System (DATIS)
All substance-abuse services
funded by OSAB (approximately 200 programs) participate in an ongoing
client-based information system, which monitors the number and characteristics
of clients seeking help, and an assessment of the services they have received.
Ogborne, Braun and Rush (1998) provide an overview of DATIS, and a report
is currently being prepared that summarizes annualized data from this
provincial monitoring system for the fiscal year 1999 and 2000. Since
early 1998, the 44 OSAB-funded, designated treatment programs for problem
gambling have been participating in DATIS and reporting on a special component
developed specifically for problem gambling services.
Objectives
The objectives of this report
are to
- estimate the number of
people seeking specialized treatment on an annual basis at problem gambling
programs in Ontario; and
- describe the characteristics
of problem gamblers entering treatment, including demographic characteristics,
type of gambling behaviour and problem severity.
Method
Data Elements
There are four broad categories
of data submitted by the participating agencies: client demographics,
gambling activities, problem severity and services received (see Table
1). The agencies also collect the required information for the larger
DATIS information system, with links to the gambling data provided by
a unique client identifier, which is based on birth date, initials at
birth and gender (Dalrymple, Lahti, Hutchison & O'Doherty, 1994).
A person becomes a "case" in the information system when he or she has
been registered in the program as a client. For the majority of programs
this will mean there has been face-to-face contact with clients. One treatment
program has a well-established telephone counseling service and, as a
general rule, callers are registered as clients if the call is about counseling
and exceeds 20 minutes. It should be noted, however, that the data collection
process and data definitions will underestimate the overall involvement
of agency staff with problem gamblers and their families; telephone support
for people who chose not to formally enter the program, and the staff's
prevention work in the community are not captured in the information system.
Table
1. Data elements in the problem gambling treatment information system
|
Demographic characteristics
- Problem gambler or
family member/significant other
- Age
- Gender
- Ethnic/cultural background
- Reason for seeking
help (gambling or other treatment)
|
Gambling activities
- Type and frequency
of gambling activity
- Type and frequency
of gambling locations
|
|
Problem severity
- Length of time since
last gambled
- Years of negative
consequences
- South Oaks Gambling
Screen (11)
|
Services received
- Duration of different
service activities (e.g., Assessment,
counseling)
|
Data Collection, Transmission
and Analysis
At the agency site, the data
elements are captured on three forms. Form A is completed at intake and
records the client's demographic characteristics, frequency of different
gambling activities and location of gambling. Form B collects the South
Oaks Gambling Screen (SOGS) data (Lesieur & Blume, 1987). A third
form, the Individual Activity Timesheet, is then completed after each
face-to-face or telephone contact with the client. The roll-up of the
data from this third form summarizes the type and duration of services
received. The forms were designed using Teleform software, so that, upon
completion, they are faxed to a central 1-800 number and the data is read
directly into Microsoft Access database. A research clerk scans the Teleform
data and implements a standard cleaning protocol involving the identification
of unreadable and out-of-range data. Following the data-cleaning process,
the Access database is read into Statistical Package for the Social Sciences
software for analysis and generation of statistical tables. All admission
records date-stamped between January 1, 1998 and April 30, 2000 were selected
for this paper.
Missing Cases
In this report, we summarize
the information captured in the central database as reported by the participating
agencies; the data used has undergone the cleaning process. While missing
data ranged from 2% to 3% for the majority of items, there was an unexpected
volume of missing data on a small number of items (e.g., about 20% of
the SOGS were missing). There was also a considerable amount of out-of-range
data (e.g., the unscored SOGS item concerning the largest amount of money
ever gambled on any one day; and items on the data collection form that
captured duration and type of services provided on an ongoing basis).
Some of the problems were due to a few agencies not completing the required
forms or data fields. Most of the data quality problems that resulted
in machine-readable errors, however, have been traced to problems using
the Teleform system that resulted in machine-readable errors. Thus, extensive
cleaning processes have been applied manually to the information used
for this report. With training and ongoing communication between the agencies
and the new DATIS field staff, these errors in data collection and transmission
have been significantly reduced.
Because the problem gambling
programs have not reported all of their clients to the information system,
the total use of these services will be underestimated. All agencies were
contacted prior to the preparation of this report. Their participation
was verified, and any outstanding issues related to their involvement,
case reporting and data quality were discussed. Four programs reported
that they had not yet seen any clients. For those programs that did not
send in each of the required forms (e.g., the SOGS), the count of their
clients will still be an accurate reflection of their total caseload.
Some programs reported not sending in any forms for a small number of
clients, and we estimate this number to be less than 100 for the province
as a whole. Thus, we believe the data system and this first report from
the database reflect a reasonably accurate estimate of the provincial
caseload of Ontario's problem gambling treatment programs.
Results
Caseload
Table 2 shows 44 OSAB-funded
treatment programs in operation with a total caseload of 2224 over the
study period. The table also places these provincial totals into a regional
context by displaying the information separately for the seven Ministry
of Health and Long-Term Care (MOHLTC) regions and adjusting the data for
population size. It is important to note that the treatment caseload data
are based on the geographic location of the treatment program, not the
residence of the client. The agency location, however, will be a reasonably
close proxy for the location of the clients' residence since the treatment
programs are all non-residential programs and draw the large majority
of their clients from a 50 to100 kilometer radius. An exception to this
group is the program with the telephone counseling service, which receives
occasional calls from outside their district. On a per capita basis, the
South West Region has the highest user rate of problem gambling treatment
programs in Ontario (2.98 per 10,000), a rate that is about 44% higher
than the provincial average. Ontario's North Region has the second highest
number of users at 2.82 per 10,000, followed by the South Central Region
at 2.43 per 10,000. The West Central Region has the lowest user rate at
1.46 per 10,000.
Table
2. Regional context for specialized services for the treatment of problem
gambling in Ontario
|
Region1
(Largest city/ municipality)
|
No. of programs funded
|
Problem gambling
two-year caseload
|
|
N
|
Rate2
|
|
Central East3
(Oshawa)
|
4
|
251
|
1.50
|
|
Central South (Hamilton)
|
4
|
265
|
2.43
|
|
Central West (Kitchener-Waterloo)
|
4
|
265
|
1.46
|
|
East (Ottawa)
|
8
|
258
|
1.74
|
|
North (Sudbury)
|
15
|
240
|
2.82
|
|
South West (London)
|
7
|
429
|
2.98
|
|
Toronto
|
2
|
501
|
2.10
|
|
No region identified
|
-----
|
15
|
-----
|
|
Total
|
44
|
2224
|
2.07
|
1Planning
region for Ministry of Health and Long-Term Care.
2Rate
per 10,000 population.
3Excludes
Mnjikaning First Nation at Rama
Figure 1 examines the total
caseload reported across the study period (28 months from January 1, 1998
to April 30, 2000), as it was reported during four-month segments. There
are two reasons for reporting the data in this manner. Firstly, one can
clearly see the rapid increase in use of the gambling treatment programs
during 1998, and the stabilization in total utilization during 1999 to
the end of the study period. This reflects the growth in provincial treatment
capacity through 1998, since the number of programs grew dramatically
during this period. Undoubtedly, it also reflects the increasing use of
the individual programs as they became established in their community.
Secondly, the four-month breakdown allows one to derive a projection of
the current annual caseload by taking the average of the caseload of the
last four, relatively stable periods (mean= 476), and multiplying by three
to yield a total annual estimate of 1428 clients.
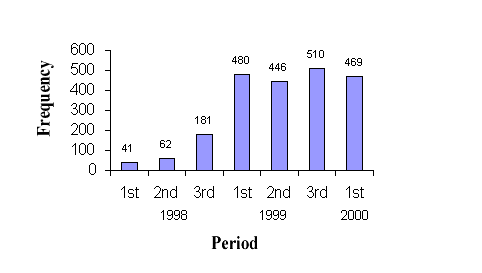
Figure
1. Frequency of use by four-month period between January 1/98 and April
30/00
These figures will still be
an underestimate of total service use because four programs had not yet
seen any clients during the study period. However, the estimation approach
provides the necessary adjustment for the rapid increase in treatment
capacity over the two-year period and the start-up phase for many of the
agencies that are now fully operational.
Demographic Characteristics
Of the 2224 clients in treatment,
1625 (73.5%) were seeking help for their own gambling problem, and 504
(22.8%) were seeking help in dealing with a family member/significant
other's gambling problem. The remaining 82 (3.7%) were seeking help for
both their own gambling problems and dealing with a family member's. The
overall gender ratio of cases in treatment was about 1.4:1 males to females
(58.3% to 41.7%). A significantly higher percentage of women compared
to men sought help for their difficulty with a family member/significant
other (37.3% of women compared to 12.1% of men [x2=194.45,
df=2, P<.001]). Consequently, when only those clients who sought help
for their own gambling problems (including a small proportion of clients
seeking help for both their own and a family member/significant other's
gambling problem) are considered, the gender ratio widens to 1.9:1 males
to females (65.6% to 34.5%). (See Table 3.)
Table 3 shows the age distribution
of male and female clients seeking help for their own problem gambling.
The age distribution for both genders combined is bell-shaped, with the
largest percentage (33.6%) falling within the age category of 35 to 44.
The difference in the age distribution between males and females is statistically
significant (x2=68.85, df=8, p<.001); male clients tend
to be younger.
Table
3. Age by gender of problem gamblers in treatment1
|
Age category
|
Male
|
Female
|
Total
|
|
N
|
%
|
N
|
%
|
N
|
%
|
|
<16
16-17
18-24
25-34
35-44
45-54
55-64
65-69
70-100
Total
|
3
11
81
295
378
230
85
14
7
|
.3
1.0
7.4
26.7
34.2
20.8
7.7
1.3
.6
|
0
2
16
102
188
156
94
11
10
|
0
.4
2.8
17.6
32.5
26.9
16.2
1.9
1.7
|
3
13
97
397
566
386
179
25
17
|
.2
.8
5.8
23.6
33.6
22.9
10.6
1.5
1.0
|
|
1104
|
100.0
|
579
|
100.0
|
1683
|
100.0
|
1 Includes
those in treatment for their own gambling problem and those in treatment
for both their own problem and a family member/significant other's.
Table 4 shows the ethnic and
cultural background of clients seeking treatment for their gambling problem.
The largest proportion of clients seeking treatment are people of white
background (83.3%). People of Aboriginal/ First Nation's heritage accounted
for 4.9% of clients, and people with Asian backgrounds accounted for 7%
and small percentages were drawn from several other ethnic groups.
Table
4. Ethnic/cultural background of problem gamblers in treatment1
|
Ethnic/cultural background
|
Total
|
|
N
|
%
|
|
Aboriginal/First Nations
|
74
|
4.9
|
|
Asian
|
106
|
7.0
|
|
White
|
1261
|
83.3
|
|
Other
|
72
|
4.8
|
| Total
|
1513
|
100.0
|
1 Includes
those in treatment for their own gambling problem and those in treatment
for both their own problem and a family member/significant other's.
The forms in the data-collection
system record whether the client initially came for help with a gambling
problem or whether the problem surfaced later in the course of providing
support for substance abuse or some other issue. Almost 90% came to the
agency for their gambling problem; these percentages were similar for
both male and female clients.
Problem Severity
The number of years that gambling
has negatively affected a client's life is also recorded. Of the clients
in treatment for their own gambling problem, 27.8% have been negatively
affected by their gambling for one year or less,15.2% for two years, 25.2%
for three to five years, 14.3% for six to 10 years, and 17.4% for 11 years
or more.
The South Oaks Gambling Screen
is a widely used instrument for assessing the severity of problem gambling
based on DSM-III criteria (Lesieur & Blume, 1987). A cut-off score
of five or more is typically used as evidence of pathological gambling.
Some researchers and clinicians use a score greater than 10 as the criterion.
As shown in Table 5, about 90% of the client population seeking help for
their own problem gambling scored above the cut-off score of five; 48.5%
were above the more conservative cut-off of 10.
Table 5 examines the relationship
between the SOGS score (combining scores 1 to 4 for "problem gambling,"
and five and over for "pathological gambling") and years that gambling
has had negative consequences. There was no statistically significant
relationship between duration of negative consequences and problem severity
as measured by the SOGS.
Table
5. Number of years gambling has negatively affected clients' lives1
(by SOGS score)
|
Years
|
SOGS
categories
|
|
1-4
(some gambling-related problems)
|
5-20
(probable pathological gambling)
|
|
N
|
%
|
N
|
%
|
|
1
|
31
|
29.8
|
213
|
20.2
|
|
2
|
17
|
16.3
|
174
|
16.5
|
|
3-5
|
22
|
21.2
|
296
|
28.1
|
|
6-10
|
14
|
13.5
|
166
|
15.7
|
|
11+
|
20
|
19.2
|
205
|
19.5
|
|
Total
|
104
|
100.0
|
1054
|
100.0
|
1 Includes
those in treatment for their own gambling problem and those in treatment
for both their own problem and a family member/significant other's.
Gambling Activities
Each client entering the gambling
treatment program was asked to identify his or her major problem gambling
activity and, if appropriate, up to two additional problem activities.
Table 6 shows the diversity of gambling activities that were identified
as problematic by these clients. The most frequently cited problem activities
were slot machines (37.7%), cards (30.6%) as well as lottery and scratch
tickets (34.5% and 29.5% respectively). Bingo was cited by 22.6% and sports
betting by 20%.
Table
6. Type of gambling activity reported as a problem1
|
Activity
|
Total
(N=1197)
|
|
N
|
%
|
|
Slots
|
451
|
37.7
|
|
Lottery tickets
|
413
|
34.5
|
|
Cards
|
366
|
30.6
|
|
Scratch tickets
|
353
|
29.5
|
|
Bingo
|
271
|
22.6
|
|
Sports
|
239
|
20.0
|
|
Tear tickets
|
230
|
19.2
|
|
Horses, dogs
|
169
|
14.1
|
|
VLT 2
|
101
|
8.4
|
|
Roulette
|
83
|
6.9
|
|
Games of skill
|
58
|
4.8
|
|
Other
|
39
|
3.3
|
|
Dice games
|
37
|
3.1
|
|
Mahjong
|
25
|
2.1
|
|
Stock options
|
21
|
1.7
|
|
Keno
|
19
|
1.6
|
1 Collapsed
across clients' reports of major problem activity and first and second
other problem activity.
2 As
VLTs are illegal in Ontario, clients reporting this type of activity
as a problem are either using the machines illegally or are gambling
in a province in which VLTs are legal.
Table 7 shows what locations
clients in treatment for problem gambling frequent the most. Consistent
with the above data concerning gambling activities, the most common locations
were casinos (58.2%), kiosks (38.3%) and bingo halls (22.8%).
Table
7. Gambling locations frequented the most
|
Location
|
Total
(N=1195)
|
|
N
|
%
|
|
Casino
|
695
|
58.2
|
|
Kiosk
|
458
|
38.3
|
|
Bingo hall
|
272
|
22.8
|
|
Track
|
143
|
12.0
|
|
Off-track
|
95
|
8.0
|
|
Telephone
|
95
|
8.0
|
|
Charity casino
|
91
|
7.6
|
|
Community
|
78
|
6.5
|
|
Family
|
62
|
5.2
|
|
Social club
|
53
|
4.4
|
|
Internet
|
16
|
1.4
|
|
Television
|
16
|
1.4
|
|
School
|
4
|
0.1
|
1 Collapsed
across clients' reports of top three locations for gambling.
Discussion
This paper presents highlights
from a client-based information system that collects and collates data
from the designated programs for the treatment of problem gambling in
Ontario. The primary goals of the information system are to contribute
basic accountability and planning information at the agency, regional
and provincial levels. A series of standard statistical tables are being
prepared that summarize the complete set of data elements as well as structured
feedback reports to the participating agencies, so that they can compare
their client population to the provincial averages. The primary aims of
this paper are to estimate the annual caseload of these problem gambling
programs and describe important characteristics of clients. The data also
establish a baseline of key indicators to be monitored over time.
The results of the information-collection
system showed that just over 2200 people have sought help at provincial
problem gambling programs since early 1998. Of this total, about one-third
were seeking help for difficulties related to a family member or a significant
other's gambling problem. Thus, the provision of support to people affected
by someone else's gambling behaviour is an important role played by the
gambling treatment programs in their community. An annualized estimate
of just over 1425 total cases was projected because of a relatively stable
pattern of service use over the fiscal year 1999/2000. Of this total,
we estimate that about 950 to 975 problem gamblers are seeking treatment
each year; the remainder of cases are family members/significant others.
This number is quite small
in comparison to estimates from Canadian prevalence studies of problem
gambling. A review of studies conducted in eight of Canada's 10 provinces
suggested that between 2.7% and 5.4% of Canadians were problem or pathological
gamblers in 1996 (National Council of Welfare, 1996). Comparable data
that is specific to Ontario is difficult to find because of the lack of
consensus as to what constitutes a "problem gambler." In 1993, 7.7% of
Ontario respondents scored between one and four on the SOGS, indicating
some gambling problems, and an additional 0.9% met the criteria for probable
pathological gambling (e.g., a score of five or higher) (National Council
of Welfare, 1996; Ladouceur, 1996). More recently in 2000, 2.6% of a representative
sample of Ontario respondents scored two or greater on the SOGS (Adlaf
& Ialomiteanu, 2001). It should be noted that the widespread use of
the SOGS in community-based studies has received some recent criticism
owing in part to the lack of validation work with the general population
(Ferris, Wynne & Single, 1998). There is also evidence that it may
considerably overestimate the prevalence of gambling-related problems
in the community (Lesieur & Blume, 1993).
These limitations aside, however,
the small number of people seeking treatment for gambling-related problems
in Ontario compared to the estimates reported by these prevalence studies
suggests a large unmet need for treatment in the community. It also reveals
the need for wider promotion of the service delivery system that has been
put in place for problem gambling treatment. There is also a need for
further study of the help-seeking patterns of problem gamblers and the
extent to which they are either reluctant to seek help, or are seeking
assistance from other, more generic health and social services in the
community (e.g., family physicians, community mental health programs,
family counseling, credit counseling).
The second objective of this
paper is to describe the clients presenting for treatment in a way that
is relevant for program and policy development and evaluation. There are
a number of interesting comparisons that can be made with the data. For
example, how do these clients compare to clients seeking help from substance-abuse
service providers? Unpublished information from DATIS and reports from
previous surveys of the addiction treatment system in Ontario (Tyas &
Rush, 1994) suggest that problem gamblers are older, and a larger percentage
of them are women and people who seek help for someone else's problem.
The fact that problem gamblers in treatment tend to be older than their
counterparts in substance-abuse services is cause for some concern. While
the prevalence of problem gambling is higher among adolescents, students
and young adults (Shaffer, Hall & Vander Bilt, 1999; National Council
of Welfare, 1996), older gamblers appear to be under-represented in the
treatment population (Adlaf & Ialomiteanu, 2000). For instance, a
study conducted in 1994 found that 33% of Ontario adolescents 12 to 19
had gambling-related problems, and 4% were probable pathological gamblers
(Canadian Foundation on Compulsive Gambling, 1994), making them roughly
four times more likely than adults to have considerable gambling-related
problems. A survey conducted in 1999 found that 13.3% of a representative
sample of Ontario high-school students scored two or greater on the SOGS,
compared to 2.6% of the adult population at roughly the same time (Adlaf
& Ialomiteanu, 2000). Both of these studies used the revised SOGS
for adolescents (SOGS-RA), which is similar to the adult version but has
not been validated with young people in the community (Adlaf & Ialomiteanu,
2000). This limitation notwithstanding, the data suggest a wide discrepancy
between the prevalence of problem gambling among youth and help-seeking
from specialized treatment services. This, in turn, points to the need
for early detection and intervention programs in addiction and other types
of community services serving young people.
The SOGS data show the full
spectrum of problem severity among people seeking treatment for their
gambling problem. The data also show that the number of years of negative
consequences related to gambling highlight the rapid onset of these problems
for a substantial proportion of clients — 43% in two years or less.
That there is no relationship between problem severity, as measured by
the SOGS, and years of negative consequences also underscores the rapid
onset of serious problems. Future studies need to explore the relationship
between problem onset and type of gambling activity.
The descriptive data on the
types of gambling activities identified as problematic are also of interest
since they point out the diversity of these activities among problem gamblers
in treatment. The sheer variety of problematic gambling activities beyond
casino and racetrack venues is important for the development of policy
as well as public education and prevention programs. For example, a large
percentage of problem gamblers in treatment report problems related to
lotteries and tear tickets; these two forms of gambling have become part
of the fabric of daily life for many Canadians.
The data presented here will
also be valuable in monitoring changes in the size and nature of the clientele
accessing these problem gambling treatment programs. Broader stakeholder
consultation is required to narrow a list of "system performance indicators."
However, the selection process might usefully begin by considering some
of the following: total caseload per year; proportion of female clients;
mean and median age; proportion of clients from different ethnic/cultural
groups known to have particular needs; and the proportion of clients reporting
certain problem activities (e.g., slots, bingo) and locations (e.g., casinos,
racetrack, Internet). Other indicators will need to be developed for the
duration and type of various treatment activities (e.g., hours of assessment
and counseling; proportion of direct versus indirect care and support).
This kind of data has not been reported here because it is still undergoing
a cleaning and editing process. In this regard, efforts will need to continue
with the participating programs to reinforce the importance of reporting
high quality and complete data into the information system. Planned enhancements
to the DATIS project will build the gambling component directly into the
new software to be developed and disseminated to OSAB-funded agencies.
Finally, from the perspectives
of both system/program accountability and ongoing system/program quality
improvement, there is a critical need to expand the gambling monitoring
system to include modules related to service costs and client outcome.
A cost-outcome monitoring system has been successfully piloted within
Ontario's substance-abuse services (Rush, Hobden, Aiken Harris & Shaw
Moxam, 2000; Rush, Wall & Shaw Moxam, 2000), and many of the lessons
learned in that project will apply to this sector of problem gambling
programs.
References
- Aday, L.A., Begley, C.E.,
Lairson, D.R. & Slater, C.H. (1998).
- Evaluating the Healthcare
System: Effectiveness, Efficiency and Equity (2nd ed.). Chicago,
IL: Academy for Health Services Research/Health Administration Press.
- Adlaf, E.M. & Ialomiteanu,
A. (2001).
- 2000 CAMH Monitor: Addiction
and Mental Health Indicators Among Ontario Adults, 1977–2000.
Toronto, ON: Centre for Addiction and Mental Health. Available: http://www.camh.net/research/pdfs/cm2000-epirpt.pdf
- Adlaf, E.M. & Ialomiteanu,
A. (2000).
- Prevalence of Problem Gambling
in Adolescents: Findings from the 1999 Ontario Student Drug Use Survey.
Canadian Journal of Psychiatry, 44, 752–755.
- Beaudoin, C. & Cox,
B. (1999).
- Characteristics of problem
gambling in a Canadian context: A preliminary study using a DSM-IV-based
questionnaire. Canadian Journal of Psychiatry, 44, 483–487.
- Canadian Foundation on
Compulsive Gambling. \1\2994).
- An Exploration of the
Prevalence of Pathological Gambling Behaviour Among Adolescents in Ontario.
Toronto, ON: Canadian Foundation on Compulsive Gambling (Ontario).
- Crisp, B.R., Thomas,
S.A., Jackson, A.C., Thomason, N., Smith, S., Borrell, J., Ho, W., &
Holt, T.A. (2000).
- Sex differences in the treatment
needs and outcomes of problem gamblers. Research on Social Work Practice,
10(2), 229–242.
- Dalrymple, A.J., Lahti,
L.S., Hutchison, L.J. & O'Doherty, J.J. (1994).
- Record linkage in a regional
mental health planning study: Accuracy of unique identifiers, reliability
of sociodemographics, and estimating identification error. The Journal
of Mental Health and Administration, 21(2), 185–192.
- Dennis, M.L. (1998).
- Integrating Research
and Clinical Assessment: Measuring Client and Program Needs and Outcomes
in a Changing Service Environment. National Institute on Drug Abuse
Resource Centre for Health Services Research. Available: http://www.nida.nih.gov/HSR/da-tre/DennisIntegrating.htm
- Ferris, J., Wynne, H.,
& Single, E. (1998).
- Measuring Problem Gambling
in Canada: Draft Final Report for the Inter-provincial Task Force on
Problem Gambling. Ottawa, ON: Canadian Centre on Substance Abuse.
- Ladouceur, R. (1996).
- The prevalence of pathological
gambling in Canada. Journal of Gambling Studies, 12(2), 129–142.
- Lesieur, H. & Blume,
S.B. (1993).
- Revising the South Oaks
Gambling Screen in different settings. Journal of Gambling Studies,
9(3), 213–223.
- Lesieur, H.R. & Blume,
S.B. (1987).
- The South Oaks Gambling
Screen (SOGS): A New Instrument for the Identification of Pathological
Gamblers. American Journal of Psychiatry, 144(9), 1184–1188.
- Moore, T. (1998, June).
- Evaluating a large systems
treatment intervention: An update of the Oregon state-wide evaluation
study. Paper presented at the 12th National Conference
of Problem Gambling, Las Vegas, NV.
- National Council of Welfare.
(1996).
- Gambling in Canada.
Ottawa, ON: National Council of Welfare.
- Ogborne, A.C., Braun,
K. & Rush, B.R. (1998).
- Developing an integrated
information system for specialized addiction treatment agencies.
The Journal of Behavioral Health Services and Research, 2511, 100-107.
- Rush, B.R., Hobden, K.,
Aiken Harris, J. & Shaw Moxam, R. (2000).
- Client outcomes within
the Ontario substance abuse treatment system: Results of a provincial
pilot study. Toronto, ON: Centre for Addiction and Mental Health.
Soon to be available from http://www.datis.ca/reports/index.html
- Rush, B.R., Wall, R.
& Shaw Moxam, R. (2000).
- Assessing the cost of
substance abuse treatment services in Ontario: Results of a provincial
pilot study. Toronto, ON: Centre for Addiction and Mental Health.
Available from http://www.datis.ca/reports/index.html
- Shaffer, H.J., Hall,
M.N. & Vander Bilt, J. (1999).
- Estimating the prevalence
of disordered gambling behavior in the United States and Canada: A research
synthesis. American Journal of Public Health, 89(9), 1369–1376.
- Stinchfield, R.D. &
Winters, K.C. (1996).
- Treatment effectiveness
of six state-supported compulsive gambling treatment programs in Minnesota.
Minneapolis, MN: Department of Psychiatry, University of Minnesota.
- Tyas, S. & Rush,
B.R. (1994).
- Trends in the characteristics
of clients of alcohol/drug treatment services. Canadian Journal of
Public Health, 85 (1), 13–16.
- Volberg, R.A. (1994).
- The prevalence and demographics
of pathological gamblers: Implications for public health. American
Journal of Public Health, 84, 237–241.
Submitted: April 9, 2001
Accepted: November 15, 2001
For correspondence:
Brian Rush, PhD
Health Systems Research and Consulting Unit
Centre for Addiction and Mental Health
33 Russell Street
Toronto, Ontario, Canada
M5S 2S1
Phone: (416)535-8501 ext. 6625
Email:
Brian Rush, PhD, is a
Senior Scientist with the Centre for Addiction and Mental Health (CAMH)
in Ontario, Canada. He is currently the Associate Director of the Health
Systems Research and Consulting Unit and an Associate Professor in the
Dept. of Psychiatry at the University of Toronto. He holds an MA in
psychology and a PhD in epidemiology and biostatistics and has worked
for 24 years in a research and evaluation capacity in the addiction
and mental health fields. His career has involved a rewarding balance
of scientific work and program and policy development. One of his major
research interests is the longitudinal study of the addiction treatment
system in Ontario, including treatment for problem gambling.
Raquel Shaw Moxam, BSc,
specialized in genetics at York University, Toronto. Her love and passion
for addiction research led her to the Substance Abuse Program for African
Canadian and Caribbean Youth (CAMH), then as Research Associate in the
Health Systems Research and Consulting Unit (CAMH). Later, she was a
Technical Advisor with the World Health Organization, Department of
Substance Dependence and Mental Health, Geneva, Switzerland. She is
currently with the College of Physicians and Surgeons of Ontario as
a Quality Management Coordinator. She thoroughly enjoys the challenge
of a new research project and thrives in a client-centred environment
that allows for lots of interaction with people. An avid fitness buff,
Raquel's long-term goal is to compete in a professional event and walk
away with the championship.
Karen Urbanoski is a Research
Analyst with the Health Systems Research and Consulting Unit at CAMH.
She holds a BSc in physiology and is currently working on an MSc in
epidemiology and biostatistics. Her areas of interest include problem
gambling and substance-abuse service research.
|
|