Prepared for the Canadian Radio-television and Telecommunications Commission
POR 027-16
Contract # 82082-170117/001/CY
Produced by TNS Canada
Contract Award Date: August 8, 2016
Report Date: November 18, 2016
Ce rapport est aussi disponible en français.
In 2013, the Canadian Radio-television and Telecommunications Commission (CRTC) created the Wireless Code so that consumers of retail mobile wireless voice and data services would be better informed of their rights and obligations contained in their wireless contracts. The CRTC committed to evaluating the Wireless Code in 2016-2017 to assess whether it continues to meet its objectives. As such, the CRTC seeks to understand the impact of the Wireless Code over time on consumers understanding of their contracts and related rights. Public Opinion Research (POR) related to the Wireless Code was conducted each year since 2014, with reports being published in Spring 2014, Spring 2015, and Spring 2016 respectively.
The primary purpose of the fall 2016 POR is to provide a deeper understanding of some issues affecting wireless consumers including complaints, data usage and bill shock. More specifically, the survey was designed to address the following objectives:
For tracking purposes and comparability over time, a questionnaire similar to the one used for the Spring 2016 POR was developed along with new questions designed to obtain additional information.
Canadians and their Wireless Devices
Mobile phones and wireless devices are a staple of Canadian life. With nearly universal adoption in Canada of mobile phones (91%) or any wireless device (93%)Footnote [1], the Wireless Code has become more important than ever. Furthermore, the rapid increase in smartphone ownership (87%) by Canadians (up 22% from 65% in 2015) points to the growing importance of data in particular. This is further supported by the fact that wireless plans are being used for all aspects of Canadians lives, from calling to texting, to using the internet, navigating, banking and shopping. Indeed, the use of mobile phones and thus their wireless plans permeates all aspects of Canadians lives. Most common are calls (92%) and texts (84%) followed by using the internet (74%), reading emails (72%) and using apps (70%). Social media (59%), navigation (58%) and online banking (45%) are also popular uses of wireless plans. Less popular, but still undertaken by a sizeable proportion of Canadians, are playing online games (31%), working (30%) and online shopping (26%).
Wireless Data Usage
Mobile wireless plans that include data have become increasingly common in Canada (72%). Most plans have limits on the amount of data included; however, some plans (16%) offer unlimited data. As a result, many Canadians try to manage or limit their data by using Wi-Fi or reducing data use. Few (36%), however, use tools to track or monitor data use.
While many Canadians (75%) consider it easy to manage data use, a considerable number (46%) have paid data overages in the past year, which suggests that some Canadians are struggling to manage their data in a way that prevents additional fees.
Bill Shock
While fewer than in the past (-7% since 2014))Footnote [2], a sizeable number of Canadians (21%) continue to experience bill shock, suggesting there continues to be room for improvement in this area moving forward. Canadians struggle with tracking how much data they use, understanding and managing the cost of international roaming fees and keeping track of how many calling minutes they have used.
Heavier users of wireless plans (26-31% vs 11-15%) are more likely to experience bill shock. Thus it is not unexpected to see that younger Canadians (18-54) are substantially more likely to experience bill shock than their older counterparts (24-25% vs 15%). As well, those with higher household incomes ($150K+) (36% vs 16-22%), those with family plans (28% vs 19%) and those with limited data (27% vs 14%) are also more likely to experience bill shock.
The amount of the unexpected charges varies greatly – from less than $50 to over $1,000 in one billing cycle. Most (64%) incidents of bill shock are $100 or less.
Complaints
Canadians are making fewer complaints suggesting the Wireless Code is having positive impacts for wireless consumers. Seventeen per cent of Canadians made a complaint about their wireless services in the last year. Complaints are down by 35 per cent in the past two years and 20 per cent of the 35 per cent has occurred in the last six months. Canadians that tend to complain, do so often, averaging 2.88 complaints in the past twelve months. They tend to complain to their service provider and mostly about incorrect charges on their bill, data charges, poor service quality and misleading contract terms.
Very few Canadians (2%) raise their complaint with the CCTS and mostly because they are unaware of its existence. Most Canadians (69%) do not recall being informed about the CCTS by their service provider suggesting alternative approaches to increasing awareness may be necessary.
One quarter (25%) of complainants feel their complaint was not resolved and close to half (46%) are not satisfied with the resolution of their complaint. 2015 and Spring 2016 results indicate higher satisfaction among those who raised their complaint with the CCTS.
Regional Differences
Regional analyses were undertaken to assess significant differences between regions (Atlantic, Quebec, Ontario, Prairies, BC and the Territories) and due to the presence of a fourth major carrier in the Prairies, further analyses between the provinces of Alberta, Saskatchewan and Manitoba were also undertaken. No significant differences were found between the Prairie Provinces and limited differences were found regionally. More specifically, Canadians in the Atlantic were less likely to have a wireless plan with data (57%) compared to the rest of Canada (76%) and more likely to have a tab plan (21% vs 4-6%). Furthermore, Quebeckers are least likely to experience bill shock (12% vs 19-31%) and least likely to complain (4% vs 14-24%), consistent with results from previous years. This may be related to the provincial consumer protection legislation that Quebec has had in place since 2009 - Quebecs Bill 60. Quebeckers are also less likely to own their own phone (59% vs 69-78%) and have a tab contract instead (15% vs 2-4%) and more likely to have a pre-paid plan (24% vs 10-19%).
Demographic Differences
A number of additional demographic analyse were also undertaken including age, gender, education, income and language. The most significant differences were related to age and income.
Age
Canadians 18-54 are substantially different than their older counterparts (55+) in a number of ways:
Income
Canadians with higher household incomes also differ from those with lower incomes ($60K) in a number of ways:
CRTC
Over the past two years, Canadians understanding of the mandate and role of the CRTC has declined somewhat. Overall impressions of the CRTC tend to have remained the same and are mostly neutral or positive with only 12 per cent having negative impressions of the CRTC . Older Canadians have more positive impressions of the CRTC compared to younger Canadians.
Strategic Implications
The results of this research provide support to suggest the Wireless Code has had positive impacts for Canadians. It also provides information that may inform future processes at the CRTC . More specifically:
The methodology was designed to ensure consistency with the last Wireless Code survey conducted by TNS in the Spring of 2016. A telephone survey was conducted among 1,483 Canadians age 18 years and older; 1,277 with those who have their own wireless plan and 206 with those who do not have a wireless plan. The sample was split into two distinct segments: Canadians who currently have a personal wireless plan covering services such as voice, text and data and Canadians who do not currently have a personal wireless plan. Interviews were conducted using random landline telephone sampling sources. Only landline phones were targeted for this survey as results from previous research indicate there are no discernible differences of opinions based on landline versus cell phone respondents. A pre-test consisting of 10 completed English interviews and 10 completed French interviews was completed before fielding the survey on August 29th, 2016. The survey was in field from September 6th to September 19th, 2016. The sample for this study was a probability sample and as such the findings can be extrapolated to the Canadian population with a margin of error of +/-2.5 per cent, 19 times out of 20.
The total contract value for this project was $59,934.45 including HST.
I hereby certify as Vice President, Ottawa Regional Office & Public Sector Practice Lead of TNS Canada Ltd. that the deliverables fully comply with the Government of Canada political neutrality requirements outlined in the Communications Policy of the Government of Canada and Procedures for Planning and Contracting Public Opinion Research. Specifically, the deliverables do not include information on electoral voting intentions, political party preferences and standings with the electorate or ratings of the performance of a political party or its leaders.
David Ang
TNS Canada Ltd.
Vice President, Ottawa Regional Office & Public Sector Practice Lead
The Wireless Code is a mandatory code of conduct for wireless service providers. The primary goals of the Code are:
The Code includes 61 provisions that address, among others: clarity; contracts and related documents; changes to contracts; bill management; mobile device issues; and cancellation. The Code applies to all retail mobile wireless voice and data services provided to individual and small business consumers in Canada.
The CRTC has committed to evaluating the effectiveness of the Code and to use the results as part of the formal review process. The review of the Wireless Code is intended to assess whether it meets and will continue to meet its objectives. Benchmarks were collected in the Spring of 2014 and tracking was conducted in the Spring of 2015 and 2016. As such, the CRTC seeks to understand the impact over time of the Wireless Code on consumers understanding of their wireless service contracts and their related rights. In order to ensure the effectiveness of the formal review and to get a deeper understanding of some of the issues that are affecting Canadians the most, the CRTC seeks to obtain more in-depth information on a variety of topics, including: wireless complaints, data usage and bill shock.
The overall objective of this research was to provide a deeper understanding of some issues affecting wireless consumers including complaints, data usage and bill shock in Canada.
More specifically, the survey was designed to address the following objectives:
For tracking purposes and comparability over time, some questions remained the same or similar to the ones used for the Wireless Code POR published in the Spring of 2016. To keep the survey no longer than 9 minutes, questions not needed for tracking purposes were removed and several new questions were added to the survey to obtain the additional informational requirements.
A telephone survey was conducted among 1,483 Canadians aged 18 years and older; 1,277 with those who have their own wireless plan and 206 with those who do not have a wireless plan. Interviews were conducted using random landline telephone sampling sources. A pre-test consisting of 10 English interviews and 10 French interviews was completed on August 29th, 2016. The survey was in field from September 6th to September 19th, 2016. The sample for this study was a probability sample and as such the findings can be extrapolated to the Canadian population with a margin of error of +/-2.5 per cent, 19 times out of 20. A detailed methodology can be found in Chapter 5.
Please note: Analysis was undertaken to establish the extent of the relationship among variables such as gender, age, region, level of education attained, language spoken, household income, type of plan (family vs. individual; prepaid vs postpaid; employee; subsidized phone/device; limited vs. unlimited data), complaints and bill shock. Only differences significant at the 95% confidence level are presented in this report. Any differences that are statistically significant between subgroups are indicated with an asterisk (*) in tables throughout the report.
The numbers presented throughout this report are rounded to the closest full number. Due to this rounding, in some cases it may appear that ratings collapsed together are different by a percentage point from when they are presented individually, and totals may not add up to 100%. Also the data for 2015 and 2014 was taken directly from the 2014 and 2015 Wireless Code Public Opinion Research reports. TNS has incorporated these results into the 2016 fall report for the purpose of year-over-year comparison.
Canadians and their Wireless Devices
Mobile phones and wireless devices are a staple of Canadian life. With nearly universal adoption in Canada of mobile phones (91%) or any wireless device (93%)Footnote [3], the Wireless Code has become more important than ever. Furthermore, the rapid increase in smartphone ownership (87%) by Canadians (up 22% from 65% in 2015) points to the growing importance of data in particular. This is further supported by the fact that wireless plans are being used for all aspects of Canadians lives, from calling to texting, to using the internet, navigating, banking and shopping. Indeed, the use of mobile phones and thus their wireless plans permeates all aspects of Canadians lives. Most common are calls (92%) and texts (84%) followed by using the internet (74%), reading emails (72%) and using apps (70%). Social media (59%), navigation (58%) and online banking (45%) are also popular uses of wireless plans. Less popular, but still undertaken by a sizeable proportion of Canadians, are playing online games (31%), working (30%) and online shopping (26%).
Wireless Data Usage
Mobile wireless plans that include data have become increasingly common in Canada (72%). Most plans have limits on the amount of data included; however, some plans (16%) offer unlimited data. As a result, many Canadians try to manage or limit their data by using Wi-Fi or reducing data use. Few (36%), however, use tools to track or monitor data use.
While many Canadians (75%) consider it easy to manage data use, a considerable number (46%) have paid data overages in the past year, which suggests that some Canadians are struggling to manage their data in a way that prevents additional fees.
Bill Shock
While fewer than in the past (-7% since 2014))Footnote [4], a sizeable number of Canadians (21%) continue to experience bill shock, suggesting there continues to be room for improvement in this area moving forward. Canadians struggle with tracking how much data they use, understanding and managing the cost of international roaming fees and keeping track of how many calling minutes they have used.
Heavier users of wireless plans (26-31% vs 11-15%) are more likely to experience bill shock. Thus it is not unexpected to see that younger Canadians (18-54) are substantially more likely to experience bill shock than their older counterparts (24-25% vs 15%). As well, those with higher household incomes ($150K+) (36% vs 16-22%), those with family plans (28% vs 19%) and those with limited data (27% vs 14%) are also more likely to experience bill shock.
The amount of the unexpected charges varies greatly – from less than $50 to over $1,000 in one billing cycle. Most (64%) incidents of bill shock are $100 or less.
Complaints
Canadians are making fewer complaints suggesting the Wireless Code is having positive impacts for wireless consumers. Seventeen per cent of Canadians made a complaint about their wireless services in the last year. Complaints are down by 35 per cent in the past two years and 20 per cent of the 35 per cent has occurred in the last six months. Canadians that tend to complain, do so often, averaging 2.88 complaints in the past twelve months. They tend to complain to their service provider and mostly about incorrect charges on their bill, data charges, poor service quality and misleading contract terms.
Very few Canadians (2%) raise their complaint with the CCTS and mostly because they are unaware of its existence. Most Canadians (69%) do not recall being informed about the CCTS by their service provider suggesting alternative approaches to increasing awareness may be necessary.
One quarter (25%) of complainants feel their complaint was not resolved and close to half (46%) are not satisfied with the resolution of their complaint. 2015 and Spring 2016 results indicate higher satisfaction among those who raised their complaint with the CCTS .
Regional Differences
Regional analyses were undertaken to assess significant differences between regions (Atlantic, Quebec, Ontario, Prairies, BC and the Territories) and due to the presence of a fourth major carrier in the Prairies, further analyses between the provinces of Alberta, Saskatchewan and Manitoba were also undertaken. No significant differences were found between the Prairie Provinces and limited differences were found regionally. More specifically, Canadians in the Atlantic were less likely to have a wireless plan with data (57%) compared to the rest of Canada (76%) and more likely to have a tab plan (21% vs 4-6%). Furthermore, Quebeckers are least likely to experience bill shock (12% vs 19-31%) and least likely to complain (4% vs 14-24%), consistent with results from previous years. This may be related to the provincial consumer protection legislation that Quebec has had in place since 2009 - Quebecs Bill 60. Quebeckers are also less likely to own their own phone (59% vs 69-78%) and have a tab contract instead (15% vs 2-4%) and more likely to have a pre-paid plan (24% vs 10-19%).
Demographic Differences
A number of additional demographic analyse were also undertaken including age, gender, education, income and language. The most significant differences were related to age and income.
Age
Canadians 18-54 are substantially different than their older counterparts (55+) in a number of ways:
Income
Canadians with higher household incomes also differ from those with lower incomes ($60K) in a number of ways:
CRTC
Over the past two years, Canadians understanding of the mandate and role of the CRTC has declined somewhat. Overall impressions of the CRTC tend to have remained the same and are mostly neutral or positive with only 12 per cent having negative impressions of the CRTC . Older Canadians have more positive impressions of the CRTC compared to younger Canadians.
Strategic Implications
The results of this research provide support to suggest the Wireless Code has had positive impacts for Canadians. It also provides information that may inform future processes at the CRTC . More specifically:
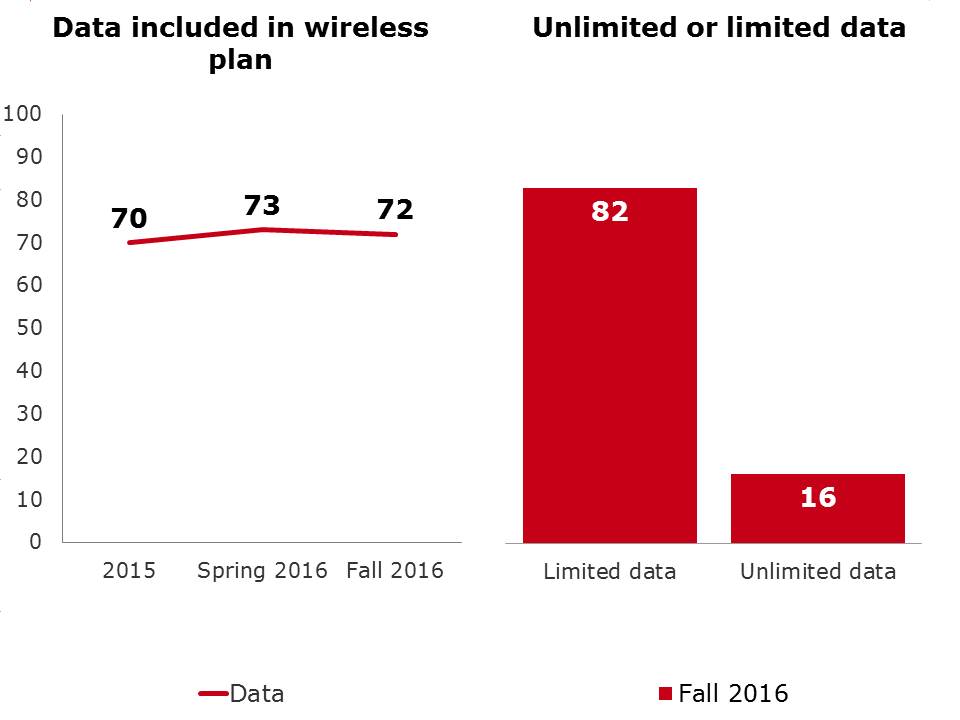
Wireless plans that include data are becoming increasingly common in Canada. Nearly three quarters of Canadians (72%) have wireless plans that include data. The vast majority have limited data (82%) while a small but significant proportion have unlimited wireless data (16%).
Exhibit 4.1.a. Data included in wireless plan over time and limited or unlimited plans
Data included in wireless plan over time and limited or unlimited plans - text version
QB2a. Which of the following are included in your wireless plan?
Base: Respondents who own a cell phone, fall 2016 (n=1,277)
QB9c3. Is Data included as part of your plan?
Base: Total Respondents Spring 2016 (n=925), 2015 (n=1,005)
QB4. Does your plan include unlimited or limited data?
Base: Respondents who have data included in the wireless plan, fall 2016 (n=831)
A variety of demographic factors influence whether or not Canadians have wireless plans that include data:
Exhibit 4.1.b. Data included in wireless plan by age and region
| Data included in wireless plan | Total | Age | Region | |||||||
|---|---|---|---|---|---|---|---|---|---|---|
| 18-34 | 35-54 | 55+ | Atl | Que | Ont | Pra | BC | Terr | ||
| Base=actual | (1,277) % |
(198) % |
(421) % |
(643) % |
(101) % |
(275) % |
(393) % |
(304) % |
(151) % |
(53) % |
| Yes | 72 | 85* | 78* | 51 | 57 | 71* | 71* | 78* | 72* | 87* |
| No | 26 | 15 | 21 | 45* | 42* | 28 | 26 | 20 | 26 | 13 |
*Represents significant difference at the 95% confidence level.
Exhibit 4.1.c. Data included in wireless plan by income and education
| Data included in wireless plan | Total | Income | Education | ||||||
|---|---|---|---|---|---|---|---|---|---|
| <$40K | $40K-<$60K | $60K-<$100K | $100K-<$150K | $150K+ | High school or less | College | University or more | ||
| Base=actual | (1,277) % |
(242) % |
(195) % |
(304) % |
(162) % |
(139) % |
(356) % |
(340) % |
(560) % |
| Yes | 72 | 59 | 61 | 76* | 86* | 89* | 65 | 75* | 75* |
| No | 26 | 38* | 37* | 22 | 13 | 10 | 33* | 24 | 24 |
*Represents significant difference at the 95% confidence level.
The use of mobile phones and thus their wireless plans permeates all aspects of Canadians lives. The wireless plan and wireless data in particular is becoming a more integral part of Canadians lives. Canadians are increasingly using their wireless devices for a variety of tasks and as this happens the importance of data in their wireless plan also increases.
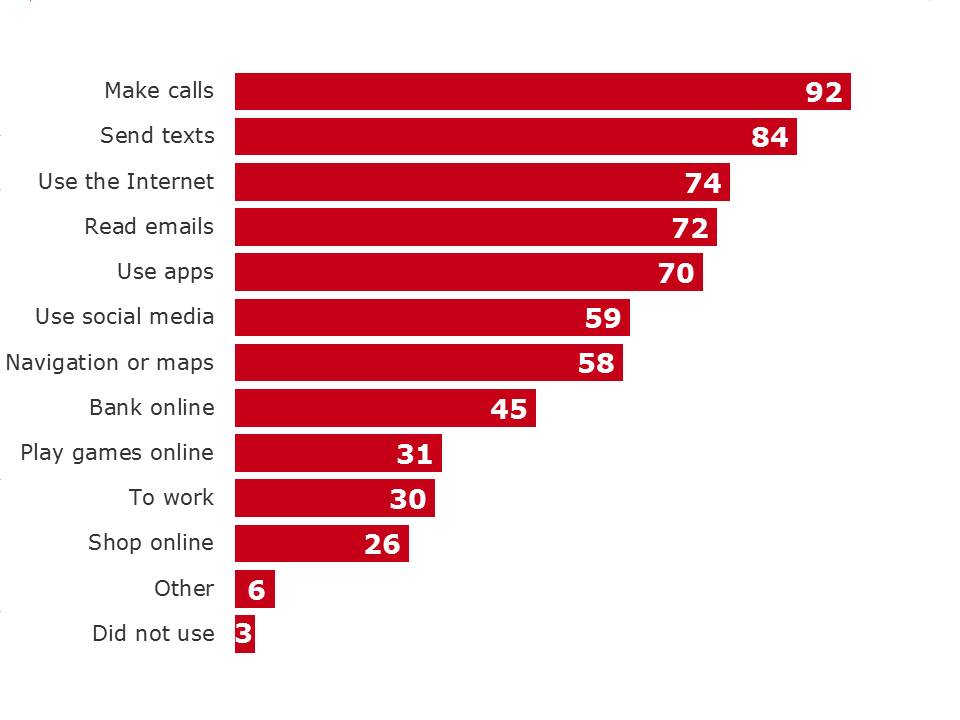
Not unexpectedly, the large majority of Canadians talk (92%) and text (84%) with their wireless plans. Many Canadians however, also undertake a variety of activities that require wireless data. Nearly three quarters of Canadians with wireless plans use it for accessing the internet (74%), reading emails (72%) or using apps (70%) while approximately half use it for social media (59%), maps or navigation (58%) and banking (45%). Fewer Canadians use their wireless plan to play games online (31%), work (30%) and shop online (26%).
Exhibit 4.1.1.a. Reasons for using the wireless plan
Reasons for using the wireless plan - text version
QB3. In the past month, have you used your wireless plan to:
Base: Respondents who own cell phone, fall 2016 (n=1,277)
Younger Canadians (18-54) are more likely to undertake all of these activities than older Canadians, while those who have pre-paid plans and lower incomes (less than $60K) are generally less likely to undertake all activities using their wireless plans suggesting cost and personal budget plays an important role in what Canadians do with their wireless plans.
Exhibit 4.1.1.b. Reasons for using the wireless plan by age and type of plan
| Reasons for using the wireless plan | Total | Age | Pre or Post-Paid | |||
|---|---|---|---|---|---|---|
| 18-34 | 35-54 | 55+ | Postpaid | Prepaid | ||
| Base=actual | (1,277) % |
(198) % |
(421) % |
(643) % |
(1,041) % |
(217) % |
| Make calls | 92 | 93* | 96* | 87 | 93* | 86 |
| Send texts | 84 | 95* | 93* | 63 | 89* | 61 |
| Use the Internet | 74 | 92* | 81* | 47 | 80* | 46 |
| Read emails | 72 | 87* | 77* | 49 | 77* | 47 |
| Use apps | 70 | 88* | 78* | 40 | 74* | 48 |
| Use social media | 59 | 80* | 65* | 27 | 64* | 33 |
| Navigation or maps | 58 | 79* | 63* | 31 | 64* | 30 |
| Bank online | 45 | 65* | 48* | 20 | 51* | 20 |
| Play games online | 31 | 42* | 34* | 14 | 33* | 21 |
| To work | 30 | 38* | 35* | 13 | 33* | 13 |
| Shop online | 26 | 37* | 29* | 9 | 29* | 10 |
| Other | 6 | 10* | 5 | 3 | 6 | 6 |
| Did not use | 3 | 2 | 1 | 7* | 2 | 10 |
*Represents significant difference at the 95% confidence level.
Exhibit 4.1.1.c. Reasons for using the wireless plan by income
| Reasons for using the wireless plan | Total | Income | ||||
|---|---|---|---|---|---|---|
| <$40K | $40K- <$60K |
$60K- <$100K |
$100K- <$150K |
$150K+ | ||
| Base=actual | (1,277) % |
(242) % |
(195) |
(304) % |
(162) % |
(139) % |
| Make calls | 92 | 85 | 90 | 96* | 95* | 97* |
| Send texts | 84 | 73 | 81 | 91* | 94* | 92* |
| Use the Internet | 74 | 64 | 66 | 78* | 89* | 90* |
| Read emails | 72 | 59 | 65 | 76* | 90* | 88* |
| Use apps | 70 | 60 | 62 | 73* | 84* | 88* |
| Use social media | 59 | 51 | 47 | 63* | 70* | 69* |
| Navigation or maps | 58 | 50 | 50 | 60 | 76* | 67* |
| Bank online | 45 | 40 | 37 | 50* | 60* | 53* |
| Play games online | 31 | 28 | 29 | 31 | 35 | 38 |
| To work | 30 | 16 | 24 | 36* | 41* | 40* |
| Shop online | 26 | 18 | 18 | 26 | 35* | 42* |
| Other | 6 | 8 | 5 | 7 | 4 | 6 |
| Did not use | 3 | 6* | 3 | 1 | - | 1 |
*Represents significant difference at the 95% confidence level.
Exhibit 4.1.1.d. Reasons for using the wireless plan by bill shock and lodged complaint
| Reasons for using the wireless plan | Total | Bill Shock | Lodged Complaint | ||
|---|---|---|---|---|---|
| Yes | No | Yes | No | ||
| Base=actual | (1,277) % |
(250) % |
(1,012) % |
(203) % |
(1,065) % |
| Make calls | 92 | 94 | 91 | 96 | 91 |
| Send texts | 84 | 92* | 82 | 93* | 82 |
| Use the Internet | 74 | 83* | 72 | 83* | 73 |
| Read emails | 72 | 82* | 69 | 83* | 70 |
| Use apps | 70 | 82* | 66 | 79* | 68 |
| Use social media | 59 | 72* | 55 | 69* | 57 |
| Navigation or maps | 58 | 73* | 54 | 75* | 56 |
| Bank online | 45 | 57* | 42 | 52 | 44 |
| Play games online | 31 | 38* | 29 | 42* | 28 |
| To work | 30 | 33 | 29 | 36 | 28 |
| Shop online | 26 | 35* | 23 | 32 | 25 |
| Other | 6 | 11* | 5 | 7 | 6 |
| Did not use | 3 | 2 | 3 | 1 | 3 |
*Represents significant difference at the 95% confidence level.
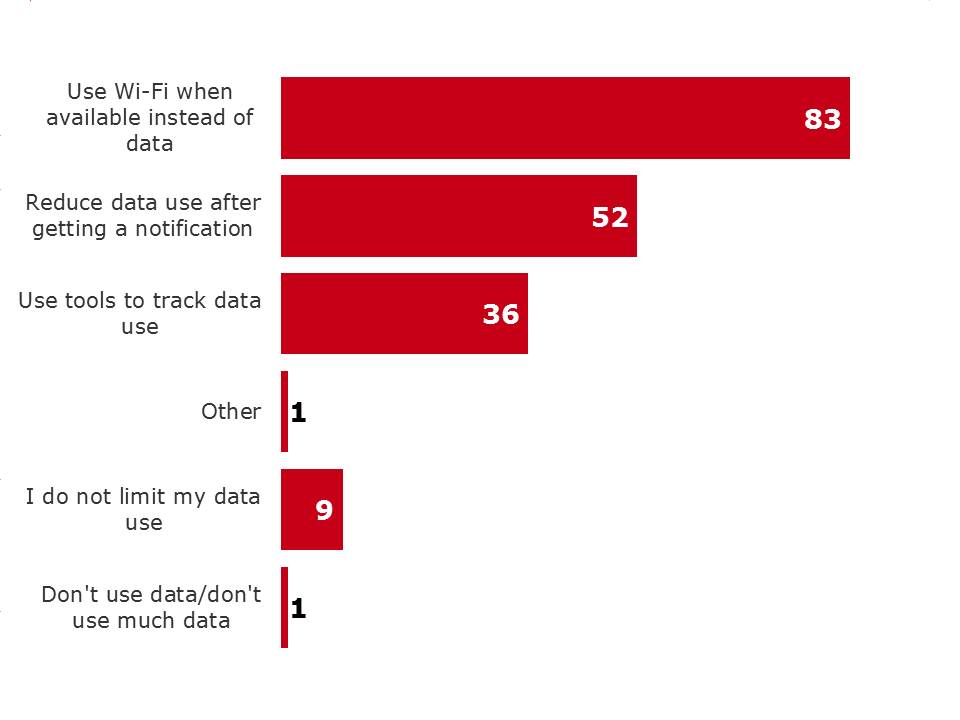
Many Canadians try to manage or limit their data use. The extent of the activities undertaken to manage the data varies and mostly involves using Wi-Fi when available rather than actively monitoring or reducing data use. Not unexpectedly, those who have limited data plans are much more likely to actively manage and limit their data (22%) compared to those with an unlimited plan (5%).
Among all Canadians with data plans, only one-third (36%) of Canadians use tools to track their data use while half (52%) will reduce their data use upon notification of nearing their limit. Many Canadians (83%) will however switch to Wi-Fi when it is available.
Exhibit 4.1.2.a. Activities done to manage or limit data use
Activities done to manage or limit data use - text version
QB5a. Which of the following activities, if any, do you do to manage or limit your data use? Select all that apply.
Base: Respondents who have data included in the wireless plan, fall 2016 (n=831)
Not unexpectedly, those with limited data plans are more likely than those with unlimited data plans to use tools to track their data use (39% vs 23%), reduce their usage when nearing their limit (56% vs 35%) and use Wi-Fi when available (88% vs 68%).
Older Canadians (55+) are least likely to manage or limit their data. In fact, older Canadians (55+) are twice as likely not to manage their data as middle aged Canadians (35-54) and four and a half times more likely than younger Canadians (18-34) not to manage their data.Exhibit 4.1.2.b. Activities done to manage or limit data use by age and data usage
| Activities done to manage or limit data use | Total | Age | Data Usage | |||
|---|---|---|---|---|---|---|
| 18-34 | 35-54 | 55+ | Unlimited | Limited | ||
| Base=actual | (831) % |
(170) % |
(327) % |
(326) % |
(145) % |
(660) % |
| Use Wi-Fi when available instead of data | 83 | 91* | 82* | 69 | 68 | 88 |
| Reduce data use after getting a notification | 52 | 60* | 53* | 33 | 35 | 56 |
| Use tools to track data use | 36 | 45* | 32* | 23 | 23 | 39* |
| Other (specify) | 1 | - | 2 | - | 1 | 1 |
| I do not limit my data use | 9 | 4 | 9* | 18* | 22* | 5 |
| Don't use data/don't use much data | 1 | - | 1 | 2* | 1 | 1 |
*Represents significant difference at the 95% confidence level.
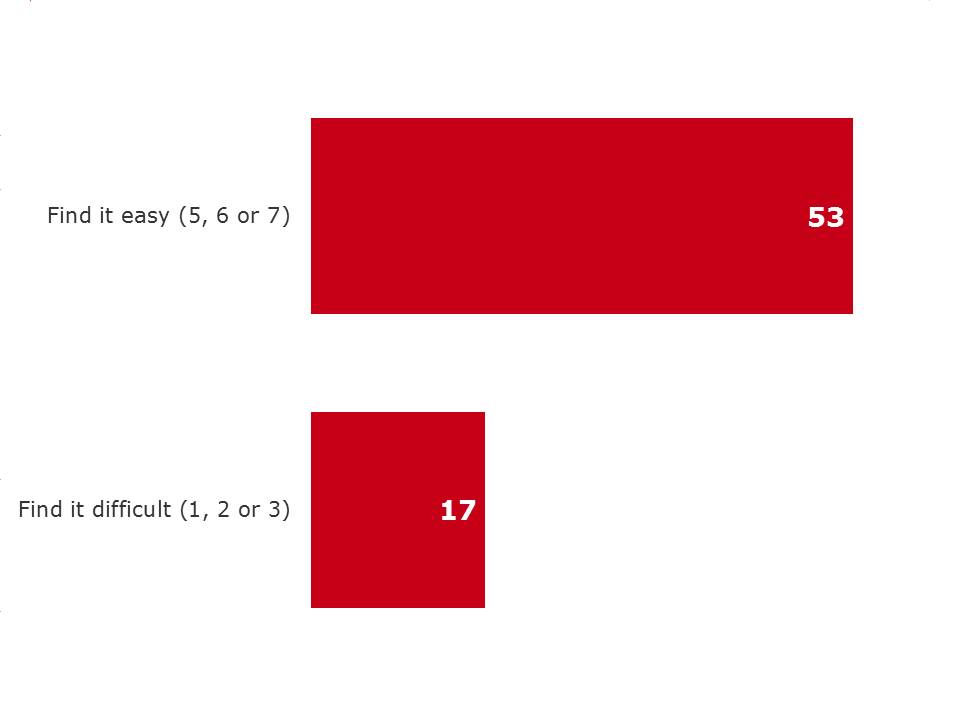
Most Canadians find it easy to manage their data each month. This is especially true among Francophones and older Canadians. Three in four Canadians (74%) consider it easy (5, 6 or 7 on a scale of 1-7) to manage their data each month. Francophones find managing data easier than non-Francophones (84% vs 68-72%). And, older Canadians (55+) find it easier than younger Canadians (78% vs 71-76%). An interesting finding given older Canadians are less likely to actively manage their data. It is possible here that older Canadians believe it easy to manage because they do not use much data and thus dont bump up against their data limits.
Not unexpectedly, those who have experienced bill shock find it more difficult to manage data use (1, 2 or 3 on a scale of 1-7) (31% vs 10%) as do those who have lodged a complaint (28% vs 12%).
Many Canadians with family or shared plans (61%) also consider managing data use among others on the plan easy, but less than the overall average for all Canadians with data on their wireless plan (74%). Similarly however, those who have experienced bill shock find it more difficult to manage data use among plan members (1, 2 or 3 on a scale of 1-7) (59% vs 15%) as do those who have lodged a complaint (38% vs 20%).
Exhibit 4.1.3.a. Level of difficulty managing data use each month among those with data and those with data in a shared plan
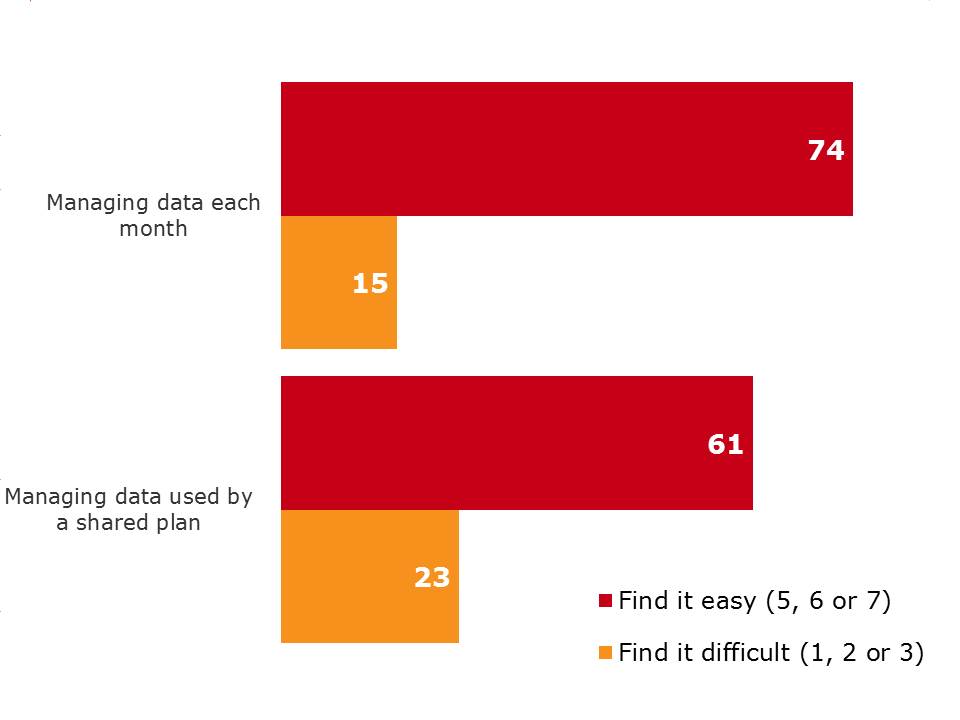
QB6. How easy do you find it to manage your data use each month? Please use a 7-point scale where 1 means extremely difficult and 7 means extremely easy.
Base: Respondents who have data included in the wireless plan, fall 2016 (n=831)
QB7. How easy do you find it to manage the data used by the other people sharing your plan to avoid data overage fees?
Base: Respondents who have data included and its a shared plan, fall 2016 (n=291)
Exhibit 4.1.3.b. Level of difficulty managing data use each month by age and language
| Level of difficulty to manage data use | Total | Age | Language | ||||
|---|---|---|---|---|---|---|---|
| 18-34 | 35-54 | 55+ | English | French | Other | ||
| Base=actual | (831) % |
(170) % |
(327) % |
(326) % |
(529) % |
(163) % |
(133) % |
| Find it easy to manage data each month (5, 6 or 7) | 74 | 71 | 76 | 78 | 72 | 84* | 68 |
| Find it difficult to manage data each month (1, 2 or 3) | 15 | 18 | 12 | 11 | 16 | 8 | 19* |
*Represents significant difference at the 95% confidence level.
Exhibit 4.1.3.c. Level of difficulty managing data use each month by bill shock and lodged complaint
| Level of difficulty to manage data use | Total | Bill Shock | Lodged Complaint | ||
|---|---|---|---|---|---|
| Yes | No | Yes | No | ||
| Base=actual | (831) % |
(197) % |
(626) % |
(165) % |
(663) % |
| Find it easy to manage data each month (5, 6 or 7) | 74 | 59 | 79* | 60 | 78* |
| Find it difficult to manage data each month (1, 2 or 3) | 15 | 31* | 10 | 28* | 12 |
*Represents significant difference at the 95% confidence level.
Exhibit 4.1.3.d. Level of difficulty to manage data on a shared plan each month by bill shock and lodged complaint
| Level of difficulty to manage data used by shared plan | Total | Bill Shock | Lodged Complaint | ||
|---|---|---|---|---|---|
| Yes | No | Yes | No | ||
| Base=actual | (291) % |
(77) % |
(213) % |
(57) % |
(233) % |
| Find it easy to manage data used by a shared plan each month (5, 6 or 7) | 61 | 32 | 74* | 51 | 64 |
| Find it difficult to manage data used by a shared plan each month (1, 2 or 3) | 23 | 49* | 14 | 38* | 20 |
*Represents significant difference at the 95% confidence level.
While many Canadians consider it easy to manage their data, a considerable portion (46%) have paid data overages in the past 12 months suggesting that some Canadians are in fact struggling to manage their data in a way that prevents additional fees.
More than a quarter (28%) of the population have paid data overage fees one or two times in the past year while another 17 per cent have paid data overages three or more times in the past 12 months. Interestingly, paying data overage fees is unrelated to any demographic or plan type. It appears that paying data overage fees occurs equally among all types of Canadians and all types of wireless plans.
Exhibit 4.1.4.a. Data overage fees paid in the past 12 months
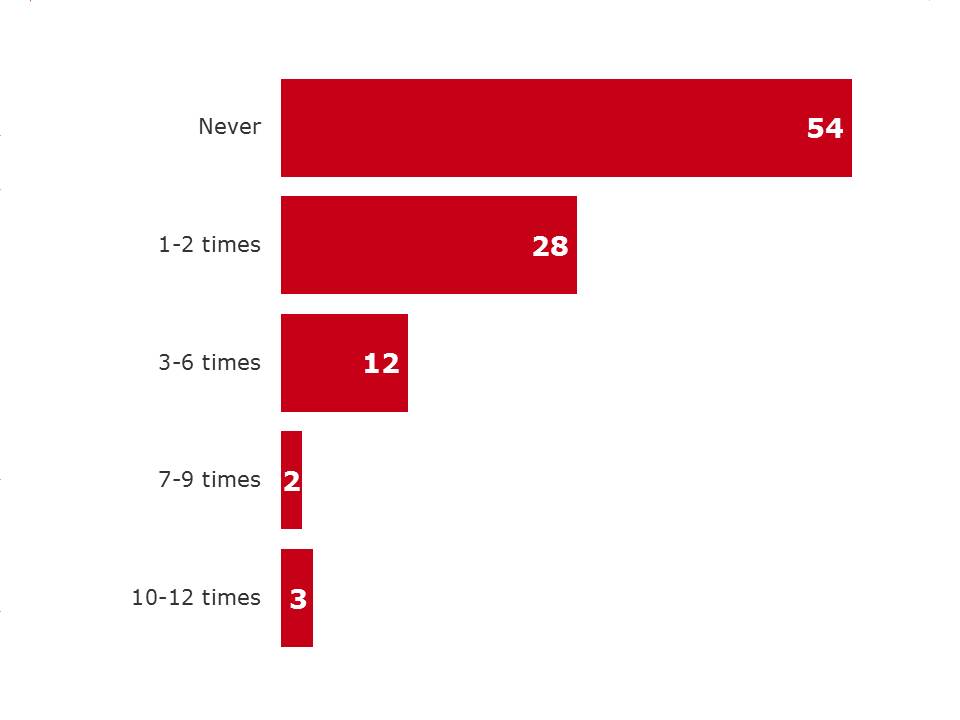
Data overage fees paid in the past 12 months - text version
QB8. In the past 12 months, how often have you paid data overage fees?
Base: Respondents who have data included in the wireless plan, fall 2016 (n=831)
Not unexpectedly, those who have made a complaint or experienced bill shock are also more likely to have paid data overage fees (57% vs 39% and 63% vs 25% respectively).
Exhibit 4.1.4.b. Data overage fees paid in the past 12 months by bill shock and lodged complaint
| Data overage fees paid in the past 12 months | Total | Bill Shock | Lodged Complaint | ||
|---|---|---|---|---|---|
| Yes | No | Yes | No | ||
| Base=actual | (831) % |
(197) % |
(626) % |
(165) % |
(663) % |
| Never | 54 | 25 | 63* | 39 | 57* |
| 1-2 times | 28 | 33 | 26 | 29 | 28 |
| 3-6 times | 12 | 28* | 7 | 21* | 10 |
| 7-9 times | 2 | 4 | 2 | 4 | 2 |
| 10-12 times | 3 | 9* | 1 | 6* | 2 |
*Represents significant difference at the 95% confidence level.
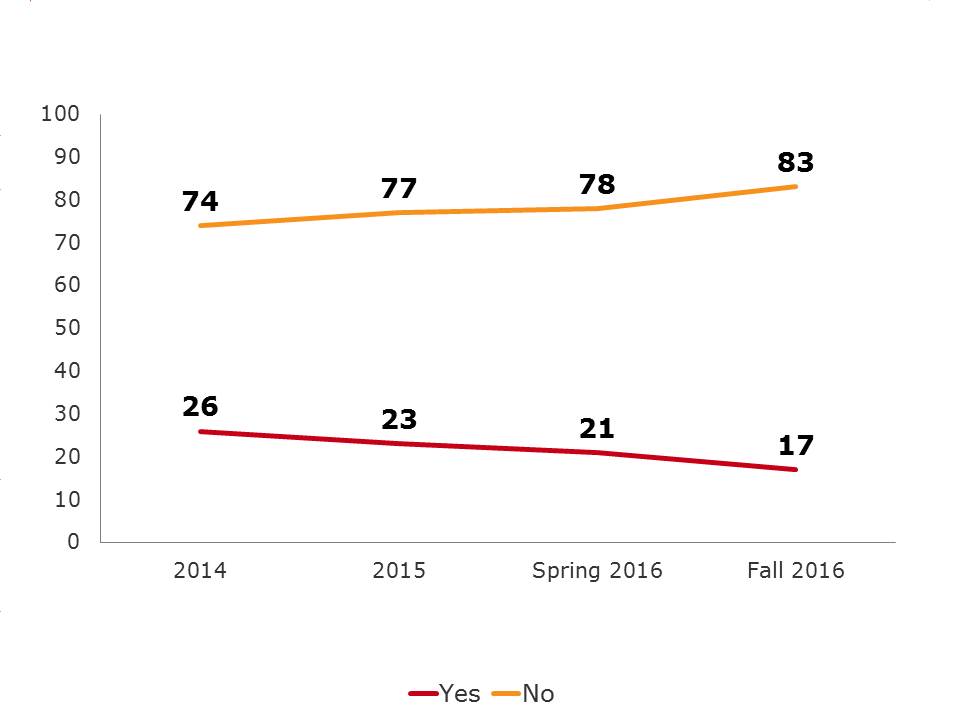
While the incidence of experiencing bill shock continues to decline since the implementation of the Wireless Code, a small but significant portion of the population continues to experience bill shock in the Fall of 2016 (21%). This suggest that while Canadians are becoming better at understanding and managing their wireless contract and associated fees, there continues to be room for improvement in this area.
Exhibit 4.2.1.a. Experienced bill shock
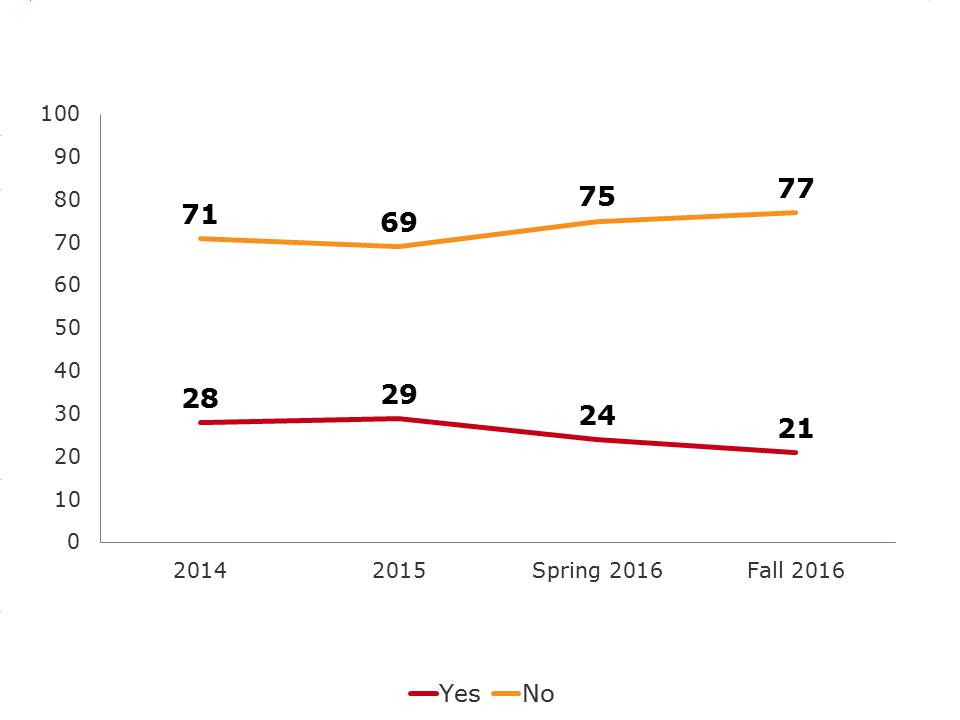
Experienced bill shock - text version
QB10/B6. During the last year, have you experienced bill shock, meaning a surprisingly high bill?
Base: Respondents who own a cell phone, fall 2016 (n=1,277), total respondents Spring 2016 (n=925), 2015 (n=1,005), 2014 (n=1,016)
While no single activity (e.g., social media, internet, navigation, etc.) is specifically related to increased bill shock, Canadians who use their wireless plan for a larger variety of activities are more likely to experience bill shock. More specifically 26-31 per cent of Canadians who used their plan to undertake 7 or more different types of activities in the past month experienced bill shock compared to only 11-15 per cent for those who conducted six or fewer activities in the past month. This suggests that heavier users of wireless plans are more likely to experience bill shock than lighter users.
Not unexpectedly, younger Canadians (18-54) are substantially more likely to experience bill shock than their older counterparts (24-25% vs 15%). As are those with higher household incomes ($150K+) (36% vs 16-22%), those with family plans (28% vs 19%) and those with limited data (27% vs 14%). Quebec residents (12% vs 19-31%) and Francophones (14% vs 24%) are least likely to experience bill shock.
Results suggest that international roaming charges could be the primary reason for bill shock among households with higher incomes ($150K+) (36% vs 7-26%) however base sizes are quite small and thus these differences are not statistically significant.Exhibit 4.2.1.b. Experienced bill shock by age and income
| Experienced bill shock | Total | Age | Income | ||||||
|---|---|---|---|---|---|---|---|---|---|
| 18-34 | 35-54 | 55+ | <$40K | $40K- <$60K | $60K- <$100K | $100K- <$150K | $150K+ | ||
| Base=actual | (1,277) % |
(198) % |
(421) % |
(643) % |
(242) % |
(195) % |
(304) % |
(162) % |
(139) % |
| Yes | 21 | 24* | 25* | 15 | 16 | 19 | 17 | 22 | 36* |
| No | 77 | 75 | 73 | 84* | 82* | 80* | 81* | 75 | 63 |
*Represents significant difference at the 95% confidence level.
Exhibit 4.2.1.c. Experienced bill shock by language and region
| Experienced bill shock | Total | Language | Region | |||||||
|---|---|---|---|---|---|---|---|---|---|---|
| English | French | Other | Atl | Que | Ont | Pra | BC | Terr | ||
| Base=actual | (1,277) % |
(795) % |
(280) % |
(189) % |
(101) % |
(275) % |
(393) % |
(304) % |
(151) % |
(53) % |
| Yes | 21 | 24* | 14 | 24 | 27* | 12 | 24* | 19 | 31* | 31* |
| No | 77 | 75 | 86* | 75 | 73 | 87* | 74 | 80 | 68 | 69 |
*Represents significant difference at the 95% confidence level.
Exhibit 4.2.1.d. Experienced bill shock by plan and data
| Experienced bill shock | Total | Plan | Data | ||
|---|---|---|---|---|---|
| Family Plan | Individual Plan | Unlimited | Limited | ||
| Base=actual | (1,277) % |
(368) % |
(892) % |
(145) % |
(660) % |
| Yes | 21 | 28* | 19 | 14 | 27* |
| No | 77 | 70 | 80* | 85* | 72 |
*Represents significant difference at the 95% confidence level.
Similar to previous years,Footnote [5]data overage fees are the primary cause of bill shock (48%) followed by international roaming fees (17%). Call minutes overage fees are also a leading cause of bill shock in the Fall of 2016 (14%). This suggests that Canadians are struggling to:
These three areas should be considered moving forward when reviewing and/or updating the Wireless Code.
Exhibit 4.2.1.e. Main reason for bill shock
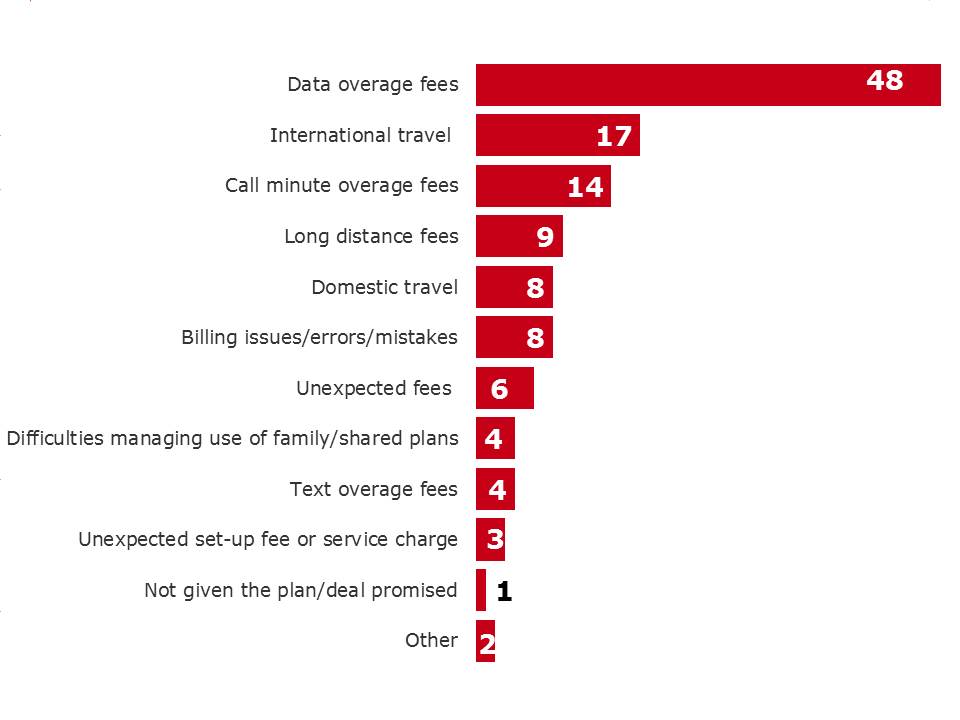
Main reason for bill shock - text version
QB10a/B6a. . What was the main reason for the bill shock you experienced?
Base: Those who experienced ‘bill shock, fall 2016 (n=250), Spring 2016 (n=208), 2015 (n=289), 2014 (n=282)
The amount of the unexpected charges varies from less than $50 to over $1,000 per billing cycle. The large majority of the unexpected charges (64%) however, are $100 or less.
Among those who indicated the bill shock was due to data overage fees, we see that the majority (74%) were charged more than $50. This is particularly true among those with family or shared plans where more (87%) were charged over $50 compared to those with individual plans (64%). This finding suggests that those with family or shared plans are having more difficulty managing their data than those with individual plans.
Exhibit 4.2.1.f. Amount of unexpected charges on bill among those who have experienced a bill shock
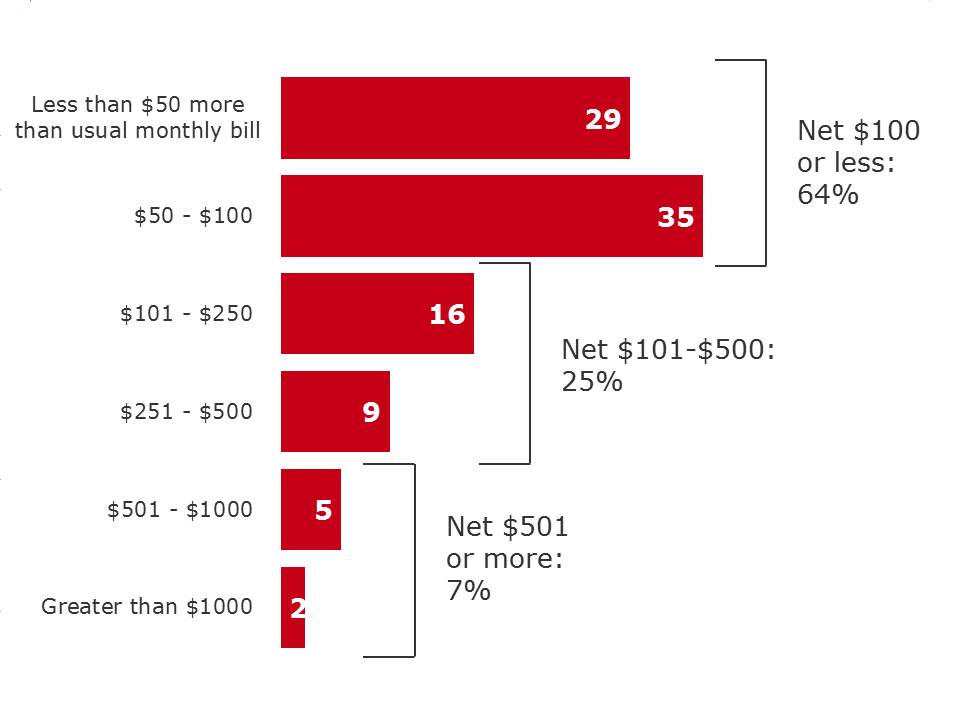
Amount of unexpected charges on bill among those who have experienced a bill shock - text version
Q10b. What was the amount of the unexpected charges on your bill?
Base: Respondents who have experienced a “bill shock”, fall 2016 (n=285)
Exhibit 4.2.1.g. Amount of unexpected charges on bill among those who had data overage fees by plan
| Amount of unexpected charges on bill | Total | Plan | |
|---|---|---|---|
| Family Plan | Individual Plan | ||
| Base=actual | (109) % |
(50) % |
(59) % |
| Less than $50 more than usual monthly bill | 26 | 13 | 36* |
| $50 - $100 | 35 | 38 | 33 |
| $101 - $250 | 16 | 16 | 16 |
| $251 - $500 | 5 | 8 | 3 |
| $501 - $1000 | 8 | 14 | 4 |
| Greater than $1000 | 2 | 1 | 2 |
*Represents significant difference at the 95% confidence level.
Many Canadians also find it challenging to manage roaming fees while travelling. Only half of Canadians (53%) find it easy (5, 6 or 7 on a scale of 1-7) while the other half do not find it easy. Some (17%) actually find it quite difficult (1, 2 or 3 on a scale of 1-7).
Exhibit 4.2.2.a. Level of difficulty managing roaming charges when travelling
Level of difficulty managing roaming charges when travelling - text version
QB9. If you use your plan while traveling, you may be charged roaming fees.
How easy do you find it to manage your roaming charges when you are traveling? Please use a 7-point scale where 1 means extremely difficult and 7 means extremely easy.
Base: Respondents who own a cell phone, fall 2016 (n=1,277)
Not unexpectedly, those who find it easy to manage data are also more likely to find it easy to manage roaming fees (65% vs 45%). Anglophones and Francophones are also more likely to find it easy to manage roaming fees compared to those who speak another language at home (54% vs 46%) though this is likely due to an increased likelihood of international travel for those speaking other languages rather than the language itself. As well, those with Postpaid or family plans are also more likely to consider it easier to manage roaming than pre-paid or individual plans (56 % vs 34% and 61% vs 49% respectively).
Exhibit 4.2.2.b. Level of difficulty managing roaming charges when travelling by language, pre- or post-paid and plan
| Level of difficulty managing roaming charges when travelling | Total | Language | Pre- or Post-Paid | Plan | ||||
|---|---|---|---|---|---|---|---|---|
| English | French | Other | Postpaid | Prepaid | Family Plan | Individual Plan | ||
| Base=actual | (1,277) % |
(795) % |
(280) % |
(189) % |
(1,041) % |
(217) % |
(368) % |
(892) % |
| Find it easy (5, 6 or 7) | 53 | 55 | 54 | 46 | 56* | 34 | 61* | 49 |
| Find it difficult (1, 2 or 3) | 17 | 17 | 12 | 21 | 16 | 21 | 17 | 16 |
*Represents significant difference at the 95% confidence level.
The incidence of Canadians making complaints about their wireless services is declining rapidly. Since 2014, nine per cent fewer Canadians have made complaints and from the Spring of 2016 alone, four per cent fewer Canadians have made complaints. This represents an overall decrease in complaints by approximately 35 per cent since 2014 with the most rapid decline occurring from Spring of 2016 (down by 20%).
Exhibit 4.3.1.a. Wireless service complaint made in the past 12 months
Wireless service complaint made in the past 12 months - text version
QB11/QB4. Have you made a complaint about your wireless services in the past 12 months?
Base: Respondents who own a cell phone, fall 2016 (n=1,277), total respondents, Spring 2016 (n=925), 2015 (n=1,005), 2014 (n=1,016)
Quebeckers are least likely to make complaints (4% vs 14-24%) compared to those in other regions of Canada. This is likely due to the provincial consumer protection legislation that Quebec has had in place since 2009 - Quebecs Bill 60.
Not unexpectedly, those who find managing data difficult are more likely to make a complaint (37% vs 17%) as are those who have experienced bill shock (41% vs 10%).Exhibit 4.3.1.b. Wireless service complaint made in the past 12 months by region, difficulty managing data and bill shock
| Wireless service complaint made in the past 12 months | Total | Region | Difficulty managing data | Bill shock | |||||||
|---|---|---|---|---|---|---|---|---|---|---|---|
| Atl | Que | Ont | Pra | BC | Terr | Easy | Difficult | Yes | No | ||
| Base=actual | (1,277) % |
(101) % |
(275) % |
(393) % |
(304) % |
(151) % |
(53) % |
(629) % |
(112) % |
(250) % |
(1,012) % |
| Yes | 17 | 14* | 4 | 23* | 17* | 24* | 23* | 15 | 37* | 41* | 10 |
| No | 83 | 85 | 96* | 77 | 83 | 75 | 77 | 84* | 63 | 59 | 90* |
*Represents significant difference at the 95% confidence level.
Those who make complaints about their wireless service, tend to make multiple complaints.
Among the 17 per cent of Canadians who made complaints, an average of 2.88 complaints were made in the twelve months. While a third (34%) of complainants made only one complaint, the remaining (66%) made more than one. Specifically, 25 per cent made two complaints and 41 per cent made three or more complaints.Not unexpectedly, those who find it difficult to manage their data make more complaints (3.79 vs 2.21 complaints) as do those who are dissatisfied with the resolution of their complaint compared to those who were satisfied (3.47 vs 2.29 complaints).
Exhibit 4.3.1.c. Number of complaints made in the past 12 months
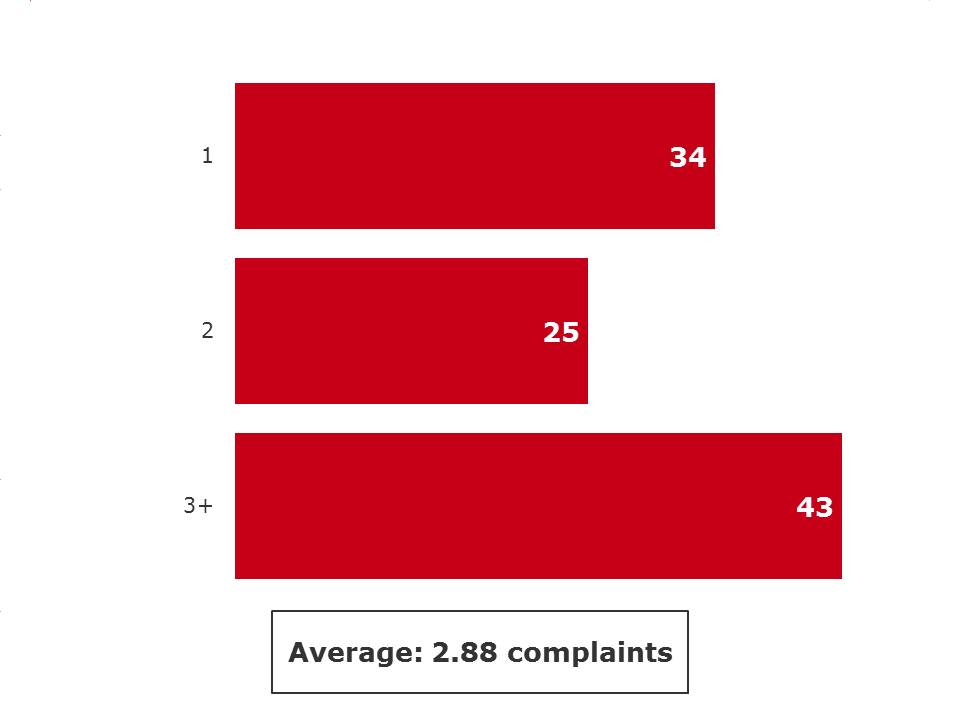
Number of complaints made in the past 12 months - text version
Q11a. How many complaints have you made about your wireless service during the past 12 months?
Base: Respondents who made a complaint about the wireless services in the past 12 months, fall 2016 (n=203)
Exhibit 4.3.1.d. Number of complaints by difficulty managing data and complaint resolution
| Number of complaints | Total | Difficulty managing data | Complaint Resolution | ||
|---|---|---|---|---|---|
| Easy | Difficult | Satisfied | Dissatisfied | ||
| Base=actual | (203) % |
(100) % |
(44) % |
(86) % |
(90) % |
| 1 | 34 | 37 | 24 | 38 | 29 |
| 2 | 25 | 33 | 17 | 32 | 24 |
| 3+ | 43 | 30 | 58 | 30 | 48 |
| Average | 2.88 | 2.21 | 3.79* | 2.29 | 3.47* |
*Represents significant difference at the 95% confidence level.
There are four primary reasons that Canadians complain about their wireless service:
Few factors, demographic or otherwise impact the reason for the complaint. Age however, does impact data charge complaints - those who are 18-54 are more likely to complain about data charges, most likely a function of increased use of data services by this cohort.
Exhibit 4.3.1.e. Reason for complaints by age
| Experienced bill shock | Total | Age | ||
|---|---|---|---|---|
| 18-34 | 35-54 | 55+ | ||
| Base=actual | (203) % |
(39) % |
(80) % |
(83) % |
| Incorrect charge on your bill | 45 | 42 | 45 | 51 |
| Data charges | 32 | 42* | 35* | 10 |
| Inadequate quality of service | 25 | 25 | 26 | 24 |
| Misleading information about the terms of your contract | 23 | 21 | 24 | 23 |
| Change to contract without notice | 5 | 7 | 2 | 4 |
| Unlocking phone | 3 | 3 | 2 | 3 |
| Legitimacy or amount of early cancellation fee | 2 | 3 | 1 | 1 |
| Credit or refund not received | 1 | 2 | - | 2 |
| Breach of contract | 1 | - | 3 | 1 |
| 30 day cancellation policy | - | - | 1 | - |
| Credit reporting | - | - | 1 | - |
| Other | 5 | 4 | 5 | 6 |
*Represents significant difference at the 95% confidence level.
Consistent with findings from the Spring 2016 research, the vast majority of Canadians who make a complaint make the complaint to their service provider (97%)Footnote [6].
Exhibit 4.3.1.f. Complaints to wireless service provider
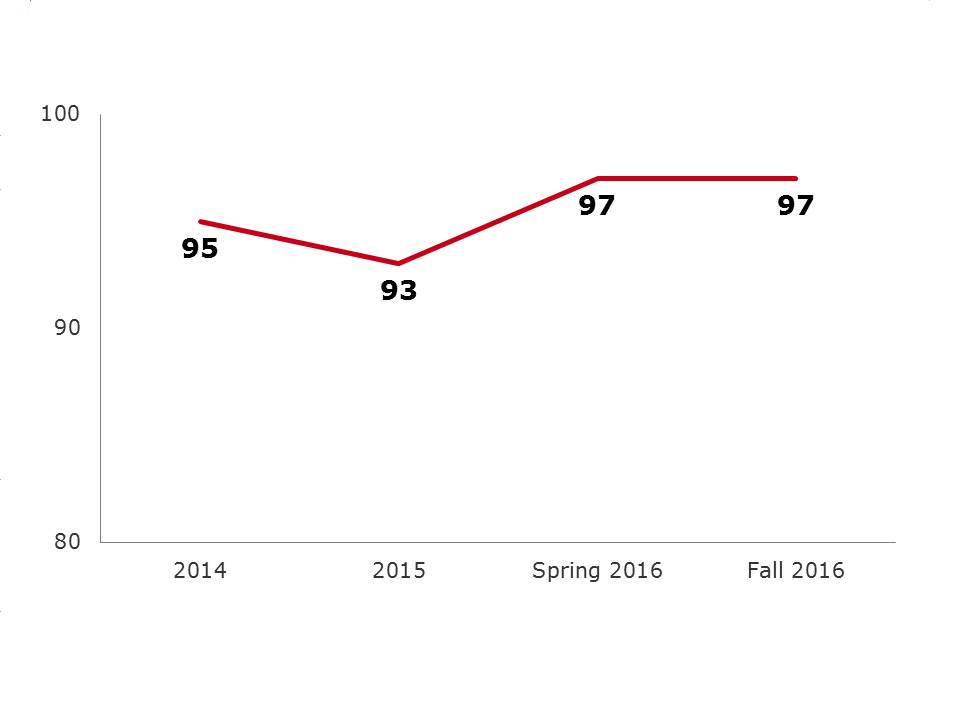
Complaints to wireless service provider - text version
QB11c. Did you complain to your service provider? (2016)
Base: Those who made a complaint, fall 2016 (n=203)
QB4a. (IF YES) Who did you complain to? (2014-2016)
Base: Those who made a complaint Spring 2016 (n=179), 2015 (n=222), 2014 (n=258)
Canadians do not recall being informed of their right to complain to the CCTS . Only seven per cent of Canadians can recall being informed of their right to complain to the CCTS suggesting an alternative approach to informing Canadians about the CCTS may be required.
Exhibit 4.3.2.a. Informed of right to complain to the CCTS by service provider
Informed of right to complain to the CCTS by service provider - text version
QB11d. When dealing with your complaint, did your service provider inform you of your right to complain to the Commissioner for Complaints for Telecommunications Services (CCTS ), the independent agency created to help you with complaints about phone and internet services?
Base: Respondents who made a complaint to a service provider, fall 2016 (n=196)
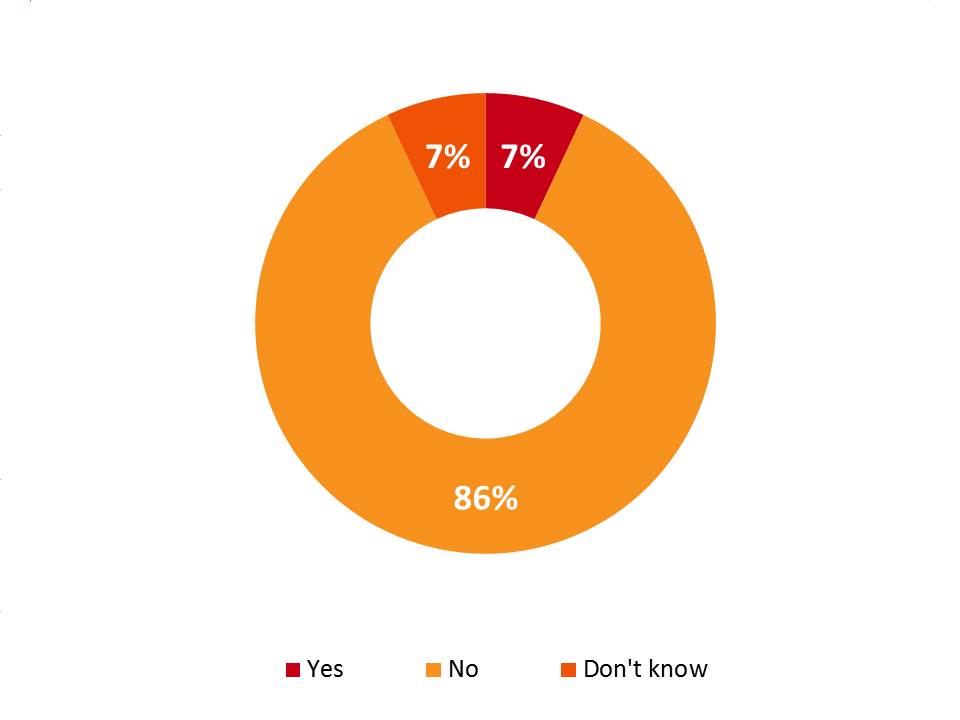
Very few (2%) Canadians raise their complaint with the CCTS . The main reason being they are simply unaware of the CCTS (69%). This is especially true among younger Canadians (18-34) compared to their older counterparts (35+) (85% vs 52-64%).
Interestingly, a small but significant portion of complainants (21%) do not feel it is worthwhile either because they do not feel it is worth the effort (13%) or do not believe the issue would be resolved (9%).
These findings suggest improvements around informing Canadians about the CCTS are required. All Canadians are supposed to be informed about the CCTS at purchase and on each monthly invoice. Canadians are also informed about the CCTS if a complaint achieves “a second level of escalationFootnote [7] ”. However, few Canadians can recall being informed about the CCTS . Additionally, improvements around the perception of the CCTS could also be made. Nearly one-in three Canadians do not complain to the CCTS as they do not see it as being worthwhile.
Exhibit 4.3.2.b. Raised a complaint with the CCTS and reasons for not raising a complaint
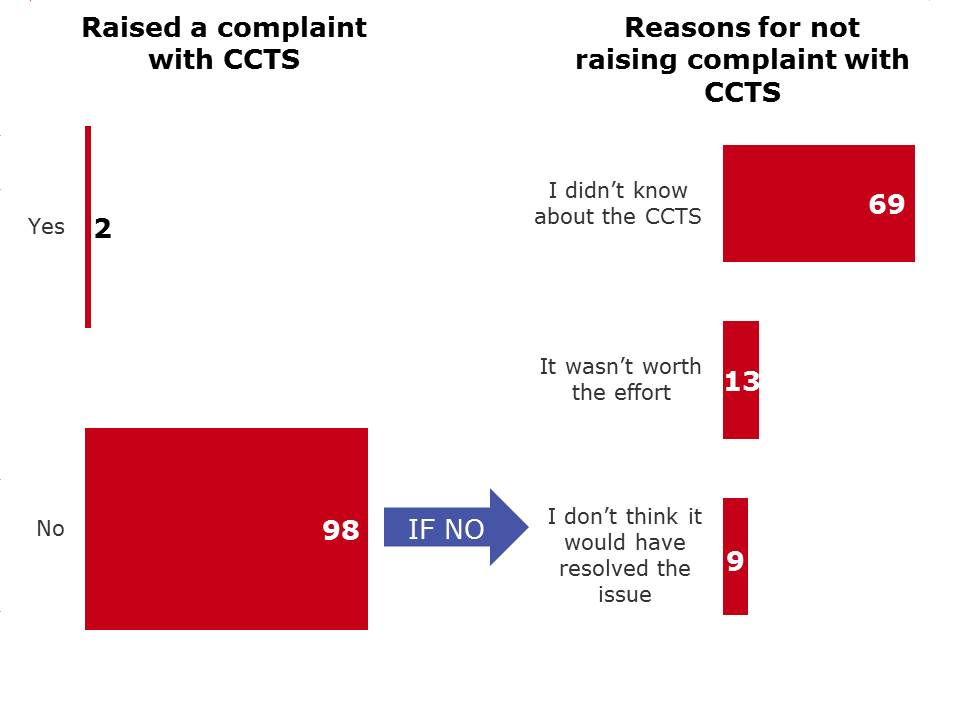
Raised a complaint with the CCTS and reasons for not raising a complaint - text version
QB11e. Did you raise your complaint with CCTS ?
Base: Respondents who made a complaint about the wireless services in the past 12 months, fall 2016 (n=203)
QB11f. Why didnt you raise your complaint to the CCTS ?
Base: Respondents who did not raise the complaint to the CCTS , fall 2016 (n=197)
Exhibit 4.3.2.c. Reasons for not raising a complaint with the CCTS by age
| Reasons for not raising a complaint with CCTS | Total | Age | ||
|---|---|---|---|---|
| 18-34 | 35-54 | 55+ | ||
| Base=actual | (197) % |
(38) % |
(78) % |
(80) % |
| I didn’t know about the CCTS | 69 | 85* | 64 | 52 |
| It wasn’t worth the effort | 13 | 5 | 13 | 24* |
| I don’t think it would have resolved the issue | 9 | 5 | 9 | 15 |
*Represents significant difference at the 95% confidence level.
One in four Canadians do not feel their complaint was resolved indicating there was no resolution or nothing was done to address their complaint. The remainder reported a variety of actions were taken to address the complaint and these included: correcting the billing issues (27%); correcting the issue (not billing related) (27%); financial compensation (18%); apology (6%); cancelled contract (5%) and other (6%).
Exhibit 4.3.3.a. Complaint resolution
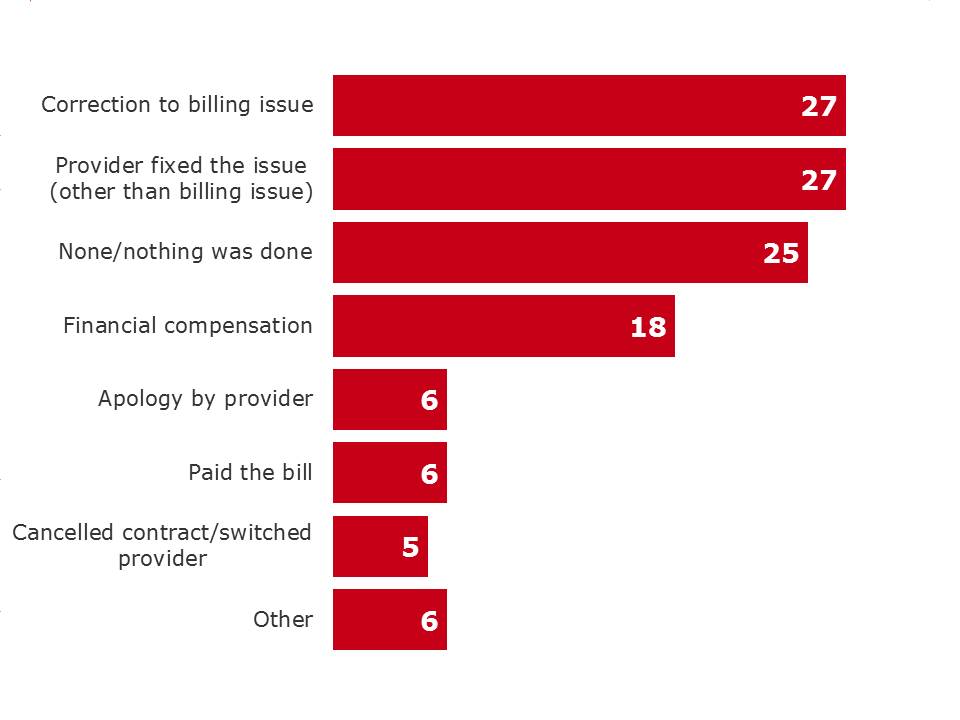
Complaint resolution - text version
Q11g. What was the resolution to your complaint?
Base: Respondents who made a complaint about the wireless services in the past 12 months, fall 2016 (n=203)
Satisfaction among complainants is quite variedFootnote [8]and somewhat limited. Only slightly more than one-third of complainants are satisfied (5, 6 or 7 on a scale of 1-7) with the resolution of their complaint while closer to half (46%) are not satisfied (1, 2 or 3 on a scale of 1-7). Satisfaction is substantially higher among older Canadians (55+) compared to their younger counterparts (59% vs 30-37%). Surprisingly, the resolution provided has little impact on satisfaction however the reason for the complaint does. More specifically, those who experience bill shock were less satisfied (1, 2 or 3 on a scale of 1-7) compared to those who did not (54% vs 36%).
Exhibit 4.3.3.b. Satisfaction with complaint resolution
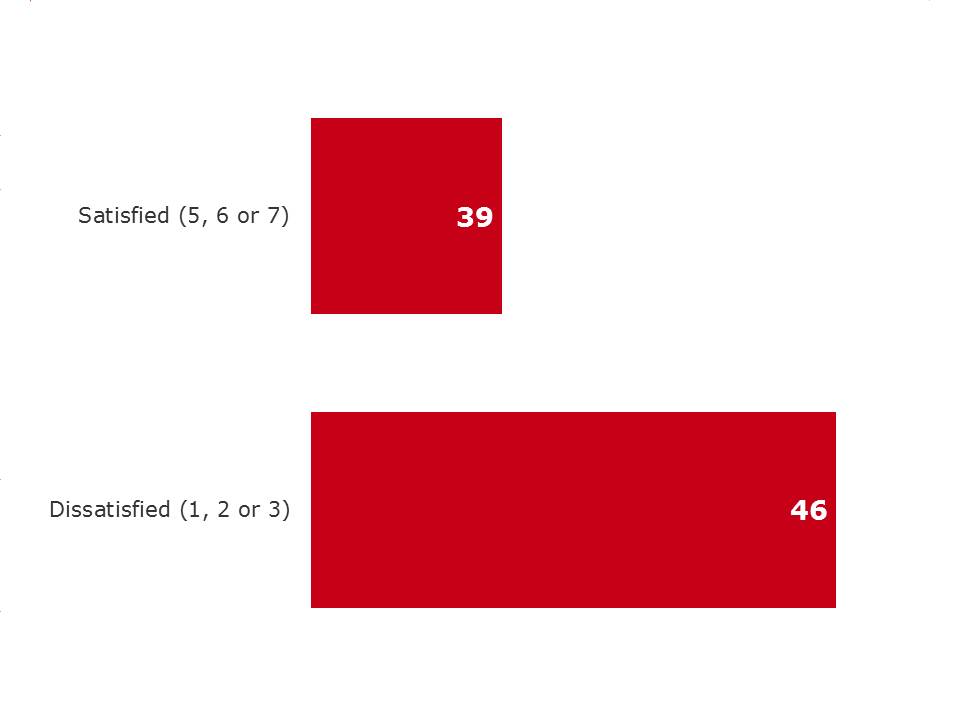
Satisfaction with complaint resolution - text version
QB11h. How satisfied were you with how your complaint was resolved? Please use a 7-point scale where 1 means extremely dissatisfied and 7 means extremely satisfied.
Base: Respondents who made a complaint about the wireless services in the past 12 months, fall 2016 (n=203)
Exhibit 4.3.3.c. Satisfaction with complaint resolution
| Satisfaction with complaint resolution | Total | Age | Bill Shock | |||
|---|---|---|---|---|---|---|
| 18-34 | 35-54 | 55+ | Yes | No | ||
| Base=actual | (203) % |
(39) % |
(80) % |
(83) % |
(106) % |
(95) % |
| Satisfied (5, 6 or 7) | 39 | 30 | 37 | 59* | 33 | 47 |
| Dissatisfied (1, 2 or 3) | 46 | 54* | 46 | 31 | 54* | 36 |
*Represents significant difference at the 95% confidence level.
The majority of Canadians continue to purchase post-paid services in the Fall of 2016.
Exhibit 4.4.1.a. Type of service plan
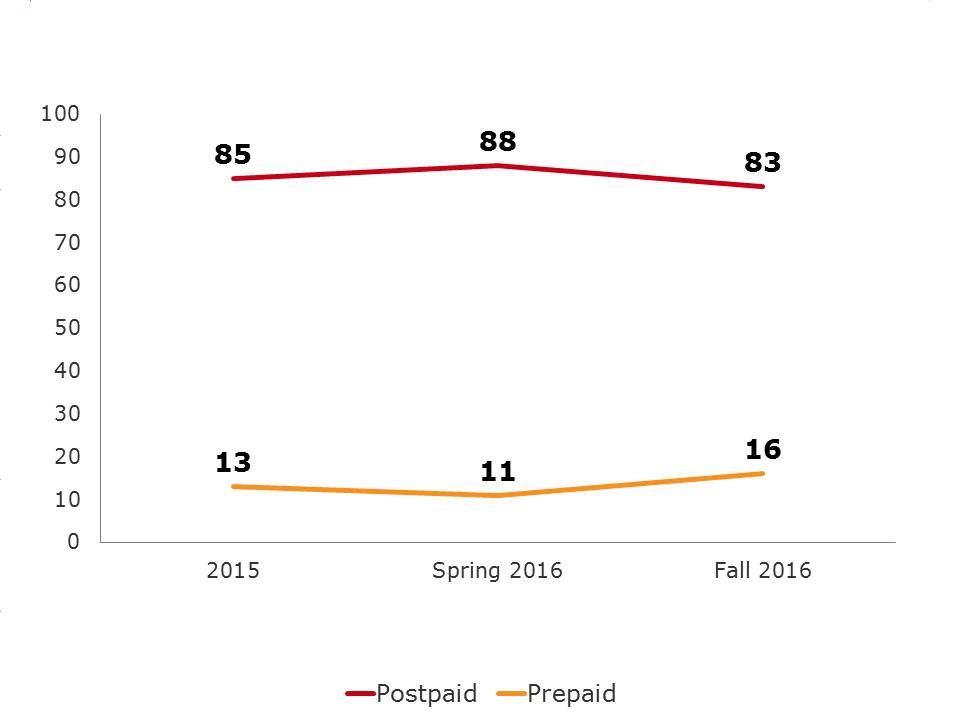
Type of service plan - text version
QB1b/B9b. And is it a monthly plan, or a prepaid or pay-as-you-go plan?
Base: Respondents who own a cell phone, fall 2016 (n=1,277), total respondents Spring 2016 (n=925), 2015 (n=1,005)
Women, Quebeckers and those with lower incomes ($60K) are more likely to choose pre-paid/pay-as-you-go (19% vs 13%; 24% vs 10-19%; and 19-28% vs 7-14%) compared to their counterparts.
Exhibit 4.4.1.b. Type of service plan by gender and region
| Data included in wireless plan | Total | Gender | Region | ||||||
|---|---|---|---|---|---|---|---|---|---|
| Male | Female | Atl | Que | Ont | Pra | BC | Terr | ||
| Base=actual | (1,277) % |
(614) % |
(663) % |
(101) % |
(275) % |
(393) % |
(304) % |
(151) % |
(53) % |
| Postpaid | 83 | 85 | 81 | 80 | 75 | 84* | 89* | 83 | 89* |
| Prepaid/pay-as-you-go | 16 | 13 | 19* | 19 | 24* | 15 | 10 | 17 | 4 |
*Represents significant difference at the 95% confidence level.
Exhibit 4.4.1.c. Type of service plan by income
| Type of service plan | Total | Income | ||||
|---|---|---|---|---|---|---|
| <$40K | $40K-<$60K | $60K-<$100K | $100K-<$150K | $150K+ | ||
| Base=actual | (1,277) % |
(242) % |
(195) % |
(304) % |
(162) % |
(139) % |
| Postpaid | 83 | 80 | 71 | 87* | 93* | 86* |
| Prepaid/pay-as-you-go | 16 | 19* | 28* | 12 | 7 | 14 |
*Represents significant difference at the 95% confidence level.
Canadians are increasingly taking advantage of family/shared plans. Since 2015, there has been an increase in the use of family/shared plans (up 5%).
Exhibit 4.4.1.d. Individual or family/shared plan
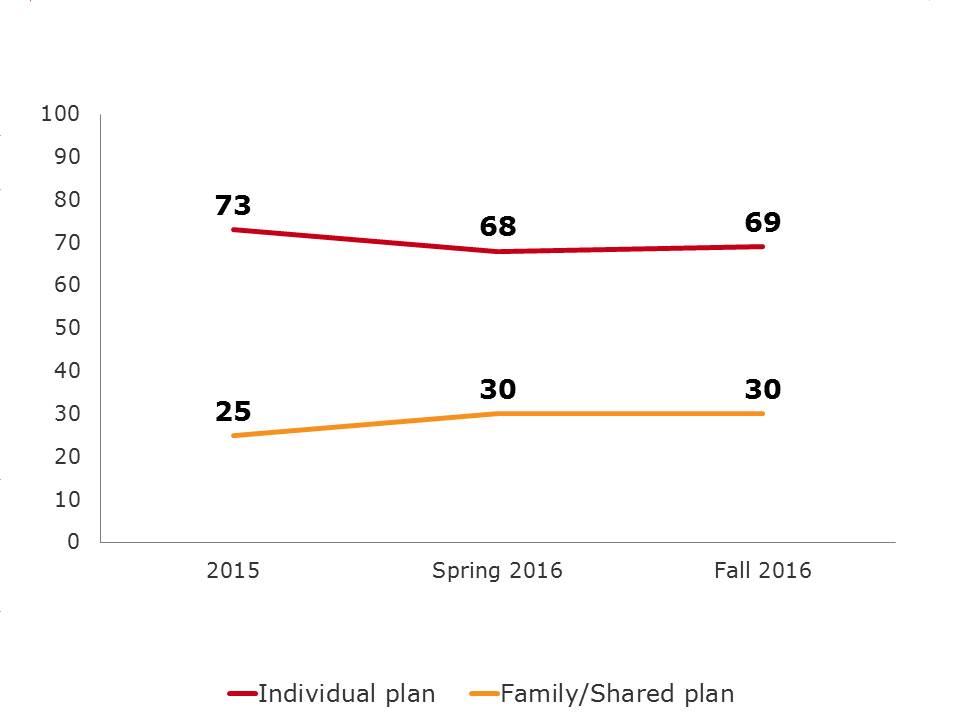
Individual or family/shared plan - text version
QB1a. Is it an individual plan or a family or shared plan?
Base: Respondents who own a cell phone, fall (n=1,277)
QB9a. About the contract or plan for your personal wireless device…Is it an individual plan or a family plan?
Base: Total Respondents Spring 2016 (n=925), 2015 (n=1,005)
Family plans are more prevalent among middle aged Canadians (those 35-54) (36% vs 24-31%). This is largely a function of their increased need for a plan with multiple phones given their increased propensity to have children living at home. Family plans are also more prevalent among higher income Canadians – as household income increases so does the incidence of family/shared plans.
Individual plans are more prevalent among Francophones than Anglophones (74% vs 65%) and are more common among prepaid customers (84% vs 66%).
Exhibit 4.4.1.e. Individual or family/shared plan by age, language and pre- or post-paid
| Individual or family/shared plan | Total | Age | Language | Pre- or Post-Paid | |||||
|---|---|---|---|---|---|---|---|---|---|
| 18-34 | 35-54 | 55+ | English | French | Other | Postpaid | Prepaid | ||
| Base=actual | (1,277) % |
(198) % |
(421) % |
(643) % |
(795) % |
(280) % |
(189) % |
(1,041) % |
(217) % |
| Individual plan | 69 | 68 | 64 | 74* | 65 | 74* | 71 | 66 | 84* |
| Family/shared plan | 30 | 31 | 36* | 24 | 34 | 25 | 27 | 34* | 12 |
*Represents significant difference at the 95% confidence level.
Exhibit 4.4.1.f. Individual or family/shared plan by income
| Type of service plan | Total | Income | ||||
|---|---|---|---|---|---|---|
| <$40K | $40K-<$60K | $60K-<$100K | $100K-<$150K | $150K+ | ||
| Base=actual | (1,277) % |
(242) % |
(195) % |
(304) % |
(162) % |
(139) % |
| Individual plan | 69 | 79 | 74* | 68* | 61 | 50 |
| Family/shared plan | 30 | 19* | 24 | 31* | 39* | 50* |
*Represents significant difference at the 95% confidence level.
As in the Spring of 2016, only a very small proportion of cell phone plans are part of a promotion through an employer or association (6%). Those with higher incomes ($150K +) and university educations are more likely to have a promotion through an employer or association (17% vs 1-9% and 8% vs 3% respectively).
Exhibit 4.4.1.g. Promotion through employer or association
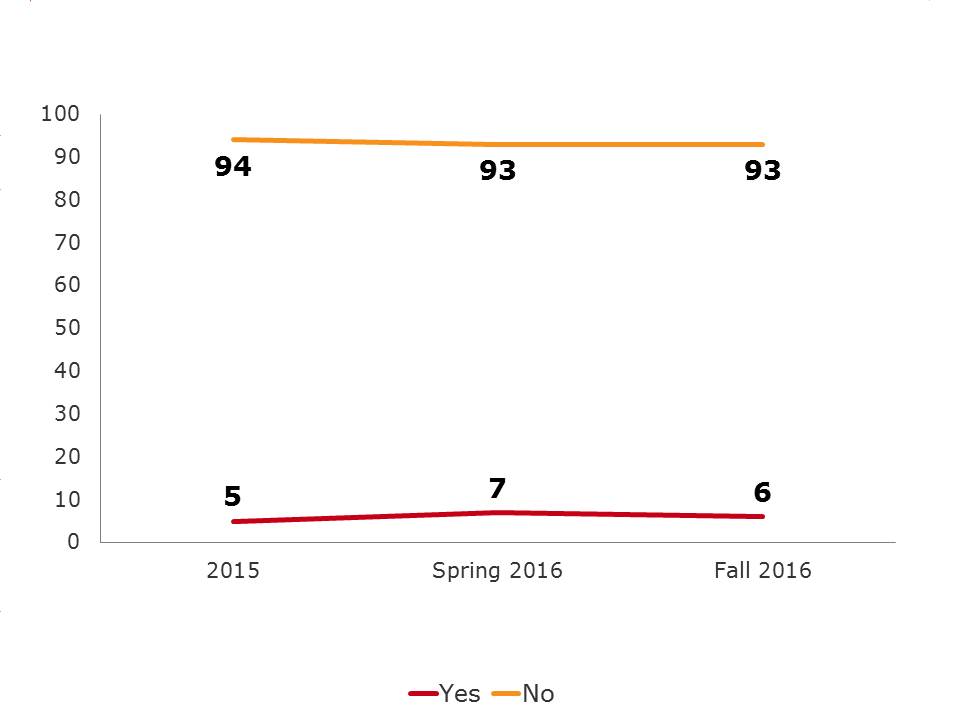
Promotion through employer or association - text version
QB1d. Is your plan part of a promotion through your employer or an association you belong to, sometimes also called an employee purchase plan?
Base: Respondents who own a cell phone fall 2016 (n=1,277)
QB9d. And finally, is your plan part of a promotion through your employer or an association you belong to, sometimes also called an employee purchase plan?
Base: Total Respondents Spring 2016 (n=925), 2015 (n=1,005)
Exhibit 4.4.1.h. Promotion through employer or association by education and income
| Promotion through employer or association | Total | Income | Education | ||||||
|---|---|---|---|---|---|---|---|---|---|
| <$40K | $40K-<$60K | $60K-<$100K | $100K-<$150K | $150K+ | High school or less | College | University or more | ||
| Base=actual | (1,277) % |
(242) % |
(195) % |
(304) % |
(162) % |
(139) % |
(356) % |
(340) % |
(560) % |
| Yes | 6 | 1 | 5 | 4 | 9* | 17* | 3 | 3 | 8* |
| No | 93 | 99* | 95* | 95* | 91 | 81 | 95 | 96* | 92 |
*Represents significant difference at the 95% confidence level.
The composition of service features on wireless plans has remained relatively stable. The majority of cell phone plans include text messaging (90%), calling minutes (88%), and data (72%).
Very little movement has been seen since 2015 with regard to the composition of service features on wireless plans. Text messaging (90% vs. 90% in 2015), calling minutes (88% vs. 87% in 2015), and to a somewhat lesser extent, data (72% vs. 70% in 2015), are all included in the majority of cell phone plans.
Exhibit 4.4.2.a. Service features
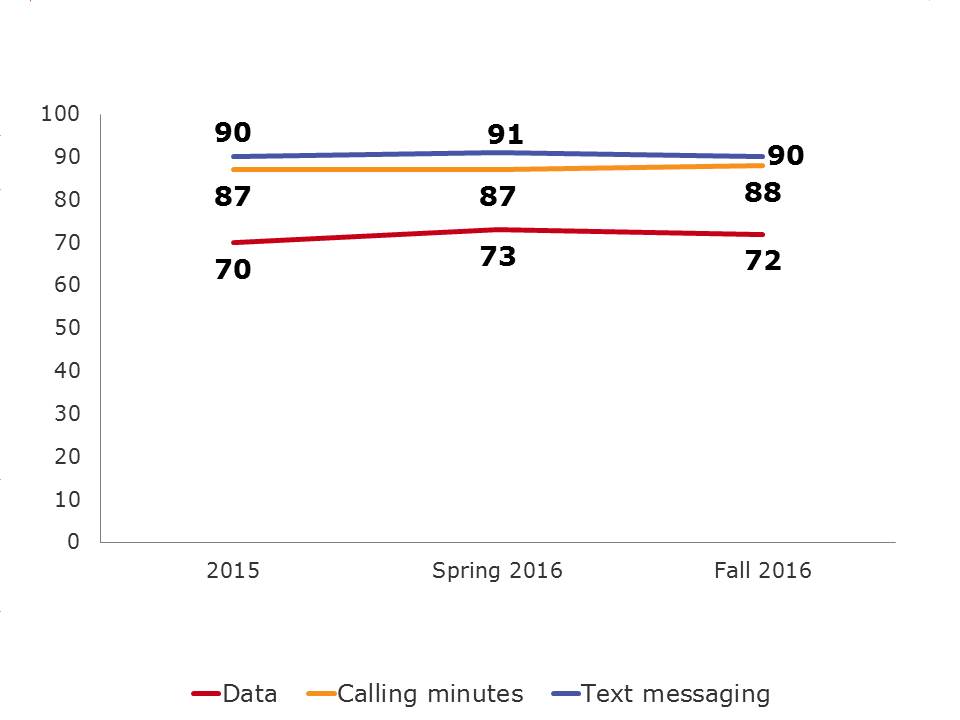
Service features - text version
QB2a. Which of the following are included in your wireless plan?
Base: Respondents who own a cell phone fall 2016 (n=1,277)
QB9c1. Are Calling minutes included as part of your plan?
QB9c2. Is Text messaging included as part of your plan?
QB9c3. Is Data included as part of your plan?
Base: Total Respondents Spring 2016 (n=925), 2015 (n=1,005)
Postpaid plans are more likely than prepaid plans to have each service feature (minutes 90% vs 78%; text 93% vs 77%; data 78% vs 40%) while family plans are more likely than individual plans to have text and data (text 97% vs 88%; data 84% vs 67%).
Not unexpectedly, younger Canadians (18-54) are more likely to have text (94-98% vs 77%) included in their wireless plan.Exhibit 4.4.2.b. Service features by age, plan and pre- or post-paid
| Service features | Total | Age | Plan | Pre- or Post-Paid | ||||
|---|---|---|---|---|---|---|---|---|
| 18-34 | 35-54 | 55+ | Family | Individual | Postpaid | Prepaid | ||
| Base=actual | (1,277) % |
(198) %> |
(421) % |
(643) % |
(368) % |
(892) % |
(1,041) % |
(217) % |
| Calling minutes | 88 | 89 | 92* | 83 | 93* | 86 | 90* | 78 |
| Text messages | 90 | 98* | 94* | 77 | 97* | 88 | 93* | 77 |
| Data | 72 | 85* | 78* | 51 | 84* | 67 | 78* | 40 |
*Represents significant difference at the 95% confidence level.
Most Canadians (82%) with data included in their wireless plan have limited amounts of data.
Exhibit 4.4.2.c. Plan include limited or unlimited data
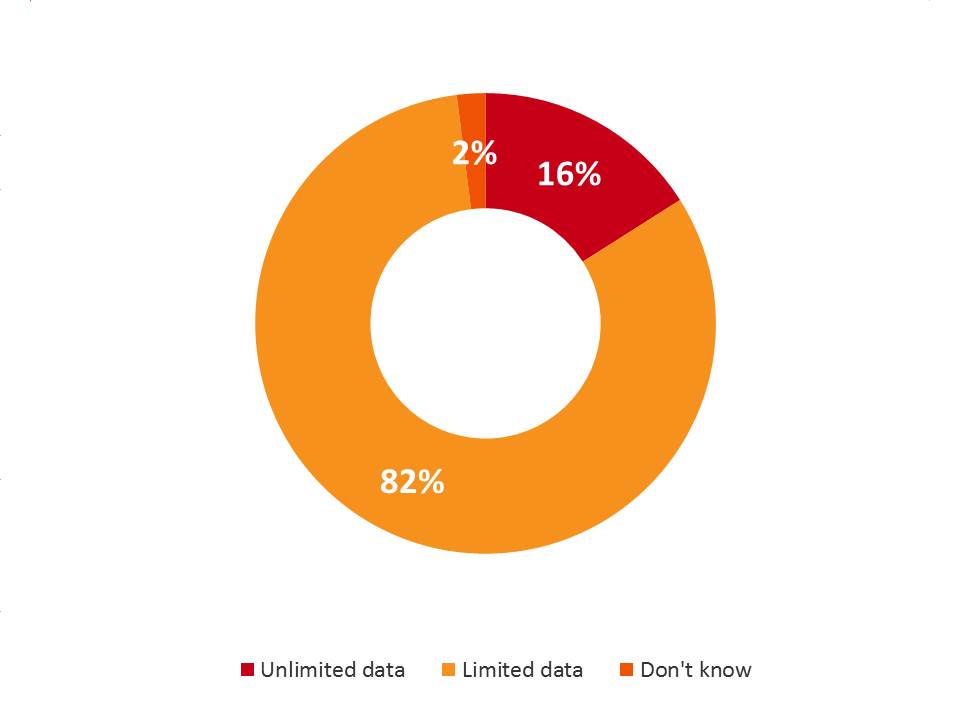
Plan include limited or unlimited data - text version
QB4. Does your plan include unlimited data or limited data?
Base: Respondents who have data included in the wireless plan (n=831)
It would appear that many Canadians are unclear on the ownership of their mobile device. Most Canadians do not believe they have a subsidized phone or tab plan (72%); rather, they believe they own their device outright. Only a small number think they have a subsidized phone (10%), tab balance (9%) or other device provided at a discount (7%).
The confusion is evidenced by the finding that some of those with pre-paid plans think they have a subsidized device and when we remove those with pre-paid from the analysis we find that even more Canadians (77%) think they own their phone outright – a finding that is highly unlikely.
Older Canadians are more likely to think they own their wireless devices than their younger counterparts (80% vs 69%) as are those outside of Quebec (69-78% vs 59%), those with individual plans (77% vs 63%) and those with prepaid plans (88% vs 69%). Canadians in the Atlantic and Quebec are more likely to have a tab balance (15-21% vs 4-6%).
Exhibit 4.4.2.d. Plan includes subsidized phone with a tab balance or other device included at a discount
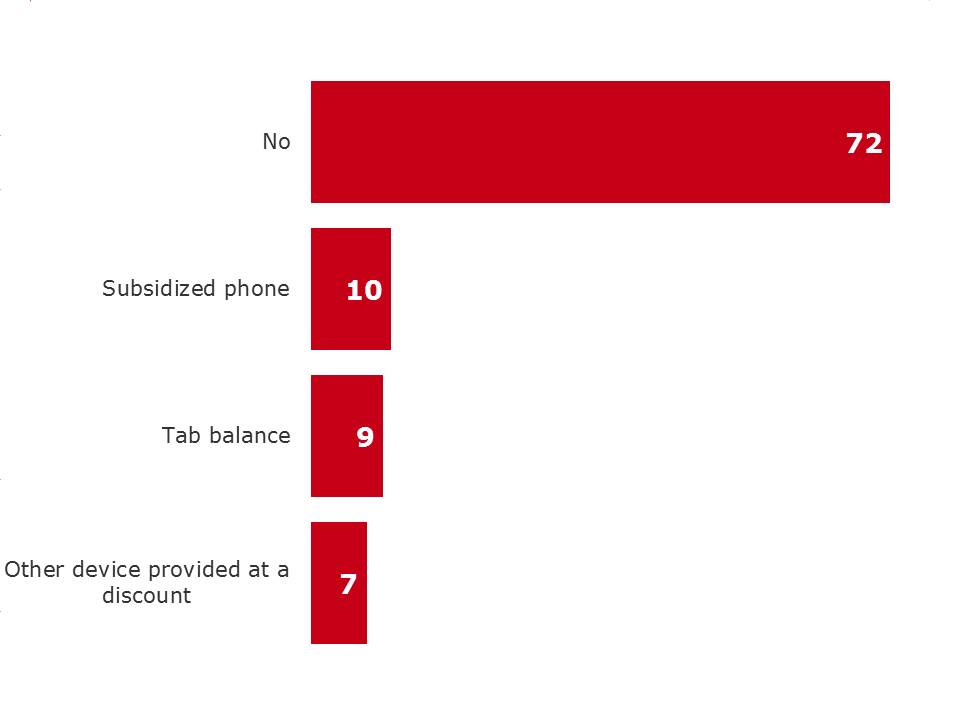
QB1c. And does your plan include a subsidized phone, have a tab balance or include any other device included at a discount? [Select all that apply]
Base: Respondents who own a cell phone, fall 2016 (n=1,277)
Exhibit 4.4.2.e. Plan includes subsidized phone with a tab balance or other device included at a discount by age, plan and pre- or post-paid
| Subsidized phone | Total | Age | Plan | Pre- or Post-Paid | ||||
|---|---|---|---|---|---|---|---|---|
| 18-34 | 35-54 | 55+ | Family | Individual | Postpaid | Prepaid | ||
| Base=actual | (1,277) % |
(198) % |
(421) % |
(643) % |
(368) % |
(892) % |
(1,041) % |
(217) % |
| No | 72 | 69 | 69 | 80* | 63 | 77* | 69 | 88* |
| Subsidized phone | 10 | 8 | 13 | 9 | 14* | 8 | 11* | 2 |
| Tab balance | 9 | 12* | 8* | 5 | 12* | 7 | 10* | 2 |
| Other device provided at a discount | 7 | 9* | 7* | 3 | 8 | 6 | 7 | 5 |
*Represents significant difference at the 95% confidence level.
Exhibit 4.4.2.f. Plan includes subsidized phone with a tab balance or other device included at a discount by region
| Subsidized phone | Total | Region | |||||
|---|---|---|---|---|---|---|---|
| Atl | Que | Ont | Pra | BC | Terr | ||
| Base=actual | (1,277) % |
(101) % |
(275) % |
(393) % |
(304) % |
(151) % |
(53) % |
| No | 72 | 69 | 59 | 78* | 78* | 75* | 64 |
| Subsidized phone | 10 | 9 | 9 | 8 | 11 | 12 | 20* |
| Tab balance | 9 | 21* | 15* | 6 | 4 | 6 | 5 |
| Other device provided at a discount | 7 | - | 13* | 5 | 4 | 4 | 11* |
*Represents significant difference at the 95% confidence level.
Over the past two years, Canadians understanding of the mandate and role of the CRTC has declined. In 2014, 38 per cent of Canadians considered themselves informed about the mandate and role of the CRTC while in 2016 only 33 per cent consider themselves informed.
Older Canadians (55+), men, Quebeckers and Francophones are more likely to consider themselves informed about the mandate and role of the CRTC (41% vs 26-29%, 37% vs 28%, 42% vs 26-32% and 44% vs 25-31% respectively).
Those who have experienced bill shock and those who have lodged a complaint believe they are less informed (not very well/not informed) than their counterparts (73% vs 63% and 76% vs 63% respectively).
Exhibit 4.5.1.a. Level of informed with the mandate and role of the CRTC
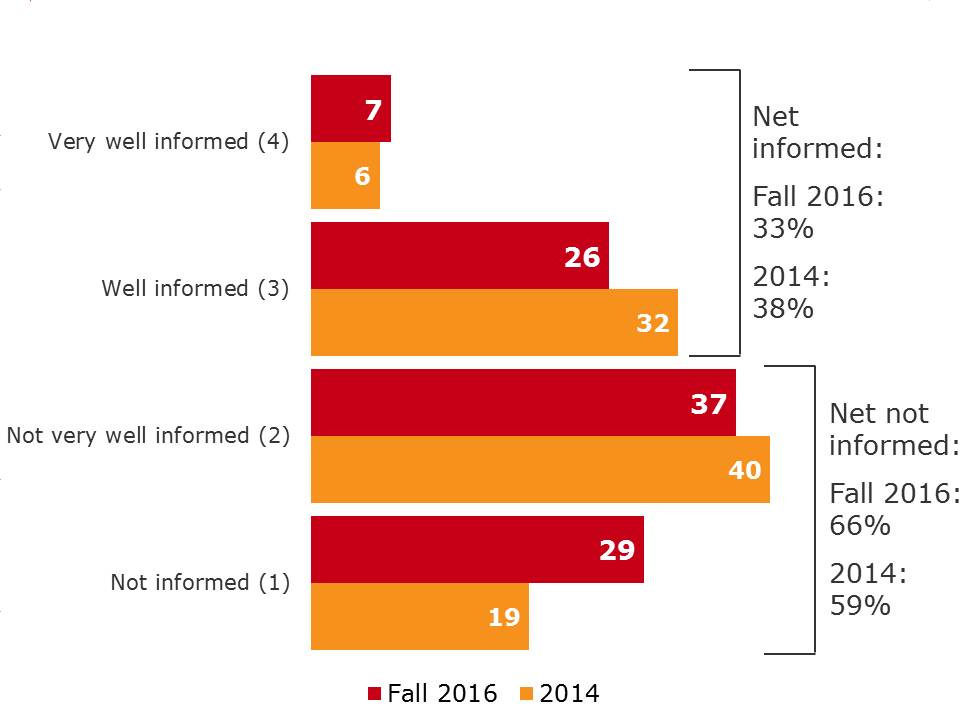
Level of informed with the mandate and role of the CRTC - text version
QC1. Overall, how informed are you about the mandate and role of the CRTC ?
Base: Total respondents, fall 2016 (n=1,483)
Exhibit 4.5.1.b. Level of informed with the mandate and role of the CRTC by age, gender and language
| Level of informed with the mandate and role of the CRTC | Total | Age | Gender | Language | |||||
|---|---|---|---|---|---|---|---|---|---|
| 18-34 | 35-54 | 55+ | Male | Female | English | French | Other | ||
| Base=actual | (1,483) % |
(209) % |
(456) % |
(802) % |
(704) % |
(779) % |
(920) % |
(327) % |
(223) % |
| Very well informed (4) | 7 | 5 | 6 | 9 | 7 | 6 | 6 | 7 | 7 |
| Well informed (3) | 26 | 21 | 23 | 32* | 30* | 22 | 24 | 37* | 17 |
| Not very well informed (2) | 37 | 36 | 40 | 35 | 34 | 40* | 42* | 34 | 29 |
| Not informed (1) | 29 | 36* | 29* | 21 | 28 | 29 | 27 | 20 | 41* |
*Represents significant difference at the 95% confidence level.
Exhibit 4.5.1.c. Level of informed with the mandate and role of the CRTC by region, bill shock and lodged complaint
| Level of informed with the mandate and role of the CRTC | Total | Region | Bill Shock |
Lodged Complaint |
|||||||
|---|---|---|---|---|---|---|---|---|---|---|---|
| Atl | Que | Ont | Pra | BC | Terr | Yes | No | Yes | No | ||
| Base=actual | (1,483) % |
(121) % |
(321) % |
(443) % |
(364) % |
(181) % |
(53) % |
(250) % |
(1,012) % |
(203) % |
(1,065) % |
| Very well informed (4) | 7 | 7 | 7 | 6 | 6 | 9 | 5 | 7 | 7 | 6 | 7 |
| Well informed (3) | 26 | 19 | 35* | 22 | 26 | 21 | 24 | 19 | 28* | 17 | 28* |
| Not very well informed (2) | 37 | 33 | 33 | 40 | 41 | 30 | 48 | 32 | 38 | 39 | 37 |
| Not informed (1) | 29 | 38* | 23 | 29 | 25 | 39* | 23 | 41* | 25 | 37* | 26 |
*Represents significant difference at the 95% confidence level.
Overall Canadians impressions of the CRTC are more neutral in 2016 than they were in 2013 and 2014. That is, they are both less favourable (29% vs 34-37%) and they are also less unfavourable (12% vs 16%). Older Canadians (55+) and men are more likely to have an opinion (favourable or unfavourable) about the CRTC than younger Canadians and women.
Exhibit 4.5.2.a. Impression of the CRTC
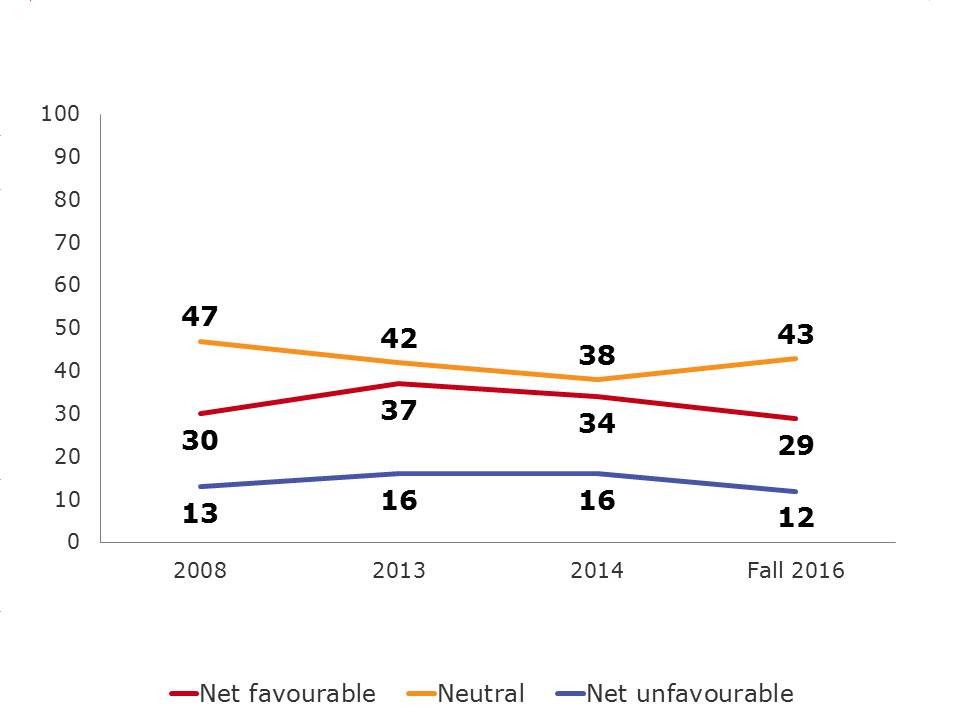
Impression of the CRTC - text version
QC2. What is your impression of the CRTC ?
Base: Total respondents fall 2016 (n=1,483), 2014 (n=1,289)
*Note: base sizes are unknown for the 2013 and 2008 survey.
Canadians with university educations have more favourable impressions of the CRTC than their less educated counterparts (33% vs 25%). Interestingly, those who have lodged a complaint and those who are dissatisfied with the resolution have less favourable impressions (somewhat/very unfavourable) of the CRTC (17% vs 10% and 22% vs 7%).
Exhibit 4.5.2.b. Impression of the CRTC by age, gender, lodged complaint and complaint resolution
| Impression of the CRTC | Total | Age | Gender | Lodged Complaint |
Complaint Resolution |
|||||
|---|---|---|---|---|---|---|---|---|---|---|
| 18-34 | 35-54 | 55+ | Male | Female | Yes | No | Satisfied | Dissatisfied | ||
| Base=actual | (1,483) % |
(209) % |
(456) % |
(802) % |
(704) % |
(779) % |
(203) % |
(1,065) % |
(86) % |
(90) % |
| Net favourable | 29 | 27 | 27 | 33* | 33* | 25 | 19 | 32* | 29* | 11 |
| Net unfavourable | 12 | 6 | 12* | 17* | 16* | 8 | 17* | 10 | 7 | 22* |
*Represents significant difference at the 95% confidence level.
Over the past year in particular, most Canadians believe their impressions have remained the same (71%) while some have improved (9%) and others have declined (5%). Since 2008, perceptions tend to have improved (4% vs 9%) however have fallen slightly since 2014 measures (11%).
Exhibit 4.5.2.c. Impression of the CRTC over time
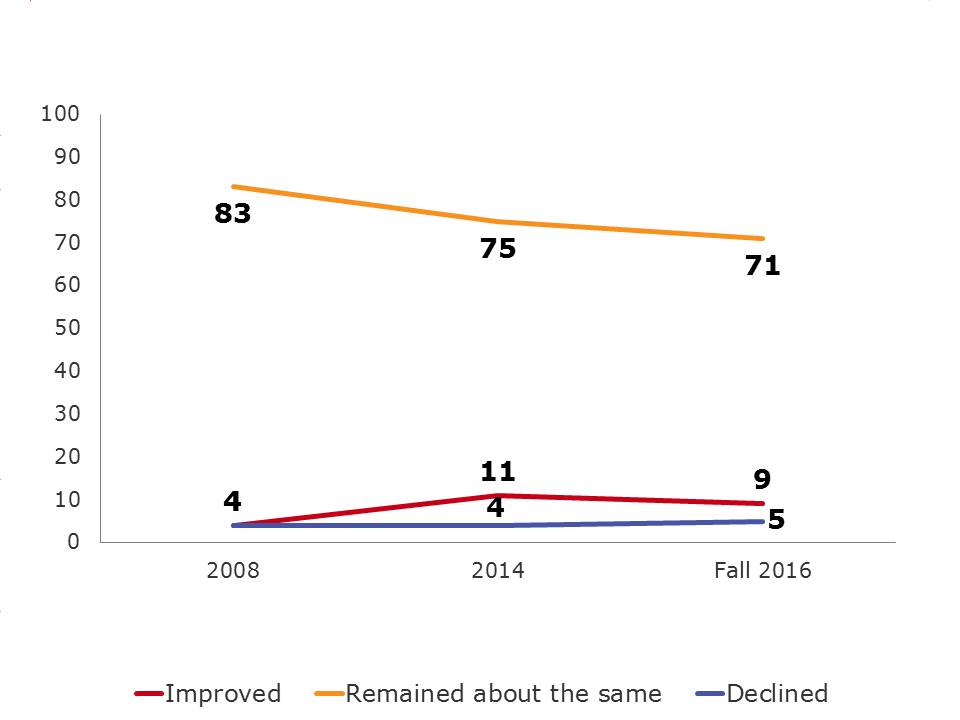
Impression of the CRTC over time - text version
QC3. Over the past year, would you say your impression of the CRTC has:
Base: Total respondents, fall 2016 (n=1,483), 2014 (n=1,289)
*Note: base sizes are unknown for the 2008 survey.
Canadians with higher household incomes ($100K+) are more likely to have improved perceptions over the last twelve months (11-16% vs 7%) while mens perceptions were more likely to decline (7% vs 3%).
Exhibit 4.5.2.d. Impression of the CRTC over time by gender and income
| Impression of the CRTC | Total | Gender | Income | |||||
|---|---|---|---|---|---|---|---|---|
| Male | Female | <$40K | $40K- ><$60K |
$60K- ><$100K |
$100K- ><$150K |
$150K+ | ||
| Base=actual | (1,483) % |
(704) % |
(779) % |
(318) % |
(225) % |
(337) % |
(176) % |
(150) % |
| Improved | 9 | 10 | 8 | 7 | 7 | 7 | 16* | 11 |
| Declined | 5 | 7* | 3 | 2 | 4 | 6 | 5 | 6 |
| Remained about the same | 71 | 73 | 69 | 69 | 77 | 76 | 72 | 75 |
*Represents significant difference at the 95% confidence level.
A telephone survey was conducted among 1,483 Canadians aged 18 years and older; 1,277 with those who have their own wireless plan and 206 with those who do not have a wireless plan. Interviews were conducted using random landline telephone sampling sources. A pre-test consisting of 10 completed English interviews and 10 completed French interviews was completed before fielding the survey on August 29th, 2016. The survey was in field from September 6th to September 19th, 2016. The sample for this study was a probability sample and as such the findings can be extrapolated to the Canadian population with a margin of error of +/-2.5 per cent, 19 times out of 20.
To allow for regional analyses, regional quotas were also set as follows:
Table 5.1.1.a: Survey Quotas
| Region | Wireless | Quota* | Completions |
|---|---|---|---|
| Territories | With wireless | 50 | 53 |
| Without wireless | - | - | |
| British Columbia | With wireless | 150 | 151 |
| Without wireless | 30 | 30 | |
| Alberta | With wireless | 100 | 104 |
| Without wireless | 20 | 20 | |
| Manitoba | With wireless | 100 | 100 |
| Without wireless | 20 | 20 | |
| Saskatchewan | With wireless | 100 | 100 |
| Without wireless | 20 | 20 | |
| Ontario | With wireless | 391 | 393 |
| Without wireless | 50 | 50 | |
| Quebec | With wireless | 275 | 275 |
| Without wireless | 40 | 46 | |
| Atlantic | With wireless | 100 | 101 |
| Without wireless | 20 | 20 |
Survey data were weighted using the 2011 Census and Statistics Canada telephone ownership statistics with regard to region and cell phone penetration. Further details about the methodology follow.
This is a tracking survey and the overall objectives have not changed, although some questions were removed or added to the survey since the spring 2016 wave. CRTC provided TNS with both English and French versions of the survey. The survey took approximately 9 minutes to complete.
A pre-test was undertaken on August 29th, 2016 obtaining 10 English and 10 French completed interviews. The results were reviewed to ensure the survey was working as expected and that the questions were being interpreted as expected. Based on the results of the pre-test, no changes were required for the survey and as such the results of the 20 completes were included in the final data set.
A regionally stratified sample was drawn to achieve completions among Canadians who own their own cell phone and those who do not. The sample was regionally stratified to ensure regional quotas were met.
A landline sample was provided by an internal random number generator that randomizes the last four digits of the phone number based on known area code/exchange combinations. Landline respondents were screened to ensure they qualified for the study. The person answering the phone was selected for the study if they were 18 years of age or older. Regional quotas were assigned by those with and without personal wireless plans.
The telephone survey was conducted using computer assisted telephone interviewing (CATI) technology. CATI ensures the interview flows as it should with pre-programmed skip patterns. It also controls responses to ensure appropriate ranges and data validity. Sample is imported directly into the survey to ensure accurate recording of sample variables such as region. The system also controls automated scheduling and call-backs to ensure all appointments are adhered to.
Surveys were conducted in English or French as chosen by the respondent. Interviewing was conducted by fully trained interviewers and supervisors. A minimum of five per cent of all interviews were independently monitored and validated in real time.
All participants were informed of the general purpose of the research, they were informed of the sponsor and the supplier and that all of their responses would be confidential. As well, the survey was registered with the Survey Registration System.
A sample of 1,483 drawn from the Canadian adult population would produce a margin of error of +/-2.5 per cent 19 times out of 20. Sub-groups have larger margins of error and are presented below.
Table 5.1.1.b: Margin of Error by Region, Gender, Age
| Target | Completes (Unweighted) |
Completes (Weighted) |
Margin of Error |
|---|---|---|---|
| Region | |||
| Atlantic | 121 | 106 | +/- 8.9 |
| Quebec | 321 | 356 | +/- 5.5 |
| Ontario | 443 | 568 | +/- 4.7 |
| Saskatchewan | 120 | 88 | +/- 9.0 |
| Alberta | 124 | 78 | +/- 8.8 |
| Manitoba | 120 | 88 | +/- 9.0 |
| British Columbia | 181 | 155 | +/- 7.3 |
| Territories | 53 | 45 | +/- 13.5 |
| Gender | |||
| Male | 704 | 686 | +/- 3.7 |
| Female | 779 | 797 | +/- 3.5 |
| Age | |||
| 18-34 | 209 | 525 | +/- 6.8 |
| 35-54 | 456 | 433 | +/- 4.6 |
| 55 and over | 802 | 509 | +/- 3.5 |
Data were weighted by region, age, gender, and language using 2011 Census Data. Regional cell phone penetration weights were derived from Statistics Canada data from the Residential Telephone Service Survey (RTSS) conducted in 2013. Age and gender weights were derived from 2011 Census data.
Table 5.1.1.c: 2011 Census Data by Region, Age, Gender
| Region | Age | Gender | Population (N) |
Population (%) |
|---|---|---|---|---|
| Atlantic | 18-34 | Male | 160,221 | 0.72 |
| Female | 270,821 | 1.22 | ||
| 35-54 | Male | 297,583 | 1.34 | |
| Female | 307,288 | 1.38 | ||
| 55+ | Male | 211,465 | 0.95 | |
| Female | 282,250 | 1.27 | ||
| Quebec | 18-34 | Male | 823,498 | 3.71 |
| Female | 819,405 | 3.69 | ||
| 35-54 | Male | 869,800 | 3.92 | |
| Female | 952,579 | 4.29 | ||
| 55+ | Male | 578,676 | 2.61 | |
| Female | 831,489 | 3.75 | ||
| Ontario | 18-34 | Male | 1,365,297 | 6.15 |
| Female | 1,343,245 | 6.05 | ||
| 35-54 | Male | 1,557,875 | 7.02 | |
| Female | 1,730,185 | 7.79 | ||
| 55+ | Male | 1,155,521 | 5.20 | |
| Female | 1,512,596 | 6.81 | ||
| Prairies | 18-34 | Male | 719,398 | 3.24 |
| Female | 715,553 | 3.22 | ||
| 35-54 | Male | 663,437 | 2.99 | |
| Female | 817,925 | 3.68 | ||
| 55+ | Male | 551,387 | 2.48 | |
| Female | 575,980 | 2.59 | ||
| BC & Territories | 18-34 | Male | 356,970 | 1.61 |
| Female | 520,962 | 2.35 | ||
| 35-54 | Male | 507,914 | 2.29 | |
| Female | 680,023 | 3.06 | ||
| 55+ | Male | 456,029 | 2.05 | |
| Female | 567,050 | 2.55 | ||
| Total | 22,202,420 | 100 |
Table 5.1.1.d: 2011 Census Data Region and Language
| Region | Language | Weighting (%) |
|---|---|---|
| Atlantic | English | 6.00 |
| French | 0.91 | |
| Quebec | English | 1.90 |
| French | 18.95 | |
| Ontario | English | 25.42 |
| French | 1.71 | |
| Prairies | English | 13.01 |
| French | 0.47 | |
| BC & Territories | English | 9.30 |
| French | 0.23 |
A total of 161,553 Canadian phone numbers were dialed, of which n=1,483 completed the survey. The overall response rate achieved for the telephone study was 3.63%. The following table outlines the sample disposition and response rate as per the MRIA guidelines.
Table 5.1.1.e: Response Rate Calculation
| TOTAL NUMBERS ATTEMPTED | 161,553 |
|---|---|
| Invalid | 103,090 |
| NIS | 99,468 |
| Fax/Modem | 3,585 |
| Business/Non-Residential | 37 |
| Unresolved (U) | 49,813 |
| Busy | 2,609 |
| No Answer | 23,497 |
| Answering Machine | 23,707 |
| In-scope - non-responding (IS) | 6,787 |
| Language problem | 463 |
| Illness, incapable | |
| Selected respondent not available | 1,259 |
| Household refusal | 4,823 |
| Respondent refusal | |
| Qualified respondent break-off | 242 |
| In-scope - Responding units (R) | 1,863 |
| Language disqualify | 0 |
| No one 18+ | 0 |
| Quota full | 259 |
| Other disqualify | 121 |
| Completed interviews | 1,483 |
| Response Rate = R/(U+IS+R) | 3.19% |
The response rate for this survey was 3.19%. The expected response rate for a telephone survey of this type with a similar field length is between three and five per cent. In order to maximize response TNS undertakes the following:
Detailed tables are included under separate cover.
Section A: Introduction and Screening
Hello/Bonjour. My name is _______________ and I am calling from TNS on behalf of the Government of Canada. We are conducting a survey with Canadians to get their attitudes and opinions towards issues of importance to Canadians. Would you prefer that I continue in English or French? Préférez-vous continuer en français ou en anglais?
Your participation in this survey is voluntary. Please be assured that your responses are confidential and will not be reported individually nor attributed to you personally. The survey will take about 9 minutes to complete. May I continue?
| Yes | CONTINUE |
|---|---|
| No, other time | SCHEDULE CALLBACK |
| No/Refused | THANK AND TERMINATE |
[IF ASKED: TNS is a professional research company hired by the Government of Canada to conduct this survey]
[IF ASKED: MRIA # 20160823-959C]
A1. Are you or is any member of your household or immediate family employed in any of the following businesses? [READ LIST]
Market Research 1 [THANK AND TERMINATE]
Public or media relations or advertising 2 [THANK AND TERMINATE]
Any media company such as print, radio, TV 3 [THANK AND TERMINATE]
Media monitoring 4 [THANK AND TERMINATE]
Any telecommunications company 5 [THANK AND TERMINATE]
No 6 [CONTINUE]
[ASK ALL] A1b. Do you have your own cell phone, smartphone or other wireless device? In other words, a phone that is not paid for by your employer?
| YES | CONTINUE |
|---|---|
| NO | ONLY ASK SECTION C |
IF QUALIFIED NON-CELL OWNER (A1B=NO): [SKIP TO C1]
Section B: Wireless Code
ASK IF QUALIFIED CELL OWNER (A1B=YES)
The first questions are about your cell or wireless phone service contract or plan.
[Interviewer note: If say “I dont have a plan/I have pay-as-you-go/month-to-month,” say: “this question is about your service agreement or plan, regardless of whether you have signed a contract for a specific time period, are month-to-month or use pre-paid cards.”] B1a. Is it an individual plan or a family or shared plan? [Interviewer note: If unsure about the difference, say “Do you pay only for one person (which is an individual plan) or do you share a plan with your family and pay together (which is a family plan)?”]| Individual plan | 1 |
|---|---|
| Family/shared plan | 2 |
| [DO NOT READ] Other [SPECIFY] | 77 |
| DK (DO NOT READ) | 99 |
B1b. And, is it a monthly plan, or a prepaid or pay-as-you-go plan?
[Interviewer note: If unsure about the difference, say “If you pay your bill after you use your wireless service, its a monthly or post-paid plan. If you pay before you use your wireless service, its a prepaid or pay-as-you-go plan.“]| Monthly/post-paid (paying after) | 1 |
|---|---|
| Prepaid/pay-as-you-go (paying before) | 2 |
| [DO NOT READ] Other [SPECIFY] | 77 |
| DK (DO NOT READ) | 99 |
B1c. And does your plan include a subsidized phone, have a tab balance or include any other device included at a discount? [Select all that apply]
[Interviewer note: If unsure about a subsidized phone say “If you purchased a phone at a reduced price as part of your contract and have to pay a cancellation fee to leave your contract early, its a subsidized phone.” If unsure about a tab balance, say “Tab balances are when you buy a phone at a reduced upfront cost and the leftover cost of the phone goes onto your account, creating a tab balance. Each month, a percentage of your monthly bill is used to pay down your tab.”]
| No | 1 |
|---|---|
| Subsidized phone | 2 |
| Tab balance | 3 |
| Other device provided at a discount | 4 |
| [DO NOT READ] Other [SPECIFY] | 77 |
| DK (DO NOT READ) | 99 |
B1d. Is your plan part of a promotion through your employer or an association you belong to, sometimes also called an employee purchase plan?
| Yes | 1 |
|---|---|
| No | 2 |
| DK (D NOT READ) | 99 |
B2. Now I would like to ask you a few questions about the services that are included in your wireless plan.
B2a. Which of the following are included in your wireless plan? Calling minutes [Interviewer note: If unsure about the meaning, say “This is what you need to make or receive phone calls.”] Text messages [Interviewer note: If unsure about the meaning, say “This can include both text messages and multimedia messages, like pictures or video sent via text.”] Data [Interviewer note: If unsure about the meaning of data, say “This is what you need to browse the Internet, access applications or your emails with your wireless device.”] PROGRAMMING NOTE: PLEASE ALLOW YES NO AND DONT KNOW AS OPTIONSB3. In the past month, have you used your wireless plan to: (READ LIST – SELECT ALL THAT APPLY)
PROGRAMMING INSTRUCTION – SHOW ENTIRE LIST| Make calls | 1 |
|---|---|
| Send texts | 2 |
| Read emails | 3 |
| Use the Internet | 4 |
| Use apps | 5 |
| Play games online | 6 |
| Use social media | 7 |
| Navigation or maps | 8 |
| Bank online | 9 |
| Shop online | 10 |
| To work | 11 |
| Other | 12 |
| Did not use (DO NOT READ) | |
| DK (DO NOT READ) | 99 |
B4. [ASK If answered “Yes” to data at B2a.] Some wireless plans have unlimited data and some include limited data. When a plan includes limited data, you may have to pay data overage fees if you use more data in a month than is included in your plan.
Does your plan include unlimited data or limited data? [Interviewer note: If unsure about the meaning of data, say “This is what you need to browse the Internet, access applications or your emails with your wireless device.”]| Unlimited data | 1 |
|---|---|
| Limited data | 2 |
| No data | 3 |
| DK (DO NOT READ) | 99 |
B5a. [ASK If answered “Data” to B2a] Which of the following activities, if any, do you do to manage or limit your data use? Select all that apply.
| Use toolsto track your data use | 1 |
|---|---|
| Reduce your data use after you get a notification that you are nearing your limit | 2 |
| Use wifi when available instead of data | 3 |
| Other (specify) | 4 |
| I do not limit my data use | 5 |
| DK (DO NOT READ) | 99 |
B6. [ASK If answered “Data” to B2a] How easy do you find it to manage your data use each month? Please use a 7-point scale where 1 means extremely difficult and 7 means extremely easy.
[Interviewer note: If unsure about the meaning of data, say “This is what you need to browse the Internet, access applications or your emails with your wireless device.”]| 7 – Extremely easy | 07 |
|---|---|
| 6 | 06 |
| 5 | 05 |
| 4 | 04 |
| 3 | 03 |
| 2 | 02 |
| 1 – Extremely difficult | 01 |
| DK (DO NOT READ) | 99 |
B7. [ASK If answered “Data” to B2a and if B1a=2 family/shared plan] How easy do you find it to manage the data used by the other people sharing your plan to avoid data overage fees?
Please use a 7-point scale where 1 means extremely difficult and 7 means extremely easy.| 7 – Extremely easy | 07 |
|---|---|
| 6 | 06 |
| 5 | 05 |
| 4 | 04 |
| 3 | 03 |
| 2 | 02 |
| 1 – Extremely difficult | 01 |
| DK (DO NOT READ) | 99 |
B8. [ASK If answered “Data” to B2a.] In the past 12 months, how often have you paid data overage fees? READ LIST
[Interviewer note: If unsure about the meaning of data, say “This is what you need to browse the Internet, access applications or your emails with your wireless device.”]| Never | 1 |
|---|---|
| 1-2 times | 2 |
| 3-6 times | 3 |
| 7-9 times | 4 |
| 10-12 times | 5 |
| DK- DO NOT READ | 99 |
B9. If you use your plan while traveling, you may be charged roaming fees.
How easy do you find it to manage your roaming charges when you are traveling? Please use a 7-point scale where 1 means extremely difficult and 7 means extremely easy.| 7 – Extremely easy | 07 |
|---|---|
| 6 | 06 |
| 5 | 05 |
| 4 | 04 |
| 3 | 03 |
| 2 | 02 |
| 1 – Extremely difficult | 01 |
| I dont travel with my phone (DO NOT READ) | 08 |
| DK (DO NOT READ) | 99 |
B10. During the last year, have you experienced ‘bill shock, meaning a surprisingly high bill? READ LIST
| Yes | 1 |
|---|---|
| No | 2 |
| DK DO NOT READ | 99 |
B10a. [If answered “Yes” to B10] What was the main reason for the ‘bill shock you experienced? DO NOT READ LIST – SELECT ALL THAT APPLY
INTERVIEWER NOTE: IF RESPONDENT SAYS ‘ROAMING/ROAMING FEES, CLARIFY WHETHER THIS WAS WITHIN CANADA OR IN ANOTHER COUNTRY| Family/shared plans – difficulties managing use | 01 |
|---|---|
| International travel – roaming fees | 02 |
| Domestic travel – roaming fees | 03 |
| Data overage fees | 04 |
| Call minute overage fees | 05 |
| Long distance fees | 06 |
| Text overage fees | 07 |
| Billing issues/errors/mistakes | 08 |
| Unexpected set-up fee or service charge | 09 |
| Unexpected fees (Network access fee/911, etc.) | 10 |
| I was not given the plan/deal I was promised | 11 |
| Other (Specify) | 77 |
| DK (DO NOT READ) | 99 |
B10b. [If answered “Yes” to B10] What was the amount of the unexpected charges on your bill? READ LIST
| Less than $50 more than your usual monthly bill | 01 |
|---|---|
| $50 - $100 | 02 |
| $101 - $250 | 03 |
| $251 - $500 | 04 |
| $501 - $1000 | 05 |
| Greater than $1000 | 06 |
| Dont Know DO NOT READ | 99 |
B11. Have you made a complaint about your wireless services in the past 12 months?
| Yes | 1 |
|---|---|
| No | 2 |
| DK (DO NOT READ) | 99 |
B11a. [ASK If answered “Yes” to B11] How many complaints have you made about your wireless service during the past 12 months?
PROGRAMMING NOTE: ALLOW NUMERIC ENTRY B11b. [ASK If answered “Yes” to B11] What was your complaint about? READ LIST IF NEEDED CHOOSE ALL THAT APPLY| Misleading information about the terms of your contract | 1 |
|---|---|
| Incorrect charge on your bill | 2 |
| Legitimacy or amount of early cancellation fee | 3 |
| Inadequate quality of service | 4 |
| Credit or refund not received | 5 |
| Data charges | 6 |
| Breach of contract | 7 |
| Change to contract without notice | 8 |
| 30 day cancellation policy | 9 |
| Unlocking phone | 10 |
| Credit reporting | 11 |
| Other [specify] | 77 |
| DK(Do not read) | 99 |
NOTES TO INTERVIEWER: PLEASE FAMILIARIZE YOURSELF WITH THE FOLLOWING BEFORE INTERVIEW READ IF REQUIRED
· Misleading information about terms: Some examples are what is included in a contract or how the contract should be interpreted, or whether the providers conduct meets its contractual obligations, or misunderstandings about the particulars of a contract or term. · Incorrect charge: Some examples include complaints about customers having agreed to one price and subsequently being charged more, being overcharged due to either a billing system error or a price that is different than advertised, or about being billed for per-use services which they claim they did not use. · Early cancellation fee: This would be a complaint about the amount or the legitimacy of an early cancellation fee charged to the customer when they cancel their service. · Inadequate quality of service: This can include the installation, repair or disconnection of service, including the quality of the service or unreasonable interruptions to service and transfers of service from one provider to another. · Credit or refund not received: This is fairly straightforward – refunds would normally be due upon cancellation of a service. · Data charges: Any complaints relating to a customers data plan or data services, including disputes over data overage fees, the ability of multiple users on family or shared plans to consent to exceeding data overage caps. · Breach of contract: This would include disputes about compliance with terms and conditions of a customers contract. o Change to contract without notice: This is when a service provider changes a material term in a customers contract without providing notice. o Credit reporting is issues related to a consumers credit score and/or debt collection. For example, a customer is overbilled in error and does not pay the outstanding amount, this may impact their credit or they may have to deal with debt collection agencies while the complaint is being addressed. B11c. [ASK If answered “Yes” to B11] Did you complain to your service provider?| Yes | 1 |
|---|---|
| No | 2 |
| DK (DO NOT READ) | 99 |
B11d. [ASK If answered “Yes” to B11c] When dealing with your complaint, did your service provider inform you of your right to complain to the Commissioner for Complaints for Telecommunications Services (CCTS ), the independent agency created to help you with complaints about phone and internet services?
| Yes | 1 |
|---|---|
| No | 2 |
| DK (DO NOT READ) | 99 |
B11e. [ASK If answered “Yes” to B11] Did you raise your complaint with CCTS ?
[Interviewer note: If unsure about the meaning of CCTS , say “This is an independent organization that is responsible for responding to complaints about wireless services that you have not been able to resolve with your provider.”]| Yes | 1 |
|---|---|
| No | 2 |
| DK (DO NOT READ) | 99 |
B11f [If answered “No” to B11e] Why didnt you raise your complaint to the CCTS ? READ LIST CODE ONLY ONE [Specify MAIN REASON, if needed]
| I didnt know about the CCTS | 1 |
|---|---|
| It wasnt worth the effort | 2 |
| I dont think it would have resolved the issue | 3 |
| DK(do not read) | 99 |
B11g [ASK If answered “Yes” to B11] What was the resolution to your complaint? DO NOT READ LIST CODE ALL
| Apology by provider | 1 |
|---|---|
| Correction to billing issue | 2 |
| Financial compensation | 3 |
| Provider fixed the issue (other than billing issue) | 4 |
| Other Specify | |
| DK (DO NOT READ) | 99 |
B11h. [ASK If answered “Yes” to B11] How satisfied were you with how your complaint was resolved? Please use a 7-point scale where 1 means extremely dissatisfied and 7 means extremely satisfied.
| 7 – Extremely satisfied | 07 |
|---|---|
| 6 | 06 |
| 5 | 05 |
| 4 | 04 |
| 3 | 03 |
| 2 | 02 |
| 1 – Extremely dissatisfied | 01 |
| DO NOT READ: Still in process | 08 |
| DO NOT READ: Dont Know | 99 |
Section C: CRTC (ASK ALL)
[Read] The Canadian Radio-television and Telecommunications Commission or CRTC is an independent agency of government, responsible for regulating Canada's broadcasting and telecommunications systems. C1. Overall, how informed are you about the mandate and role of the CRTC ? (READ LIST)| Very well informed | 1 |
|---|---|
| Well informed | 2 |
| Not very well informed | 3 |
| Not informed | 4 |
| DK(do not read) | 99 |
C2. What is your impression of the CRTC ? Would you say it is: (READ LIST) [Repeat CRTC definition, if necessary]
| Very favourable | 1 |
|---|---|
| Somewhat favourable | 2 |
| Neutral | 3 |
| Somewhat unfavourable | 4 |
| Very unfavourable | 5 |
| DK (DO NOT READ) | 99 |
C3. Over the past year, would you say your impression of the CRTC has: (READ LIST) [Repeat CRTC definition, if necessary]
| Improved | 1 |
|---|---|
| Declined | 2 |
| Remained about the same | 3 |
| DK (DO NOT READ) | 99 |
Section D: Demographics (ASK ALL)
Thank you, now we have a few questions for classifications purposes. Please be assured that your responses will remain confidential. D1. Record gender [DO NOT ASK]| Male | 1 |
|---|---|
| Female | 2 |
D2. Can you tell me, in what year were you born?
_____________[RECORD YEAR TO CALCULATE AGE] DK/refused D3 [IF D2 = DK/refused] For classification purposes, could you tell me whether your age is: [READ LIST]| between 18 and 34 | 1 |
|---|---|
| between 35 and 49 | 2 |
| between 50 and 54 | 3 |
| Between 55 and 64 | 4 |
| 65 or older | 5 |
| REFUSED (DO NOT READ) |
[ASK ALL]
D4. Can you please confirm that you live in [PROVINCE FROM SAMPLE]? [IF NECESSARY, INTERVIEWER SAYS:] This information will be used for classification purposes only.| Yes | 1 |
|---|---|
| No | 2 |
D5. [IF D4=2(No)] In which province or territory do you live? [READ LIST]
| Alberta | 1 |
|---|---|
| British Columbia | 2 |
| Manitoba | 3 |
| New Brunswick | 4 |
| Newfoundland | 5 |
| Nova Scotia | 6 |
| Ontario | 7 |
| Prince Edward Island | 8 |
| Quebec | 9 |
| Saskatchewan | 10 |
| Yukon | 11 |
| Nunavut | 12 |
| Northwest Territories | 13 |
D6. What is the highest level of formal education that you have completed? [READ IF NECESSARY - CODE ONE ONLY]
| Grade 8 or less | 1 |
|---|---|
| Some high school | 2 |
| High School diploma or equivalent | 3 |
| Registered Apprenticeship or other trades certificate or diploma | 4 |
| College, CEGEP or other non-university certificate or diploma | 5 |
| University certificate or diploma below bachelors level | 6 |
| Bachelors degree | 7 |
| Post graduate degree above bachelors level | 8 |
| [DO NOT READ] Prefer not to answer | 99 |
D7. What is your mother tongue, that is, the language you first learned at home? [CODE ONE ONLY]
| English | 1 |
|---|---|
| French | 2 |
| Other (SPECIFY____________) | 8 |
| DK/NR (VOLUNTEERED) | 99 |
D8. Which of the following categories best describes your total household income? That is, the total income of all persons in your household combined, before taxes? [READ - CODE ONE ONLY]
| Under $20,000 | 1 |
|---|---|
| $20,000 to just under $40,000 | 2 |
| $40,000 to just under $60,000 | 3 |
| $60,000 to just under $80,000 | 5 |
| $80,000 to just under $100,000 | 6 |
| $100,000 to just under $150,000 | 7 |
| $150,000 and above | 8 |
| [DO NOT READ] Refused | 99 |
D9. Which of the following categories best describes your current employment status? Are you…? [READ - CODE ONE ONLY]
| Working full-time (35 or more hours per week) | 1 |
|---|---|
| Working part-time (less than 35 hours per week) | 2 |
| Self-employed | 3 |
| Unemployed, but looking for work | 4 |
| A student attending school full-time | 5 |
| Retired | 6 |
| Not in the workforce (Full-time homemaker or unemployed but not looking for work | 7 |
| Other employment status | 8 |
| [DO NOT READ] Refused | 99 |
Those are all the questions I have for you today. Thank you.