The year in review—The Long Term Vision and Plan Annual Report 2015 to 2016
Program financial performance
In fiscal year 2015 to 2016, solid progress was made in advancing the Long Term Vision and Plan (LTVP) and planning for future projects.
Total LTVP expenditures in fiscal year 2015 to 2016 were $387.8 million, bringing overall program expenditures to $2,167.0 million as of March 31, 2016 as shown in Figure 7. Overall, program spending increased over the previous fiscal year, reflecting the increasing maturity of the LTVP program and the concentration of rehabilitation and construction work currently underway, with many projects at peak implementation. The overall LTVP budget and expenditures are shown in Figure 8.
Figure 7—Long Term Vision and Plan total cumulative budgets, expenditures and forecasts—Fiscal year 2015 to 2016 (in millions of dollars)
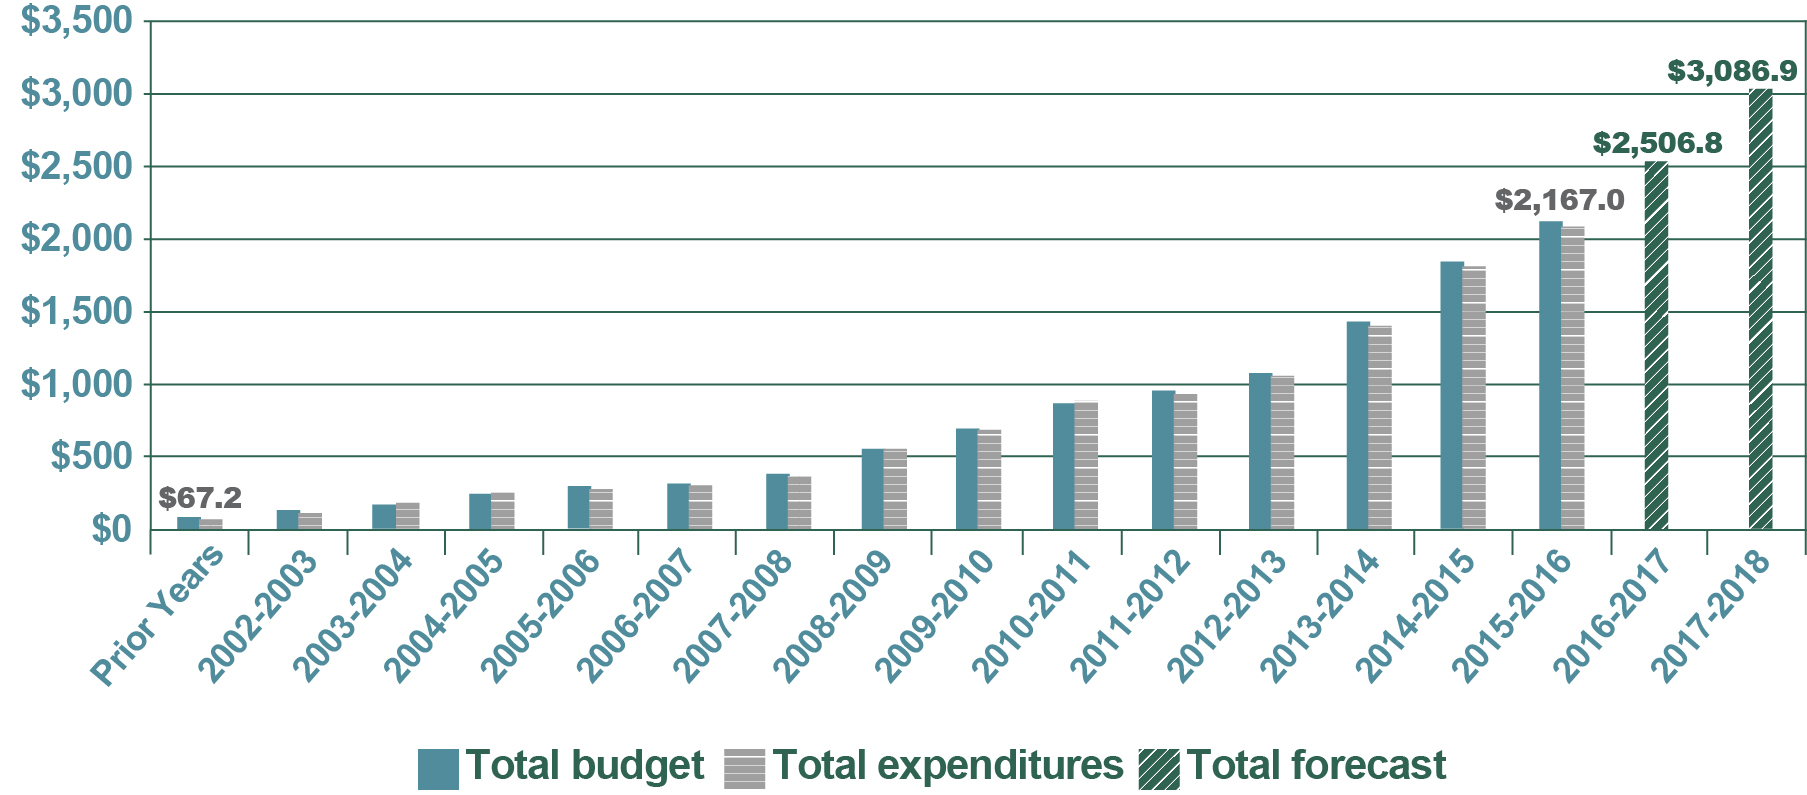
Table equivalent of figure 7—Long Term Vision and Plan total cumulative budgets, expenditures and forecasts—Fiscal year 2015 to 2016 (in millions of dollars)
| Year | Total budget | Total expenditures | Total forecast |
|---|---|---|---|
| Prior years | $69.1 | $67.2 | N/A |
| 2002 to 2003 | $119.5 | $115.0 | N/A |
| 2003 to 2004 | $178.4 | $189.3 | N/A |
| 2004 to 2005 | $234.7 | $249.4 | N/A |
| 2005 to 2006 | $313.4 | $307.8 | N/A |
| 2006 to 2007 | $395.1 | $391.6 | N/A |
| 2007 to 2008 | $463.3 | $459.1 | N/A |
| 2008 to 2009 | $532.6 | $532.7 | N/A |
| 2009 to 2010 | $659.1 | $658.6 | N/A |
| 2010 to 2011 | $785.6 | $788.1 | N/A |
| 2011 to 2012 | $933.7 | $934.5 | N/A |
| 2012 to 2013 | $1,161.5 | $1,139.5 | N/A |
| 2013 to 2014 | $1,444.1 | $1,423.2 | N/A |
| 2014 to 2015 | $1,802.1 | $1,779.1 | N/A |
| 2015 to 2016 | $2,210.1 | $2,167.0 | $2,167.0 |
| 2016 to 2017 | N/A | N/A | $2,506.8 |
| 2017 to 2018 | N/A | N/A | $3,086.9 |
Note: All forecasts are for currently approved projects and are subject to change.
Figure 8—Long Term Vision and Plan monthly financial situation—Fiscal year 2015 to 2016 (in millions of dollars)
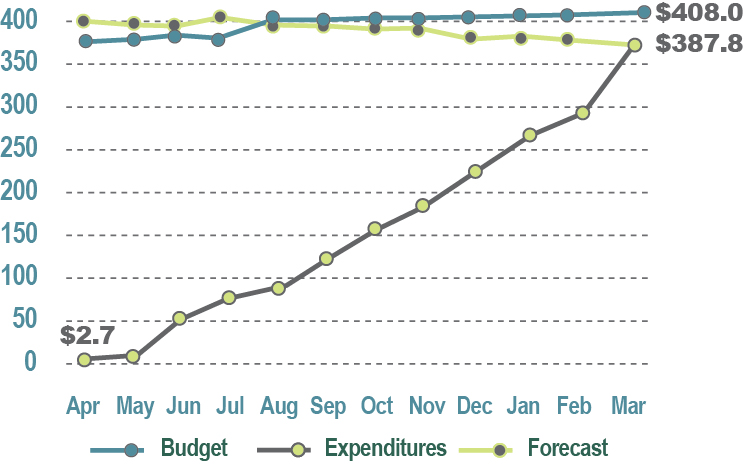
Table equivalent of figure 8—Long Term Vision and Plan monthly financial situation—Fiscal year 2015 to 2016 (in millions of dollars)
| Month | Budget | Expenditures | Forecast |
|---|---|---|---|
| April | $385.1 | $2.7 | $405.9 |
| May | $385.1 | $10.4 | $399.7 |
| June | $389.2 | $51.2 | $398.9 |
| July | $389.2 | $74.2 | $402.0 |
| August | $408.0 | $93.4 | $400.7 |
| September | $408.0 | $131.1 | $397.7 |
| October | $408.0 | $155.2 | $396.8 |
| November | $408.0 | $186.4 | $394.5 |
| December | $408.0 | $234.9 | $380.9 |
| January | $408.0 | $263.4 | $385.7 |
| February | $408.0 | $292.9 | $386.1 |
| March | $408.0 | $387.8 | $383.9 |
Note: All forecasts are for currently approved projects and are subject to change.
A breakdown of previous, current and future fiscal year expenditures is shown in Figure 9.
Figure 9—Long Term Vision and Plan cash flow (in millions of dollars)
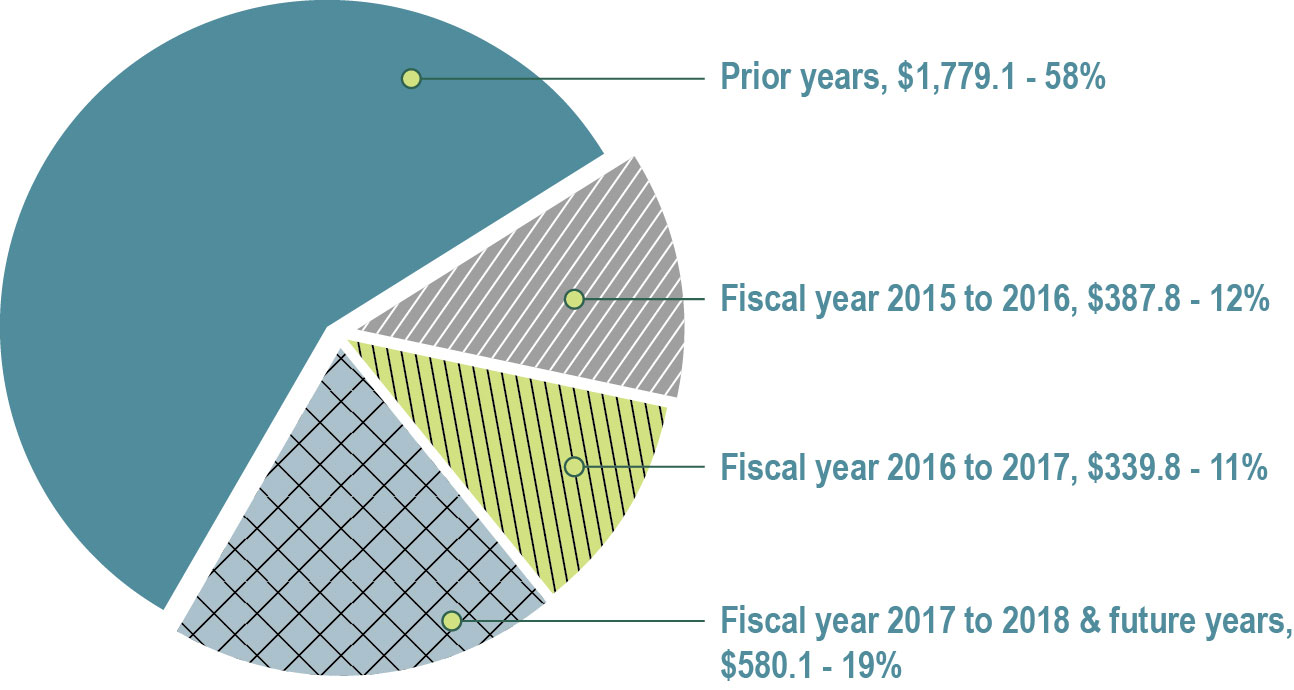
Table equivalent of figure 9—Long Term Vision and Plan cash flow (in millions of dollars)
| Year | Amount | Percentage |
|---|---|---|
| Prior years | $1,779.1 | 58% |
| Fiscal year 2015 to 2016 | $387.8 | 12% |
| Fiscal year 2016 to 2017 | $339.8 | 11% |
| Fiscal year 2017 to 2018 and future years | $580.1 | 19% |
Note: All forecasts are for currently approved projects and are subject to change.
Expenditures for each of the four program components are shown in Figure 10. This breakdown of program expenditures is similar to last fiscal year. In fiscal year 2015 to 2016, MCP represented (84.5%) of all LTVP expenditures, followed by RECAP (6.1%) and the Building Components and Connectivity (BCC) program (6.0%), and Planning (3.4%).
Figure 10—Total Long Term Vision and Plan expenditures by program—Fiscal year 2015 to 2016 (in millions of dollars)
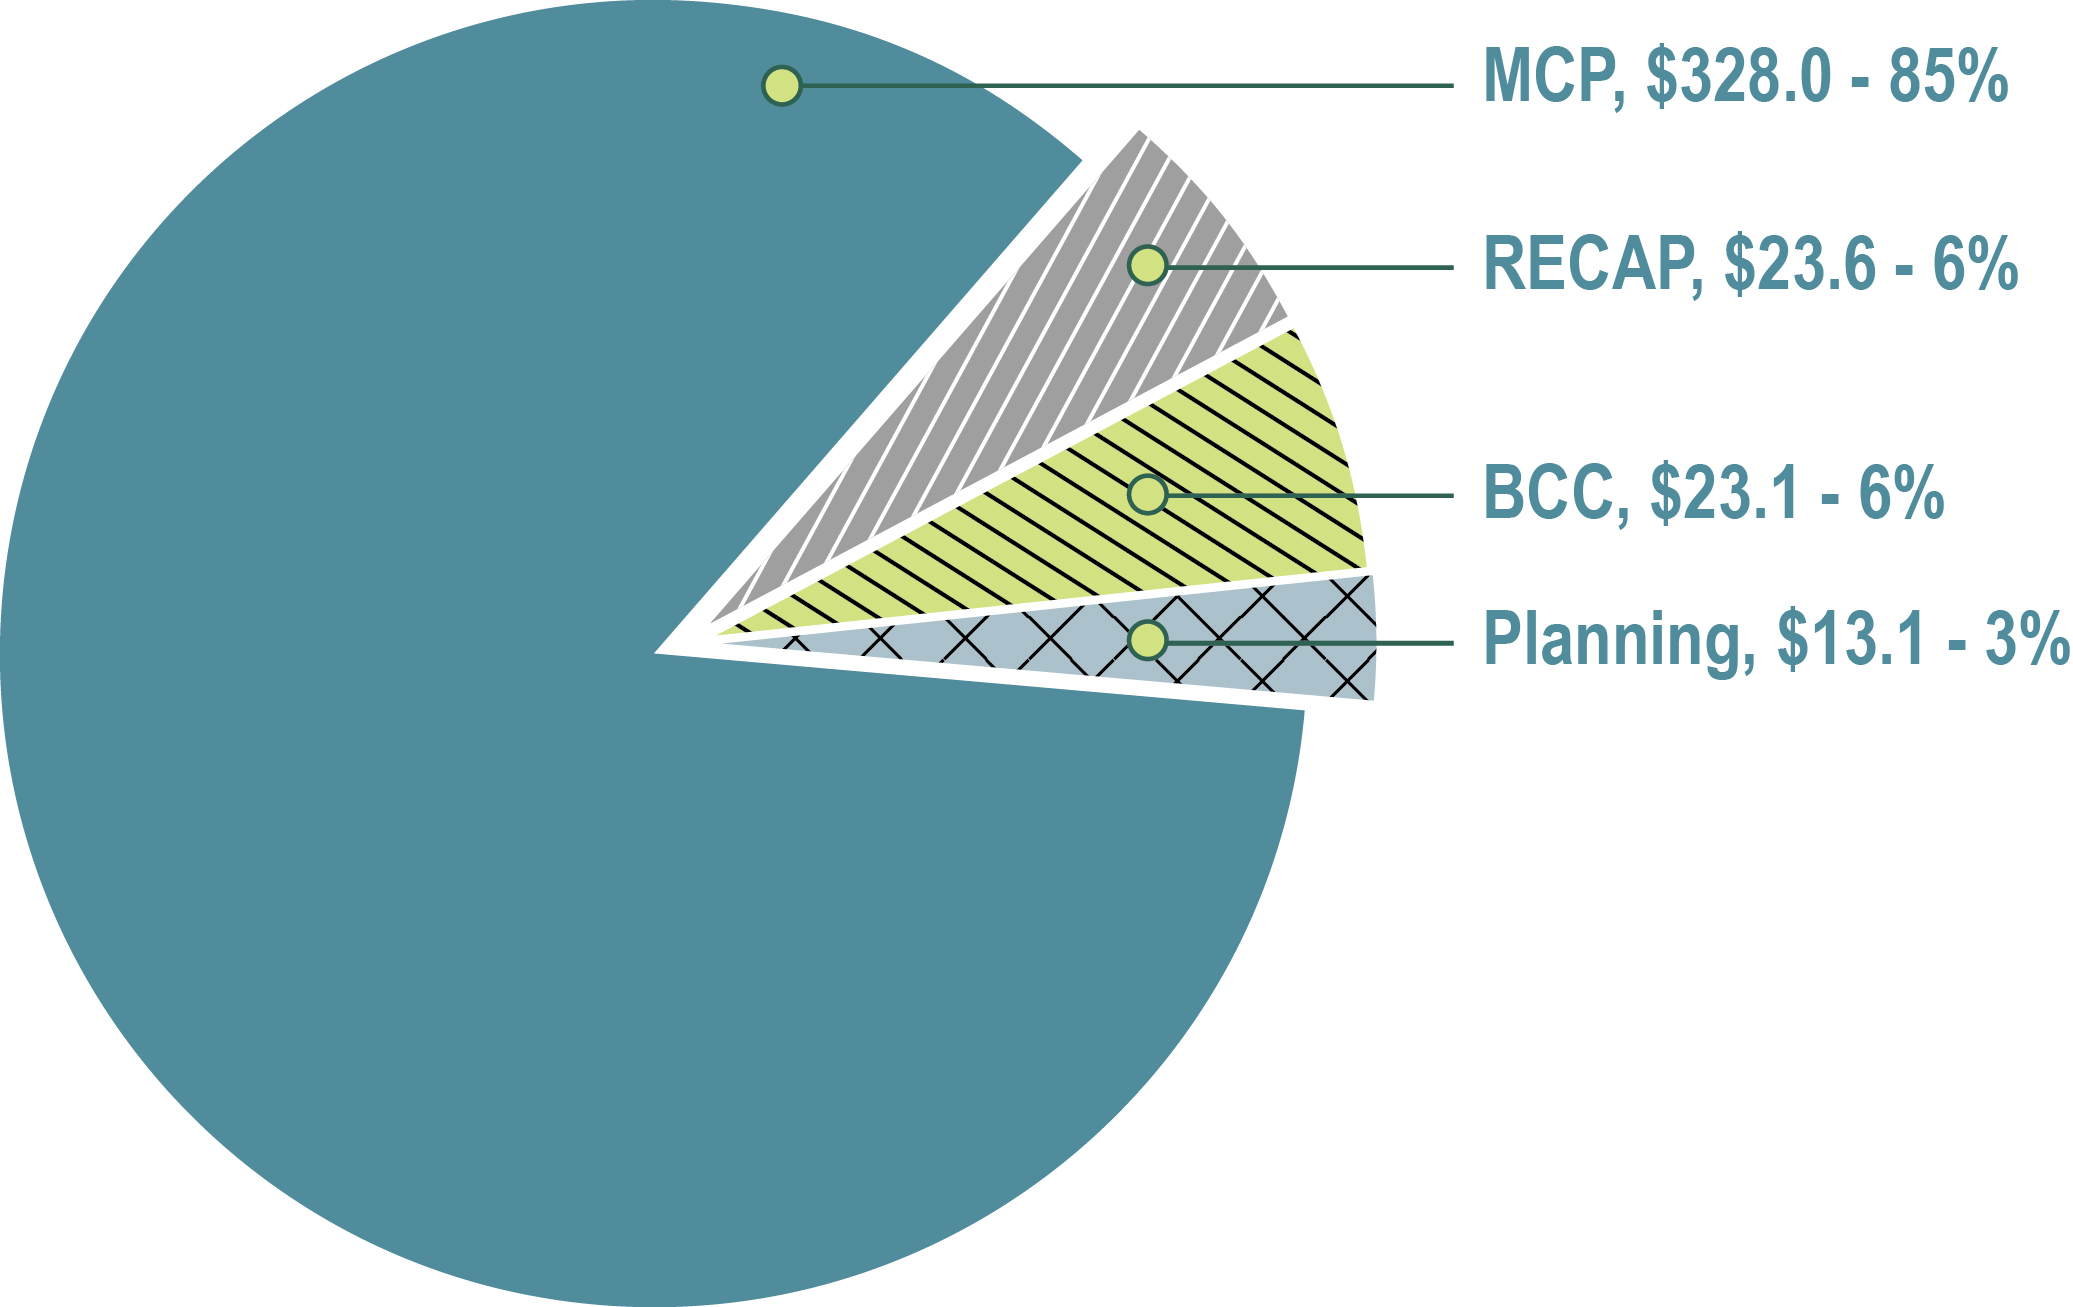
Table equivalent of figure 10—Total Long Term Vision and Plan expenditures by program—Fiscal year 2015 to 2016 (in millions of dollars)
| Program | Expenditures | Percentage |
|---|---|---|
| Major capital program (MCP) | $328.0 | 85% |
| Recapitalization program (RECAP) | $23.6 | 6% |
| Building Components and Connectivity Program (BCC) | $23.1 | 6% |
| Planning program | $13.1 | 3% |
Figure 11 has been included to provide a comparison between program budgets and expenditures.
Figure 11—Total Long Term Vision and Plan budget by program—Fiscal year 2015 to 2016 (in millions of dollars)
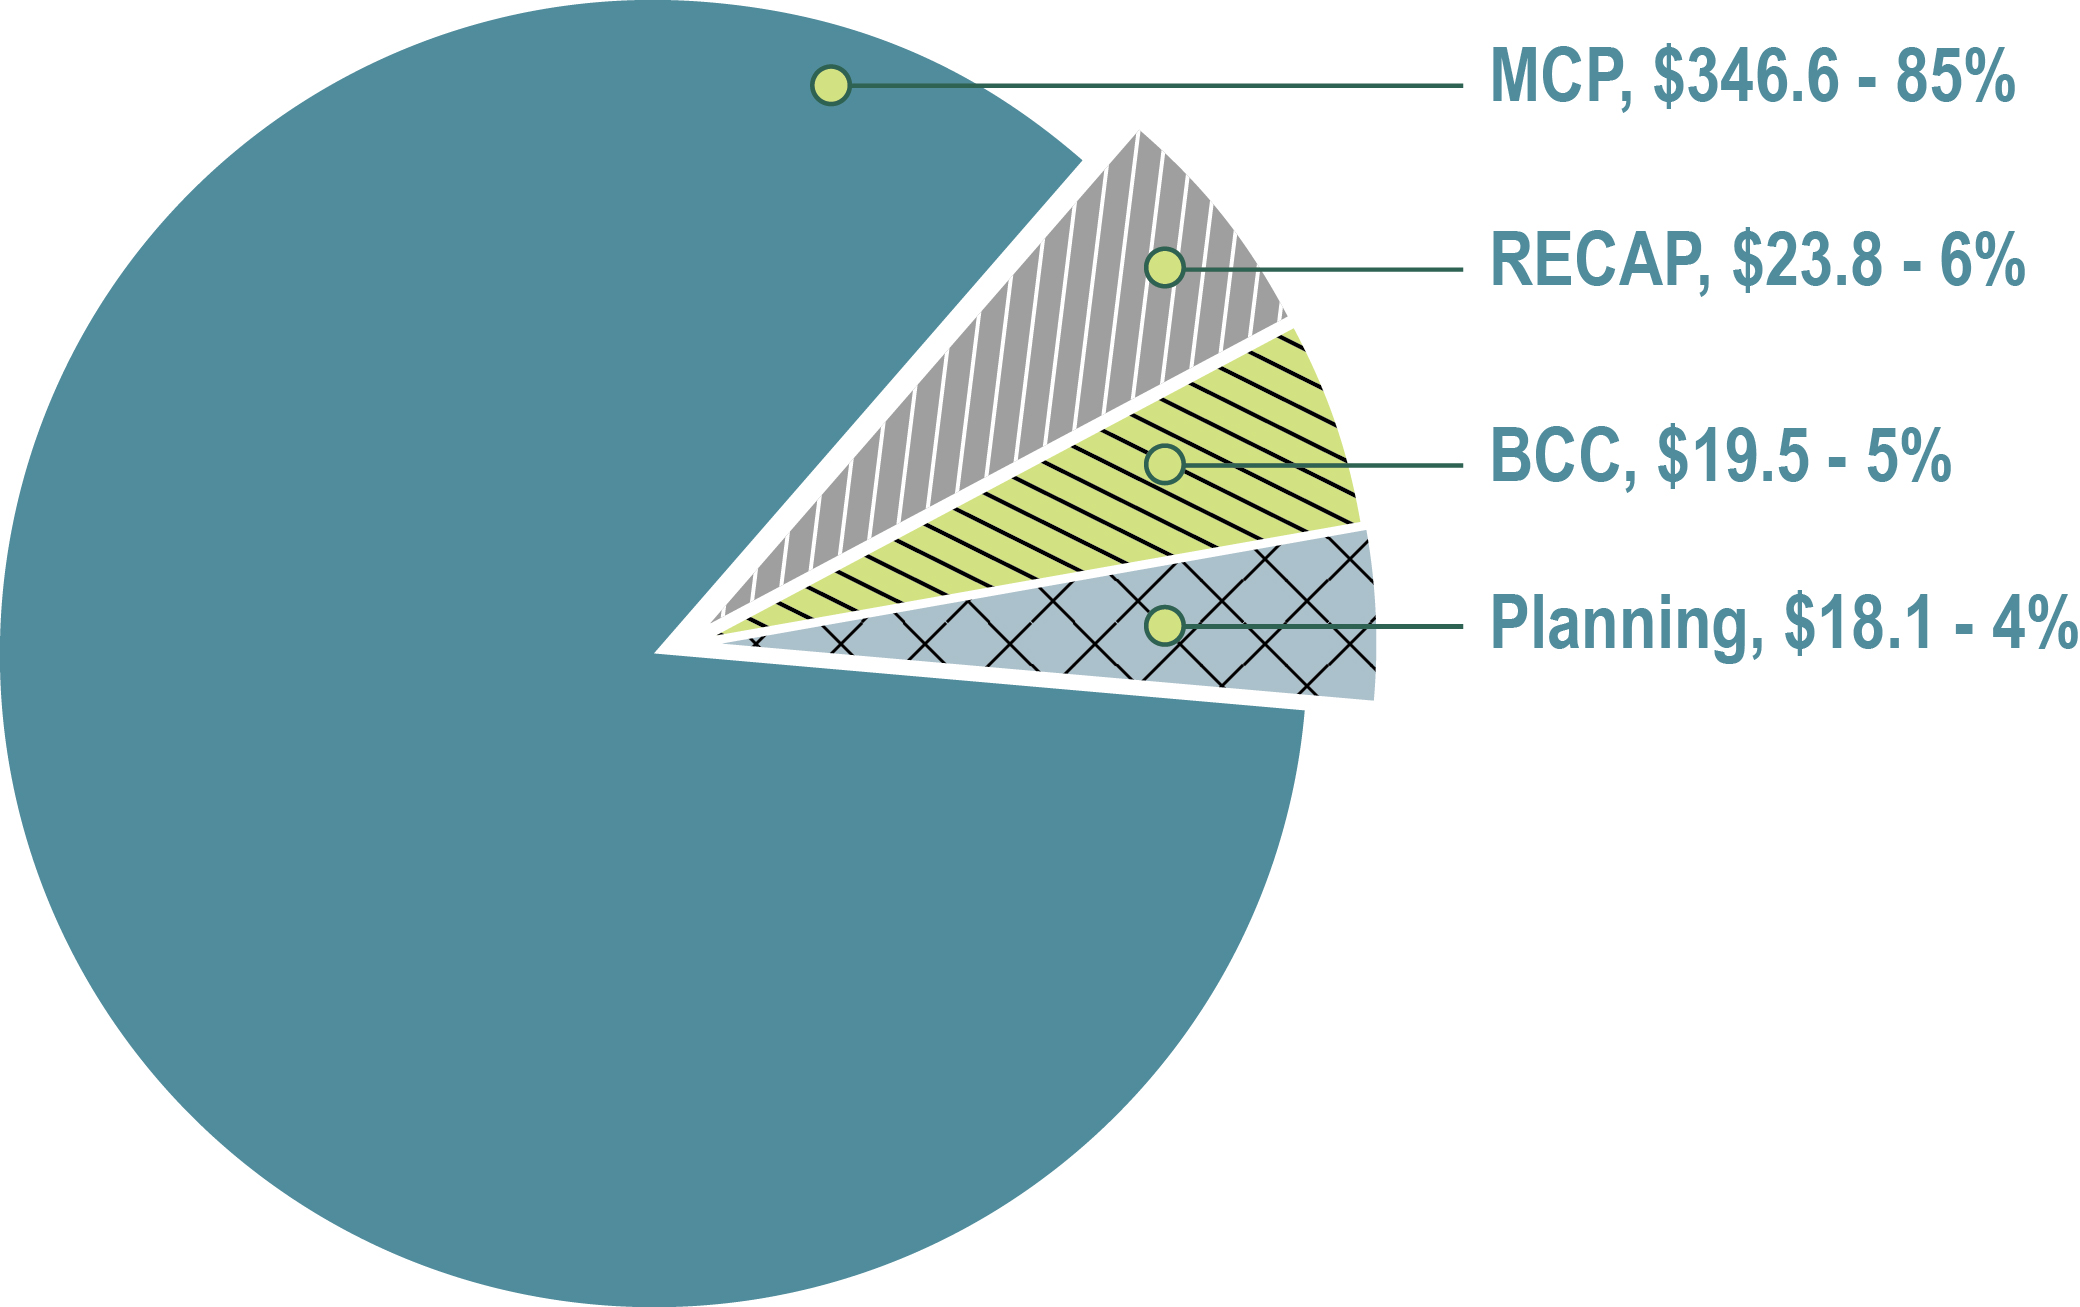
Table equivalent of figure 11—Total Long Term Vision and Plan budget by program—Fiscal year 2015 to 2016 (in millions of dollars)
| Program | Budget | Percentage |
|---|---|---|
| Major capital program (MCP) | $346.6 | 85% |
| Recapitalization program (RECAP) | $23.8 | 6% |
| Building Components and Connectivity Program (BCC) | $19.5 | 5% |
| Planning program | $18.1 | 4% |
Analysis of overall LTVP expenditures by cost category for fiscal year 2015 to 2016, as represented in Figure 12, indicates that the largest LTVP cost is construction at 61.6% of total expenditures, followed by professional fees at 17.9%. Professional fees include third-party expenditures in the areas of architecture and engineering, construction management, project management, business analysis, costing, scheduling and heritage conservation/preservation.
Figure 12—Total Long Term Vision and Plan expenditures by category—Fiscal year 2015 to 2016 (in millions of dollars)
Looking forward, overall LTVP expenditures are planned to increase as projects such as the West Block rehabilitation and Senate interim accommodations (Government Conference Centre) are completed and the next rolling program of work is implemented.
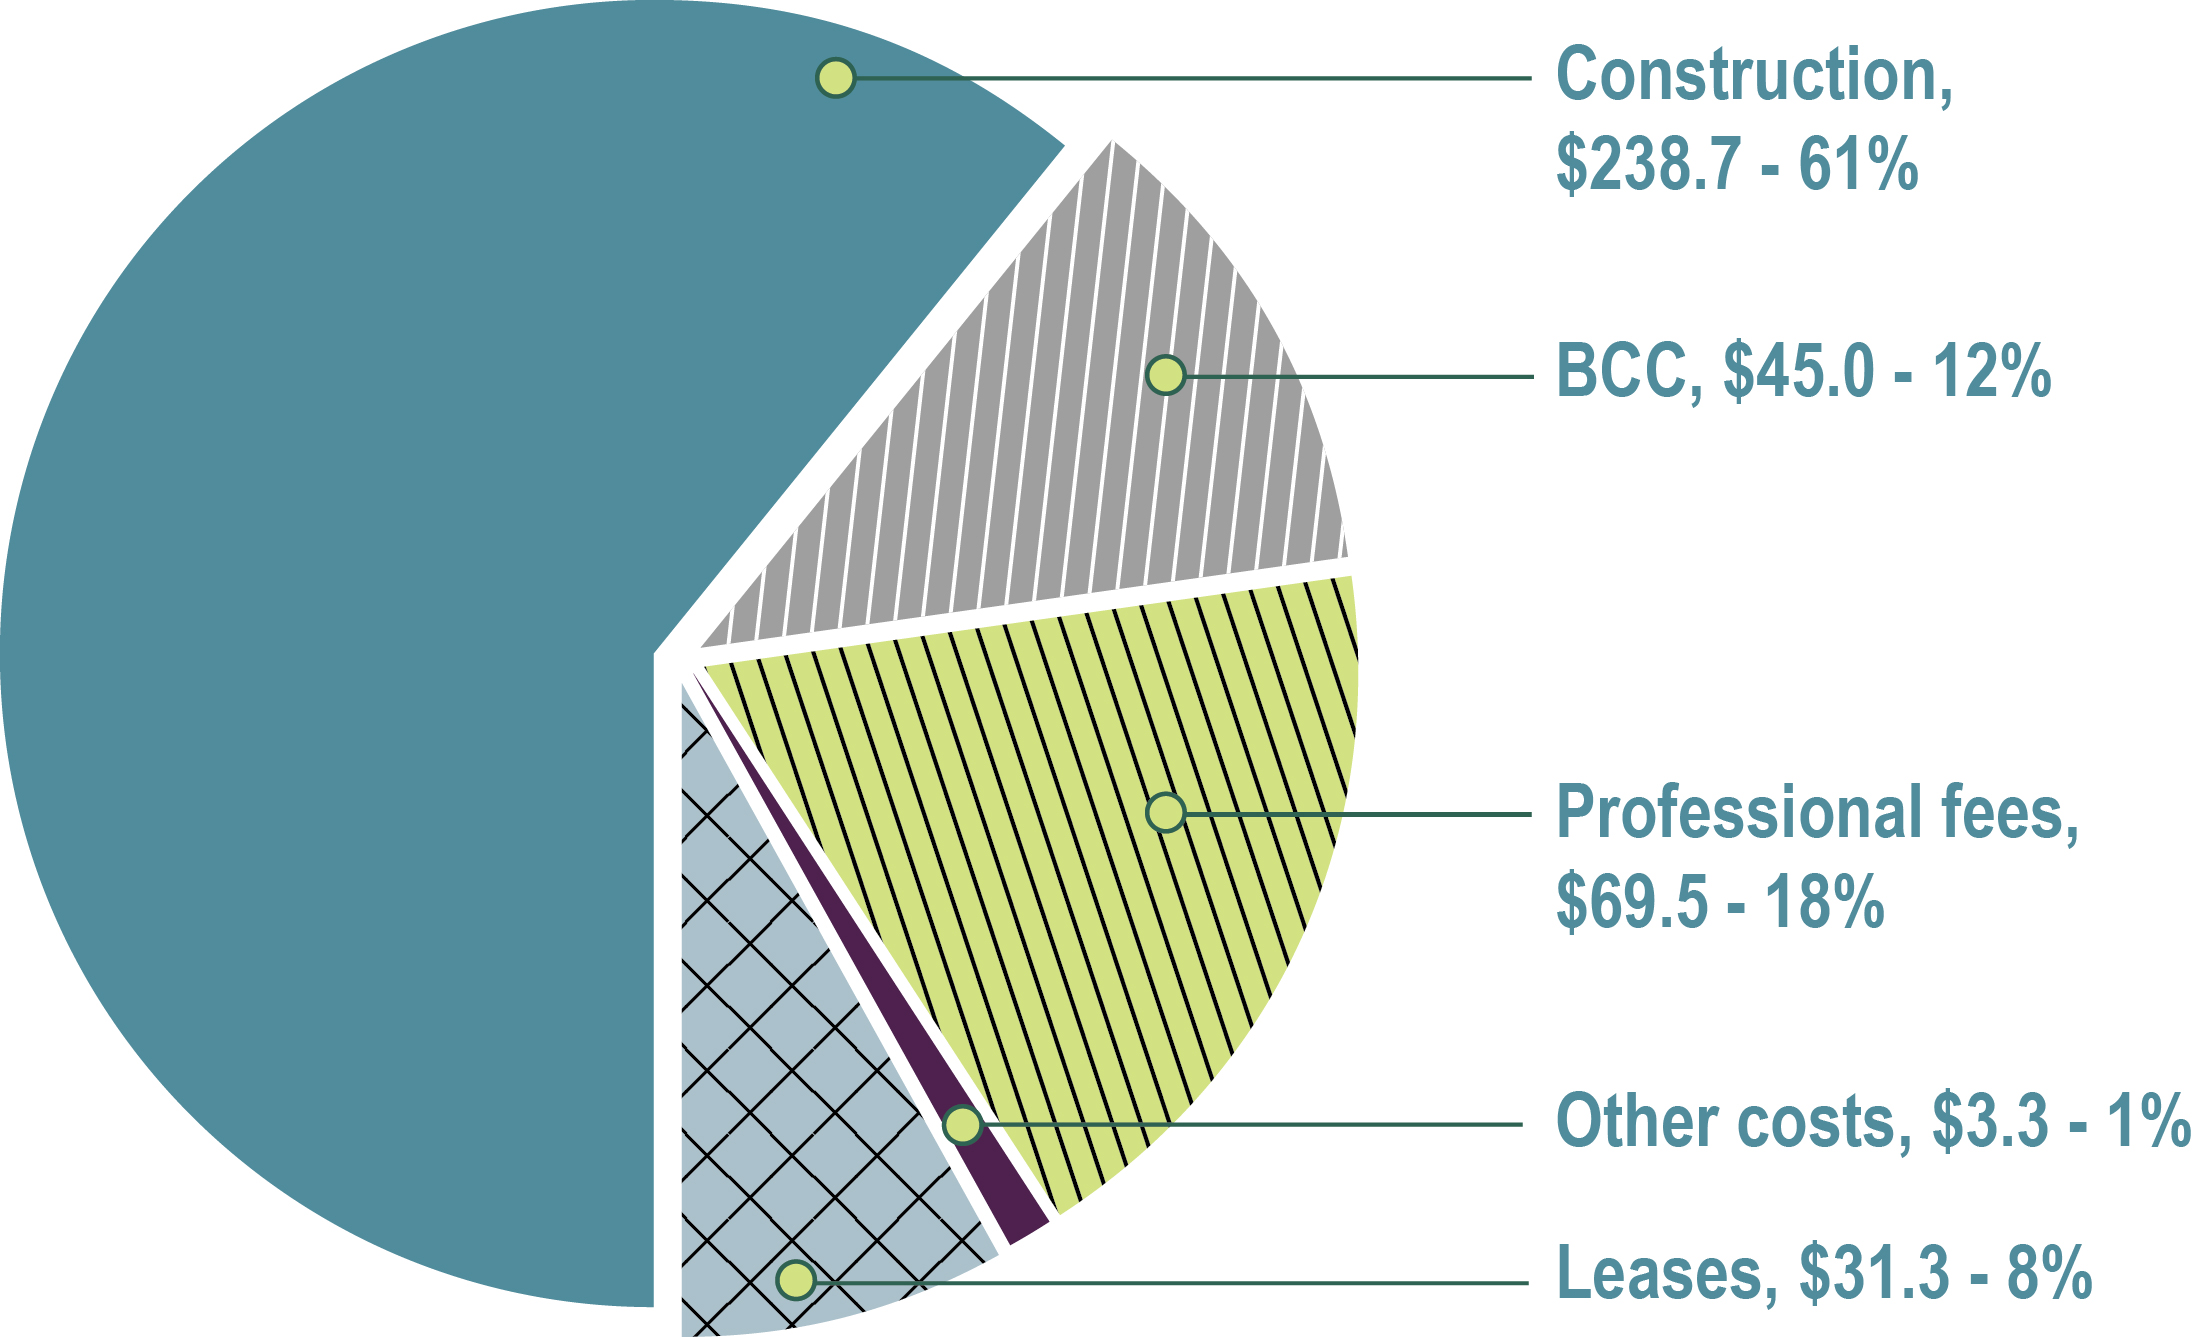
Table equivalent of figure 12—Total Long Term Vision and Plan expenditures by category—Fiscal year 2015 to 2016 (in millions of dollars)
| Category | Expenditures | Percentage |
|---|---|---|
| Construction | $238.7 | 61% |
| Building Components and Connectivity (BCC) | $45.0 | 12% |
| Professional fees | $69.5 | 18% |
| Other costs | $3.3 | 1% |
| Leases | $31.3 | 8% |
Major capital program
In fiscal year 2015 to 2016, MCP project expenditures were $328.0 million, an increase over expenditures in the previous fiscal year as shown in Figure 13. This increase reflects increased construction activity as projects progressed..
All MCP projects were on time, on budget, on scope..
Looking ahead, total annual expenditures within MCP are expected to increase over the coming years as ongoing construction projects are completed in advance of the Centre Block Rehabilitation Project and the planned implementation of the next rolling program of work.
Figure 13—Long Term Vision and Plan Major capital program cumulative expenditures, forecasts and budgets—Fiscal year 2015 to 2016 (in millions of dollars)
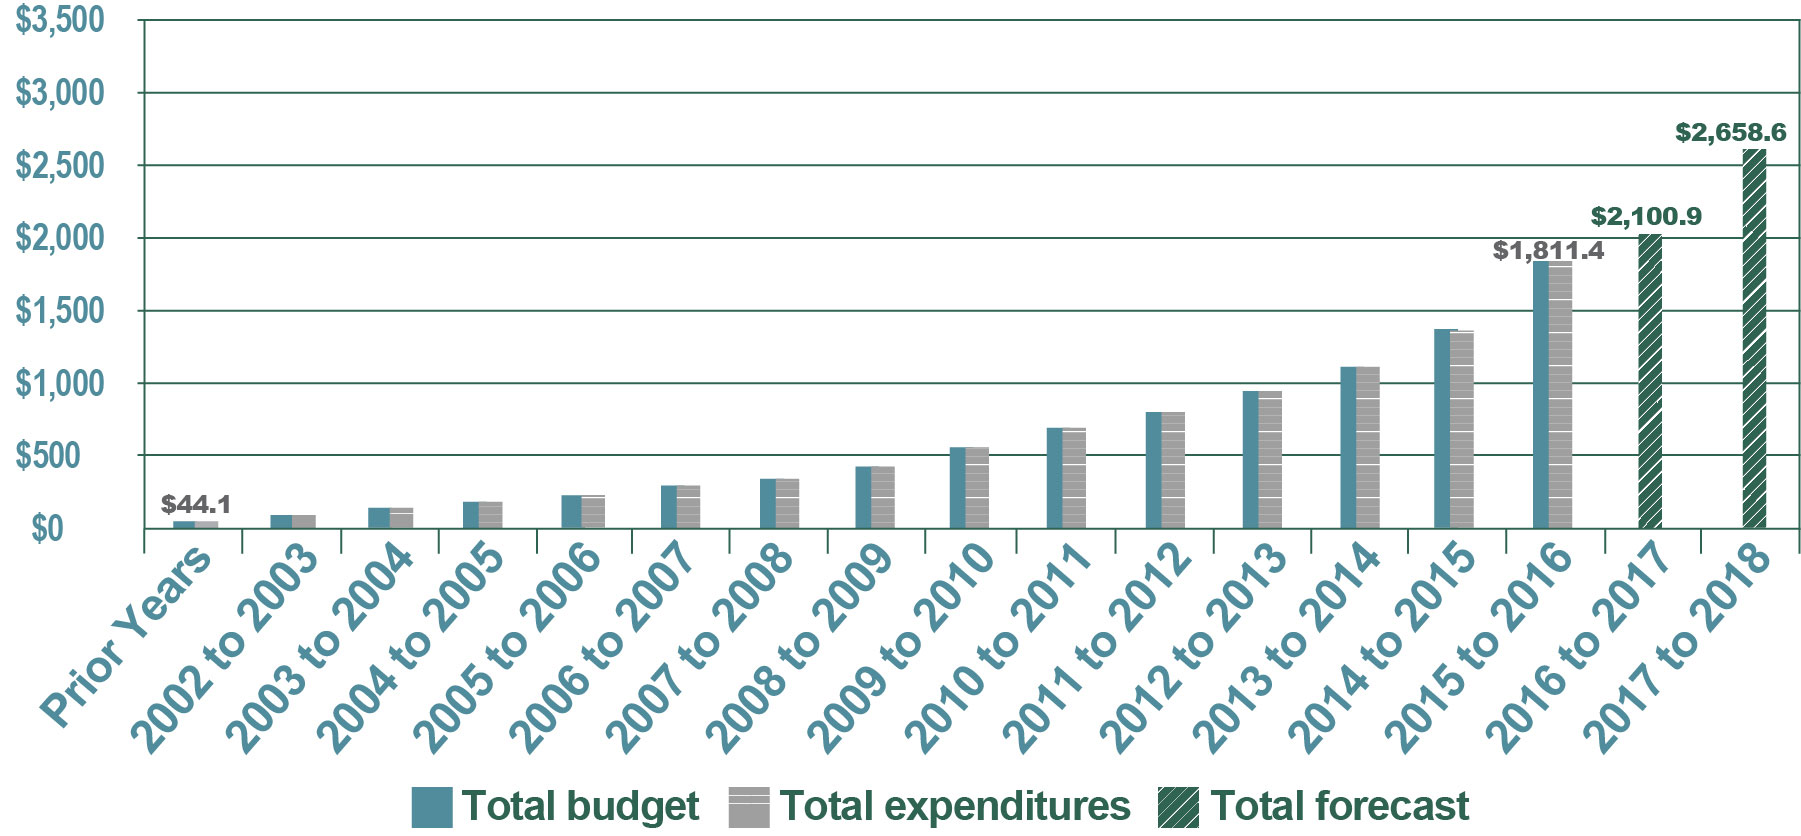
Table equivalent of figure 13—Long Term Vision and Plan Major capital program cumulative expenditures, forecasts and budgets—Fiscal year 2015 to 2016 (in millions of dollars)
| Year | Total budget | Total expenditures | Total forecast |
|---|---|---|---|
| Prior years | $46.0 | $44.1 | N/A |
| 2002 to 2003 | $75.1 | $70.6 | N/A |
| 2003 to 2004 | $98.5 | $109.4 | N/A |
| 2004 to 2005 | $139.1 | $153.8 | N/A |
| 2005 to 2006 | $203.7 | $198.1 | N/A |
| 2006 to 2007 | $269.0 | $265.5 | N/A |
| 2007 to 2008 | $327.9 | $323.8 | N/A |
| 2008 to 2009 | $390.0 | $390.1 | N/A |
| 2009 to 2010 | $511.3 | $510.8 | N/A |
| 2010 to 2011 | $621.0 | $623.7 | N/A |
| 2011 to 2012 | $747.1 | $749.2 | N/A |
| 2012 to 2013 | $949.9 | $929.6 | N/A |
| 2013 to 2014 | $1,196.5 | $1,176.4 | N/A |
| 2014 to 2015 | $1,497.9 | $1,483.3 | N/A |
| 2015 to 2016 | $1,844.5 | $1,811.4 | $1,811.4 |
| 2016 to 2017 | N/A | N/A | $2,100.9 |
| 2017 to 2018 | N/A | N/A | $2,658.6 |
Note: All forecasts are for currently approved projects and are subject to change.
Major capital program accomplishments—Fiscal year 2015 to 2016
For detailed descriptions of the key Major capital program projects, please refer to the Annexes section.
Wellington Building renovation—As of March 31, 2016, this project was substantially complete. The building envelope, landscaping work and the office fit up were completed and the installation of building components and connectivity continued with the full delivery and installation of the office furniture. The commissioning of building systems and the installation of IT cabling, multimedia/network equipment and communication technology are being completed.
West Block rehabilitation—As of March 31, 2016, this project was 72% complete and on schedule. Interior structural upgrades, including seismic, were completed while construction progressed on the north court structure. The excavation for the interim House of Commons Chamber courtyard infill was completed and construction progressed on the infill structure. Design and mock-ups were completed for the infill glass roof and rehabilitation work on the exterior masonry and existing roof advanced significantly. Progress was also made on the installation of the mechanical and electrical systems.
Visitor Welcome Centre—phase 1—As of March 31, 2016, this project was 54% complete and on schedule. Design and excavation were completed and construction of the concrete structure is underway.
Senate interim accommodations (Government Conference Centre)—As of March 31, 2016, this project was 31% complete and 3% ahead of schedule. Overall building design development was completed and the majority of construction tender packages were awarded, including the major packages for both mechanical and electrical building systems.
East Block 1867 wing exterior rehabilitation—The phased implementation of the East Block is currently under review to seek opportunities to accelerate its rehabilitation.
Parliament Hill emergency power—As of March 31, 2016, this project to increase emergency power capacity on Parliament Hill to support life safety, client operational and base-building requirements in the West Block and Visitor Welcome Centre—phase 1 was 37% complete and 3% ahead of schedule. A temporary generator was installed and deep excavation for the fuel storage tank is underway.
Perimeter safety hoarding and overhead protection—As of March 31, 2016, this project to provide perimeter safety hoarding and overhead protection around the Confederation Building and to relocate the adjacent daycare playground achieved 100% construction completion and was completed on schedule.
Centre Block rehabilitation, pre-planning design—As of March 31, 2016, the procurement process for design (i.e. architectural and engineering) and construction management services was well underway. Project requirements continued to be refined and supporting reports and projects were identified. Using Building Information Modelling (BIM) technology, significant progress was made in the development of a model reflecting the existing structure and condition of the building.
Major capital program targets—Fiscal year 2016 to 2017
Wellington Building renovation—The building will be occupied and fully operational by the fall of 2016.
West Block rehabilitation—The construction of the courtyard infill and north court structures will be completed and the installation of the glass roof will be initiated. Rehabilitative work on the roof and the exterior masonry will also be completed and new and restored windows installed. This project is scheduled for construction completion in 2017 and is expected to be approximately 87% complete by March 31, 2017.
Visitor Welcome Centre—phase 1—The concrete structure will be completed summer of 2016 and the installation of the mechanical and electrical systems will commence. This project is scheduled for construction completion in 2017 and is expected to be approximately 82% complete by March 31, 2017.
Senate interim accommodations (Government Conference Centre)—All remaining design packages will be awarded and exterior heritage masonry rehabilitation will be completed. Excavation and foundations will be completed for the east addition, including the new loading facility and the main entrance block (MEB) exterior stairwell. Structural steel for the new Senate Chamber and Committee Rooms and the new concrete slabs and slab in-fills in the MEB will be completed. Major heritage plaster rehabilitation and the mechanical and electrical building systems installation will commence. This project is scheduled for construction completion in 2018 and is expected to be approximately 48% complete by March 31, 2017.
East Block 1867 wing exterior rehabilitation—The development of a new rehabilitation implementation approach is expected for the East Block by March 31, 2017.
Parliament Hill emergency power—Excavation will be completed and the main generators will be procured and installed in the summer of 2016. Commissioning is scheduled for the fall of 2016 to support work on the West Block and Visitor Welcome Centre—phase 1. This project is scheduled for construction completion in 2017.
Centre Block rehabilitation—pre-design planning—Numerous feasibility studies and plans will be developed and/or finalized while preliminary work on supporting projects will be initiated. The procurement process will be completed and contracts for architectural and engineering, and construction management services will be awarded. The BIM model will be completed.
Recapitalization program
In fiscal year 2015 to 2016, RECAP project expenditures were $23.6 million, an increase over expenditures in the previous fiscal year as shown in Figure 14. This increase reflects the planned completion of all ongoing projects next fiscal year.
In fiscal year 2015 to 2016, all RECAP projects were on time, on budget, on scope, with the exception of the west slope rehabilitation project which was delayed following a decision to allow work to be completed in the spring/summer of 2016 to avoid winter weather conditions.
Looking ahead, total annual expenditures within the RECAP program are expected to remain steady over the coming years with the planned implementation of the next rolling program of work.
Figure 14—Long Term Vision and Plan Recapitalization program cumulative expenditures, forecasts and budgets—Fiscal year 2015 to 2016 (in millions of dollars)
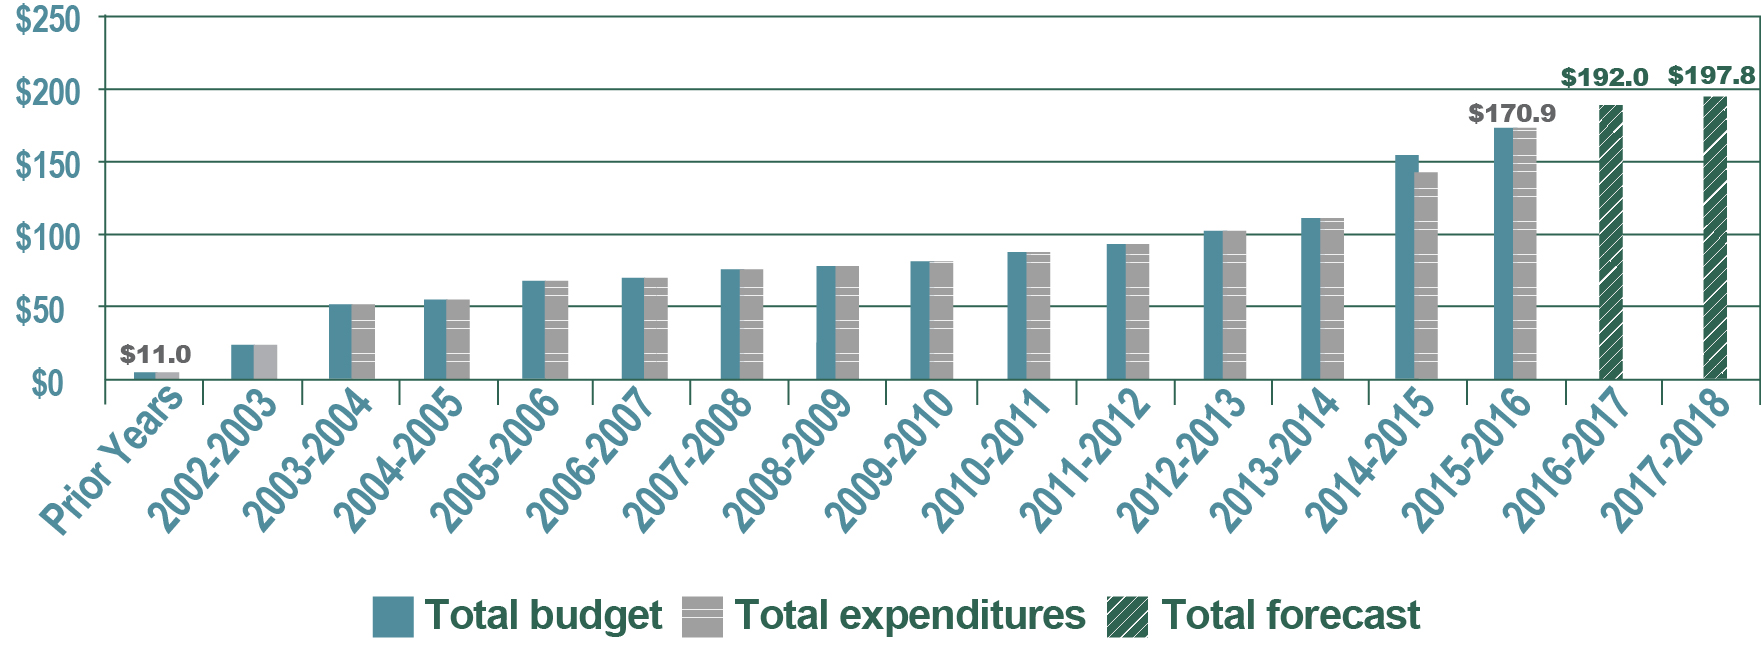
Table equivalent of figure 14—Long Term Vision and Plan Recapitalization program cumulative expenditures, forecasts and budgets—Fiscal year 2015 to 2016 (in millions of dollars)
| Year | Total budget | Total expenditures | Total forecast |
|---|---|---|---|
| Prior years | $11.0 | $11.0 | N/A |
| 2002 to 2003 | $25.4 | $25.4 | N/A |
| 2003 to 2004 | $51.0 | $51.0 | N/A |
| 2004 to 2005 | $57.7 | $57.7 | N/A |
| 2005 to 2006 | $61.4 | $61.4 | N/A |
| 2006 to 2007 | $64.6 | $64.6 | N/A |
| 2007 to 2008 | $70.0 | $70.0 | N/A |
| 2008 to 2009 | $73.5 | $73.5 | N/A |
| 2009 to 2010 | $75.9 | $75.9 | N/A |
| 2010 to 2011 | $83.4 | $83.3 | N/A |
| 2011 to 2012 | $97.9 | $96.8 | N/A |
| 2012 to 2013 | $113.3 | $112.7 | N/A |
| 2013 to 2014 | $128.5 | $128.5 | N/A |
| 2014 to 2015 | $151.5 | $147.3 | N/A |
| 2015 to 2016 | $175.3 | $170.9 | N/A |
| 2016 to 2017 | N/A | N/A | $192.0 |
| 2017 to 2018 | N/A | N/A | $197.8 |
Note: All forecasts are for currently approved projects and are subject to change.
Recapitalization program accomplishments—Fiscal year 2015 to 2016
Centre Block—House of Commons Chamber modifications—As of March 31, 2016, this project to accommodate 30 new Members of Parliament in the House of Commons Chamber in accordance with the Fair Representation Act achieved 100% construction completion and was completed on schedule and in time for the general election.
Centre Block—Chamber stained glass windows—As of March 31, 2016, this project to remove, dismantle and preserve six stained glass heritage windows in the House of Commons Chamber achieved 100% construction completion and was completed on schedule.
Confederation Building—high/low voltage system upgrade—As of March 31, 2016, this project to upgrade building electrical system components to ensure the building remains safe and serviceable achieved 100% construction completion and was completed on schedule.
West slope infrastructure rehabilitation—As of March 31, 2016, this project to rehabilitate the structural elements on the west slope including the stairway, storm sewer, Victoria lookout and additional work was 98% complete. The completion of the project was delayed to avoid winter weather conditions and allow deficiencies to be addressed in spring/summer 2016.
Centre Block—East and West Pavilions envelope rehabilitation—As of March 31, 2016, this project to rehabilitate the envelope (including masonry and roof), stabilize windows, and conduct partial seismic upgrades was 90% complete and ahead of schedule. Rehabilitation work continued on the East Pavilion where significant progress was made on the roof, the turrets and the exterior envelope masonry.
Centre Block—ventilation towers envelope rehabilitation—As of March 31, 2016, this project to rehabilitate the envelope of the Senate and House of Commons towers (including masonry, roof, windows, louvers) and to undertake full seismic upgrades was 80% complete and ahead of schedule. The rehabilitation of and seismic upgrades to the Senate tower were completed and work continued on the House of Commons tower.
Confederation Building—window frame stabilization and sash rehabilitation—As of March 31, 2016, this project to rehabilitate 1664 original and deteriorating sashes (inner frames holding the window panes in place)—within 447 original window units to stop water infiltration and associated damage was 80% complete and on schedule.
North perimeter wall rehabilitation—Parliament Hill grounds—As of March 31, 2016, this project to rehabilitate the north perimeter masonry wall, iron fence and pathway was 89% complete and on schedule.
Recapitalization program targets—Fiscal year 2016 to 2017
West slope infrastructure rehabilitation—The project will be completed and deficiencies addressed with overall construction completion expected in 2016.
Centre Block—East and West Pavilions envelope rehabilitation—The rehabilitation of the roof and masonry walls of the East Pavilion will be completed and overall construction completion is expected in 2016.
Centre Block—ventilation towers envelope rehabilitation—Construction on the House of Commons tower will be completed with overall construction completion expected in 2016.
Confederation Building—window frame stabilization and sash rehabilitation—All sashes will be rehabilitated and window frames repaired and installed. Overall construction completion is expected in 2016.
North perimeter wall rehabilitation—Parliament Hill grounds—The wall masonry will be completed and the rehabilitated ironwork and limestone pathway will be installed with overall construction completion expected in 2016.
Building Components and Connectivity program
In fiscal year 2015 to 2016, BCC project expenditures were $23.1 million, an increase over expenditures in the previous fiscal year as shown in Figure 15. This increase reflects increased construction activity.
In fiscal year 2015 to 2016, all BCC projects were on time, on budget, on scope. All projects remained within their approved Project and Expenditure Authorities; however, annual program expenditures increased due to two new projects.
Looking ahead, total annual expenditures for the BCC program are expected to increase over the coming years with the completion of current projects and the planned implementation of the next rolling program of work.
Figure 15—Long Term Vision and Plan Building Components and Connectivity program cumulative expenditures, forecasts and budgets—Fiscal year 2015 to 2016 (in millions of dollars)
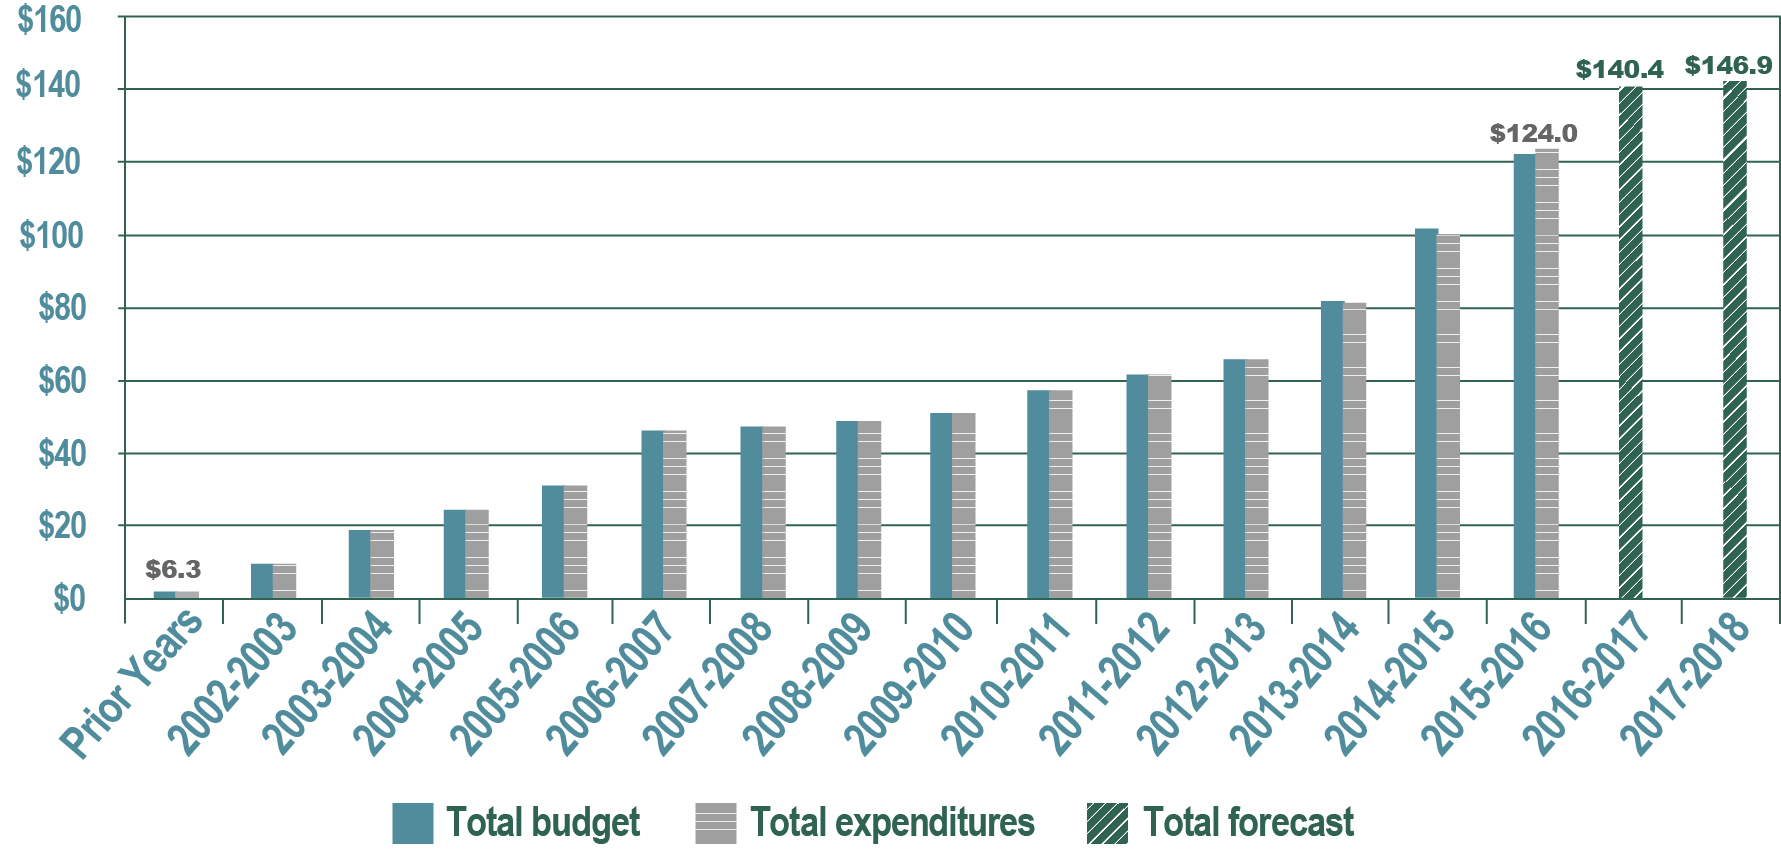
Table equivalent of figure 15—Long Term Vision and Plan Building Components and Connectivity program cumulative expenditures, forecasts and budgets—Fiscal year 2015 to 2016 (in millions of dollars)
| Year | Total budget | Total expenditures | Total forecast |
|---|---|---|---|
| Prior years | $6.3 | $6.3 | N/A |
| 2002 to 2003 | $11.5 | $11.5 | N/A |
| 2003 to 2004 | $19.0 | $19.0 | N/A |
| 2004 to 2005 | $26.1 | $26.1 | N/A |
| 2005 to 2006 | $33.9 | $33.9 | N/A |
| 2006 to 2007 | $45.9 | $45.9 | N/A |
| 2007 to 2008 | $49.4 | $49.4 | N/A |
| 2008 to 2009 | $51.6 | $51.6 | N/A |
| 2009 to 2010 | $52.6 | $52.6 | N/A |
| 2010 to 2011 | $58.3 | $58.1 | N/A |
| 2011 to 2012 | $61.6 | $61.5 | N/A |
| 2012 to 2013 | $66.8 | $66.5 | N/A |
| 2013 to 2014 | $82.1 | $81.5 | N/A |
| 2014 to 2015 | $103.4 | $100.9 | N/A |
| 2015 to 2016 | $122.9 | $124.0 | N/A |
| 2016 to 2017 | N/A | N/A | $140.4 |
| 2017 to 2018 | N/A | N/A | $146.9 |
Note: All projects are for currently approved projects and are subject to change.
Building Components and Connectivity program accomplishments—Fiscal year 2015 to 2016
Wireless networking—As of March 31, 2016, this connectivity project to upgrade and modernize communications by deploying Wi-Fi capability throughout the Parliamentary Precinct was 85% complete and on schedule. Supporting fit-up work (including power, cooling and conduit upgrades) was completed in the majority of the buildings to support the installation and operation of equipment.
Trunked radio communication system—As of March 31, 2016, this project to upgrade and improve the capabilities of the existing radio communication system was 96% complete and on schedule. Final testing was completed and the new trunked radio communications system was deployed and commissioned throughout the Precinct. The new system is now in service and the decommissioning of the old system is well underway.
Integrated security system upgrade—As of March 31, 2016, this project to support increasing security demands within the Precinct was 75% complete and on schedule.
Core network infrastructure revision—As of March 31, 2016, this connectivity project to upgrade and modernize computer networking and deploy up-to-date Internet technologies throughout the Precinct was 85% complete and on schedule. The telecommunications rooms were converted to the new technology and data facility upgrades are underway.
Parliament Hill pathway connectivity—As of March 31, 2016, this project to build redundant cabling pathways on Parliament Hill to ensure that connectivity in the Precinct is not disrupted was 83% complete and on schedule. Planning for the permanent west pathway advanced significantly.
Next generation network infrastructure—telephony—As of March 31, 2016, this project to transition from traditional land line telephony to Voice over Internet Protocol (VoIP) telephony was 25% complete and on schedule.
Master control and distribution upgrade—As of March 31, 2016, this project to modernize the audio/video broadcast distribution network and master control facilities within the Precinct to meet additional demands from new and renovated buildings and to support digital and high definition formats was 85% complete and on schedule.
Building Components and Connectivity program targets—Fiscal year 2016 to 2017
Wireless networking—Supporting fit-up work (including power, cooling and conduit upgrades) will be completed, along with the installation of Wi-Fi connectivity, in the remaining buildings. This project is expected to achieve construction completion by March 31, 2017.
Trunked radio communication system—Decommissioning of the old system will be completed and overall construction completion is expected in 2016.
Integrated security system upgrade—This project is scheduled for construction completion in 2017 and is expected to be approximately 95% complete by March 31, 2017.
Core network infrastructure revision—The upgrades to the data facilities will be completed and overall construction completion is expected by March 31, 2017.
Parliament Hill pathway connectivity—Design and planning for the west pathway will approach completion. This project is scheduled for construction completion in 2018 and is expected to be approximately 85% complete by March 31, 2017.
Next generation network infrastructure—telephony—The Wellington Building will be transitioned to VoIP telephony and design for the transitioning of the Government Conference Centre and the West Block will commence. This project is scheduled for construction completion in 2018 and is expected to be approximately 50% complete by March 31, 2017.
Master control and distribution upgrade—Equipment will be fully installed and the commissioning of the master control will be completed by the fall of 2016 (in time to support the opening of the Wellington Building).
Planning program
In fiscal year 2015 to 2016, Planning project expenditures were $13.1 million, an increase over expenditures in the previous fiscal year as shown in Figure 16. Looking ahead, total annual expenditures for the Planning program are expected to increase over the coming years with the planned implementation of the next five-year rolling program of work including projects in support of the update of the LTVP.
Figure 16—Long Term Vision and Plan Planning program cumulative expenditures, forecasts and budgets—Fiscal year 2015 to 2016 (in millions of dollars)
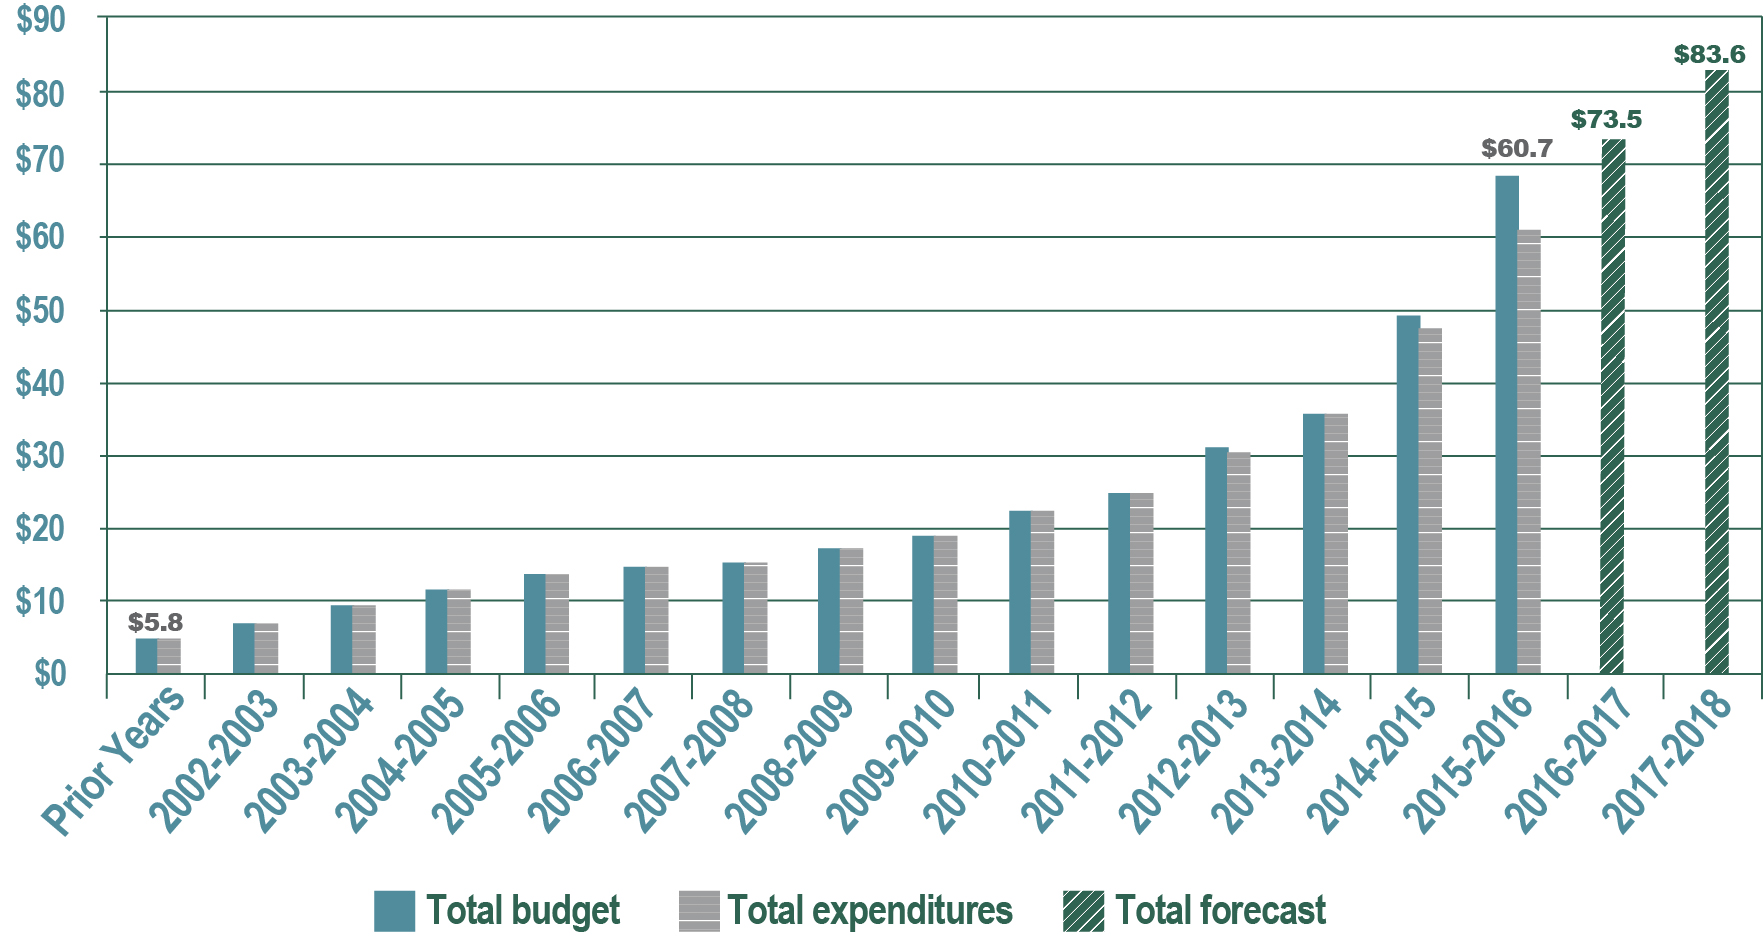
Table equivalent of figure 16—Long Term Vision and Plan Planning program cumulative expenditures, forecasts and budgets—Fiscal year 2015 to 2016 (in millions of dollars)
| Year | Total budget | Total expenditures | Total forecast |
|---|---|---|---|
| Prior years | $5.8 | $5.8 | N/A |
| 2002 to 2003 | $7.5 | $7.5 | N/A |
| 2003 to 2004 | $9.8 | $9.8 | N/A |
| 2004 to 2005 | $11.8 | $11.8 | N/A |
| 2005 to 2006 | $14.4 | $14.4 | N/A |
| 2006 to 2007 | $15.6 | $15.6 | N/A |
| 2007 to 2008 | $16.0 | $16.0 | N/A |
| 2008 to 2009 | $17.5 | $17.5 | N/A |
| 2009 to 2010 | $19.3 | $19.3 | N/A |
| 2010 to 2011 | $23.0 | $23.0 | N/A |
| 2011 to 2012 | $27.0 | $26.9 | N/A |
| 2012 to 2013 | $31.4 | $30.8 | N/A |
| 2013 to 2014 | $37.0 | $36.9 | N/A |
| 2014 to 2015 | $49.4 | $47.6 | N/A |
| 2015 to 2016 | $67.4 | $60.7 | N/A |
| 2016 to 2017 | N/A | N/A | $73.5 |
| 2017 to 2018 | N/A | N/A | $83.6 |
Note: All forecasts are for currently approved projects and are subject to change.
Planning program accomplishments—Fiscal year 2015 to 2016
Exterior lighting master plan—As of March 31, 2016, this project to develop a comprehensive plan for exterior lighting in the Precinct including building and site improvements was 100% complete and completed on schedule.
Material management master plan—As of March 31, 2016, this project to develop a Campus-wide material management strategy was 80% complete. Extensive stakeholder consultations were conducted to ensure the integration of short-and long-term needs and the Campus approach in the delivery of the LTVP.
Emergency power master plan—As of March 31, 2016, this project to review the emergency power needs and service levels throughout various stages of the LTVP was 80% complete and on schedule. A strategy for ensuring adequate emergency power for existing and new Precinct buildings north of Wellington is underway.
Underground infrastructure master plan—As of March 31, 2016, this project to confirm the serviceability of the LTVP and provide strategic guidance and coordination of municipal, mechanical/electrical and IT underground services for future LTVP projects was 25% complete and on schedule.
Planning program targets—Fiscal year 2016 to 2017
Material management master plan—The Campus-wide material management strategy is expected to be further analyzed, developed and aligned with the direction of the LTVP. The final strategy will be developed in support of the completion of an updated master plan and is expected to be complete in 2016.
Emergency power master plan—The Campus-wide emergency power strategy, final project report and recommendations for building rehabilitation projects will be completed with the overall project scheduled for completion in 2016.
Underground infrastructure master plan—This project is scheduled for completion in 2016.
Annual and quarterly on time, on scope, on budget results
Public Service and Procurement Canada's 2015 to 2016 Report on Plans and Priorities established targets that all Parliamentary Precinct rehabilitation and construction projects greater than $1.0 million be within 90% of their time, budget and scope targets for the fiscal year. As shown in Figure 17, all MCP and BCC projects exceeded their targets for the fiscal year with RECAP projects just under 90%, illustrating PPB's solid project management capabilities and continued success in the delivery of capital projects. (Note: Planning is not included in this evaluation as the program does not have any capital projects.)
Figure 17—Long Term Vision and Plan on-time, on-scope, on budget performance—Fiscal year 2015 to 2016
| Indicator | Target | Result |
|---|---|---|
| Percentage of Major capital program construction projects greater than $1 million that are on time, on scope and on budget | Greater than or equal to 90% | 100% |
| Percentage of Recapitalization program projects greater than $1 million that are on time, on scope and on budget | Greater than or equal to 90% | 88% |
| Percentage of Building Components and Connectivity program projects greater than $1 million that are on time, on scope and on budget | Greater than or equal to 90% | 100% |
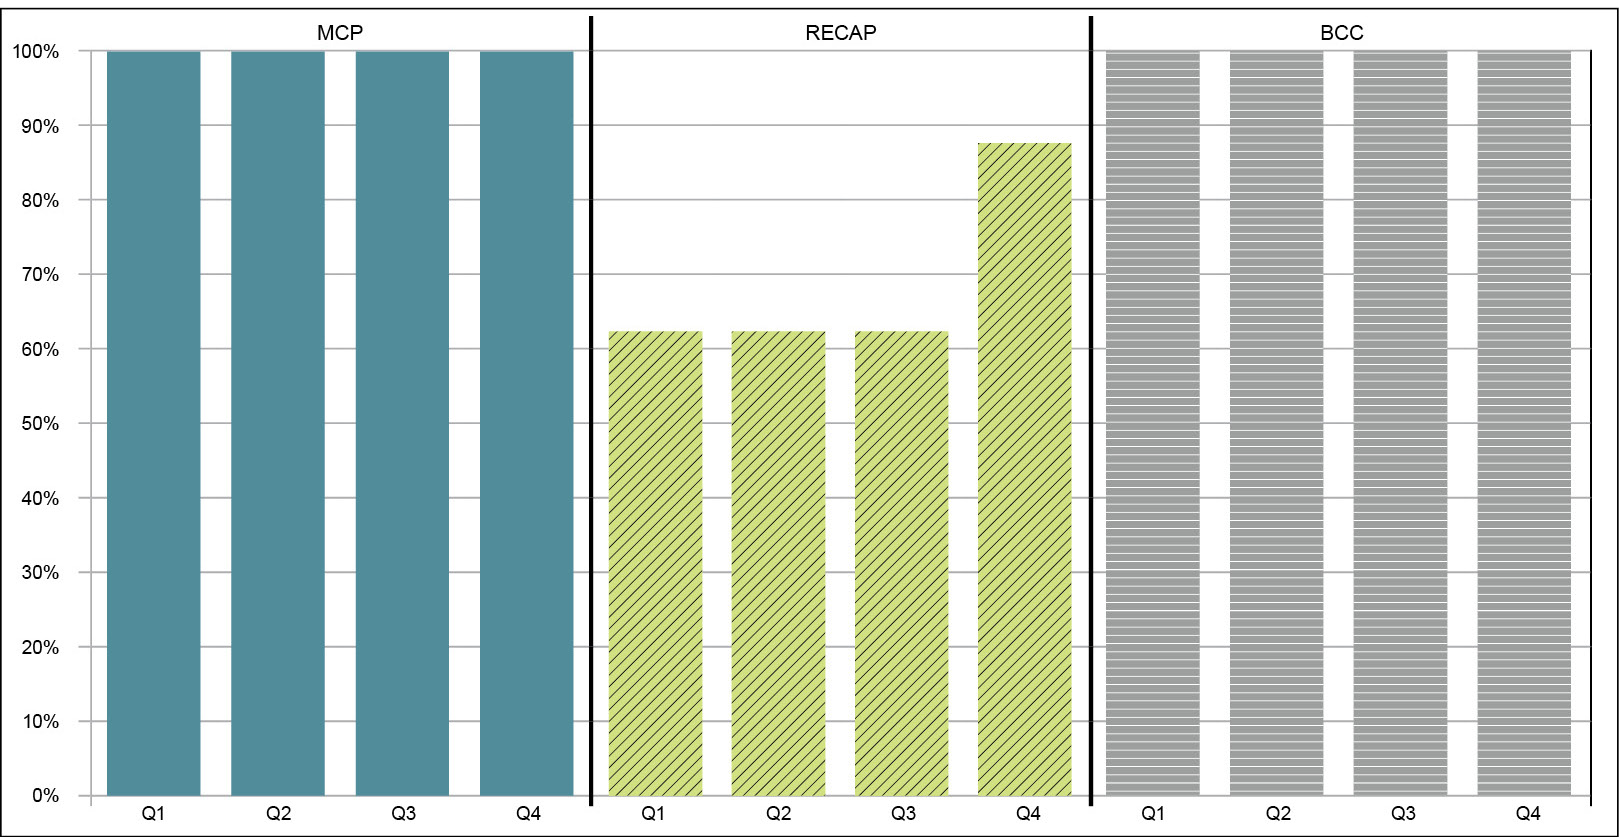
Table equivalent of figure 17—Long Term Vision and Plan on-time, on-scope, on budget performance—Fiscal year 2015 to 2016
| Program | Percentage quarter 1 |
Percentage quarter 2 |
Percentage quarter 3 |
Percentage quarter 4 |
|---|---|---|---|---|
| Major capital program (MCP) | 100% | 100% | 100% | 100% |
| Recapitalization program (RECAP) | 63% | 63% | 63% | 88% |
| Building Components and Connectivity (BCC) program | 100% | 100% | 100% | 100% |
Figure 18—Detailed quarterly on time, on budget, on scope evaluations
| Project name | Key performance indicators (KPI) | First quarter | Second quarter | Third quarter | Fourth quarter |
|---|---|---|---|---|---|
| West Block rehabilitation | On time | green | green | green | green |
| On scope | green | green | green | green | |
| On budget | green | green | green | green | |
| Wellington Building renovation | On time | green | green | green | green |
| On scope | green | green | green | green | |
| On budget | green | green | green | green | |
| Visitor Welcome Centre—phase 1 | On time | green | green | green | green |
| On scope | yellow | yellow | green | green | |
| On budget | green | green | green | green | |
| Senate interim accommodations (Government Conference Centre) | On time | green | green | green | green |
| On scope | green | green | yellow | green | |
| On budget | green | green | yellow | green | |
| East Block 1867 wing exterior rehabilitation | On time | green | green | green | green |
| On scope | green | green | green | green | |
| On budget | green | green | green | green | |
| Parliament Hill emergency power | On time | N/A | green | green | green |
| On scope | N/A | green | green | green | |
| On budget | N/A | green | green | green | |
| Perimeter safety hoarding and overhead protection | On time | green | green | green | green |
| On scope | green | green | green | green | |
| On budget | green | green | green | green |
| Project name | KPI | First quarter | Second quarter | Third quarter | Fourth quarter |
|---|---|---|---|---|---|
| Centre Block ventilation towers envelope rehabilitation | On time | green | green | green | green |
| On scope | green | green | green | green | |
| On budget | green | green | green | green | |
| Centre Block East and West Pavilions envelope rehabilitation | On time | green | green | green | green |
| On scope | green | green | green | green | |
| On budget | green | green | green | green | |
| Centre Block various short-term repairs | On time | green | green | green | green |
| On scope | green | green | green | green | |
| On budget | green | green | green | green | |
| Centre Block House of Commons Chamber modifications | On time | red | red | red | green |
| On scope | green | green | green | green | |
| On budget | green | green | green | green | |
| Confederation Building high/low voltage system | On time | green | green | green | green |
| On scope | green | green | green | green | |
| On budget | green | green | green | green | |
| Confederation Building window frame stabilization and sash rehabilitation | On time | red | red | red | green |
| On scope | green | green | green | green | |
| On budget | green | green | green | green | |
| North perimeter wall rehabilitation Parliament Hill grounds | On time | green | green | green | green |
| On scope | green | green | green | green | |
| On budget | green | green | green | green | |
| West slope infrastructure rehabilitation | On time | red | red | red | red |
| On scope | green | green | green | green | |
| On budget | green | green | green | green |
| Project name | KPI | First quarter | Second quarter | Third quarter | Fourth quarter |
|---|---|---|---|---|---|
| Wireless networking | On time | green | green | green | green |
| On scope | green | green | green | green | |
| On budget | green | green | green | green | |
| Trunked radio communication system | On time | green | green | green | green |
| On scope | green | green | green | green | |
| On budget | green | green | green | green | |
| Integrated security system upgrade and expansion | On time | green | green | green | green |
| On scope | green | green | green | green | |
| On budget | green | green | green | green | |
| Core network infrastructure revision | On time | green | green | green | green |
| On scope | green | green | green | green | |
| On budget | green | green | green | green | |
| Parliament Hill pathway connectivity | On time | green | green | green | green |
| On scope | green | green | green | green | |
| On budget | green | green | green | green | |
| Next generation network infrastructure—telephony | On time | N/A | N/A | N/A | green |
| On scope | N/A | N/A | N/A | green | |
| On budget | N/A | N/A | N/A | green | |
| Master control and distribution upgrade | On time | green | green | green | green |
| On scope | green | green | green | green | |
| On budget | green | green | green | green |
Table equivalent of figure 18—Detailed quarterly on time, on budget, on scope evaluations
| Evaluations | Green Optimal performance |
Yellow Not currently in line with the baseline, but within approved parameters |
Red At risk of requiring new approvals. Not within approved parameters |
Not applicable |
|---|---|---|---|---|
| On time | The project milestones are currently in line with the approved schedule. The overall project completion date will also be respected. | The project milestones are not currently in line with the approved schedule, but the overall project completion date will be respected. | The project milestones are not currently in line with the approved schedule, nor will the overall approved timeline be respected. | Not applicable |
| On scope | The project requirements (scope) are known and requirements changes have no impact on the project. | The project requirements are not clear. The requirements changes may impact the project negatively. |
The project requirements are not known. The requirements changes will impact negatively the project. |
Not applicable |
| On budget | The project current expenditures and forecasted expenditures are within the approved Expenditure and Project Authorities. | The project current expenditures are not in line with the plan, but the forecasted expenditures (including the risk allowance) do not exceed the Expenditure Authority or the Project Authority. | The project current expenditures forecast exceed the Expenditure Authority or the Project Authority. | Not applicable |
Other performance results
The Parliamentary Precinct Branch continues to review and build on existing performance measures to ensure their alignment with strategic goals and overall relevance to the evolving program and to enhance their overall effectiveness as results-based indicators. To further assess and monitor the overall health of the LTVP, a number of new performance metrics are included in the 2016 Annual Report. Existing and new metrics continue to rely on relevant and meaningful indicators that support continuous improvement and informed and timely decision making.
Figure 19—Long Term Vision and Plan performance results—Fiscal year 2015 to 2016
Table summary
This table consists of four columns: Metric, Indicator, Target and Result. Performance metrics ensure alignment with strategic goals to enhance the overall health of the LTVP.
| Metric | Indicator | Target | Result |
|---|---|---|---|
| Uninterrupted operations of Parliamentarians | Number of hours per annum that essential property management services are not provided for the ongoing operations of Parliament | No more than 48 hours of disruption per annum |
|
| Life-cycle assessments | All new building construction and major renovation projects over $5 million will undergo a life-cycle assessment, to be included in project approval documents | 100% |
|
| Waste diversion | Percentage of construction waste diverted from landfill | Construction, renovation and demolition projects greater than $1 million will achieve a minimum waste diversion target of 80% |
|
| Sustainability |
|
|
|
Risk and contingency
Figure 20 provides an overview of cumulative contingency and risk allowances for the key projects within the Major capital program. Contingency and risk usage is monitored and reported on a monthly basis. Usage values reflect funds spent and/or committed, over the life of the project, to perform approved project work which is deemed to be a planned contingency element or within the scope of a project's risk plan. Unused values reflect the remainder of the respective overall allowances which are not spent or committed.
Figure 20—Major capital program risk and contingency data—Cumulative at fiscal year 2015 to 2016
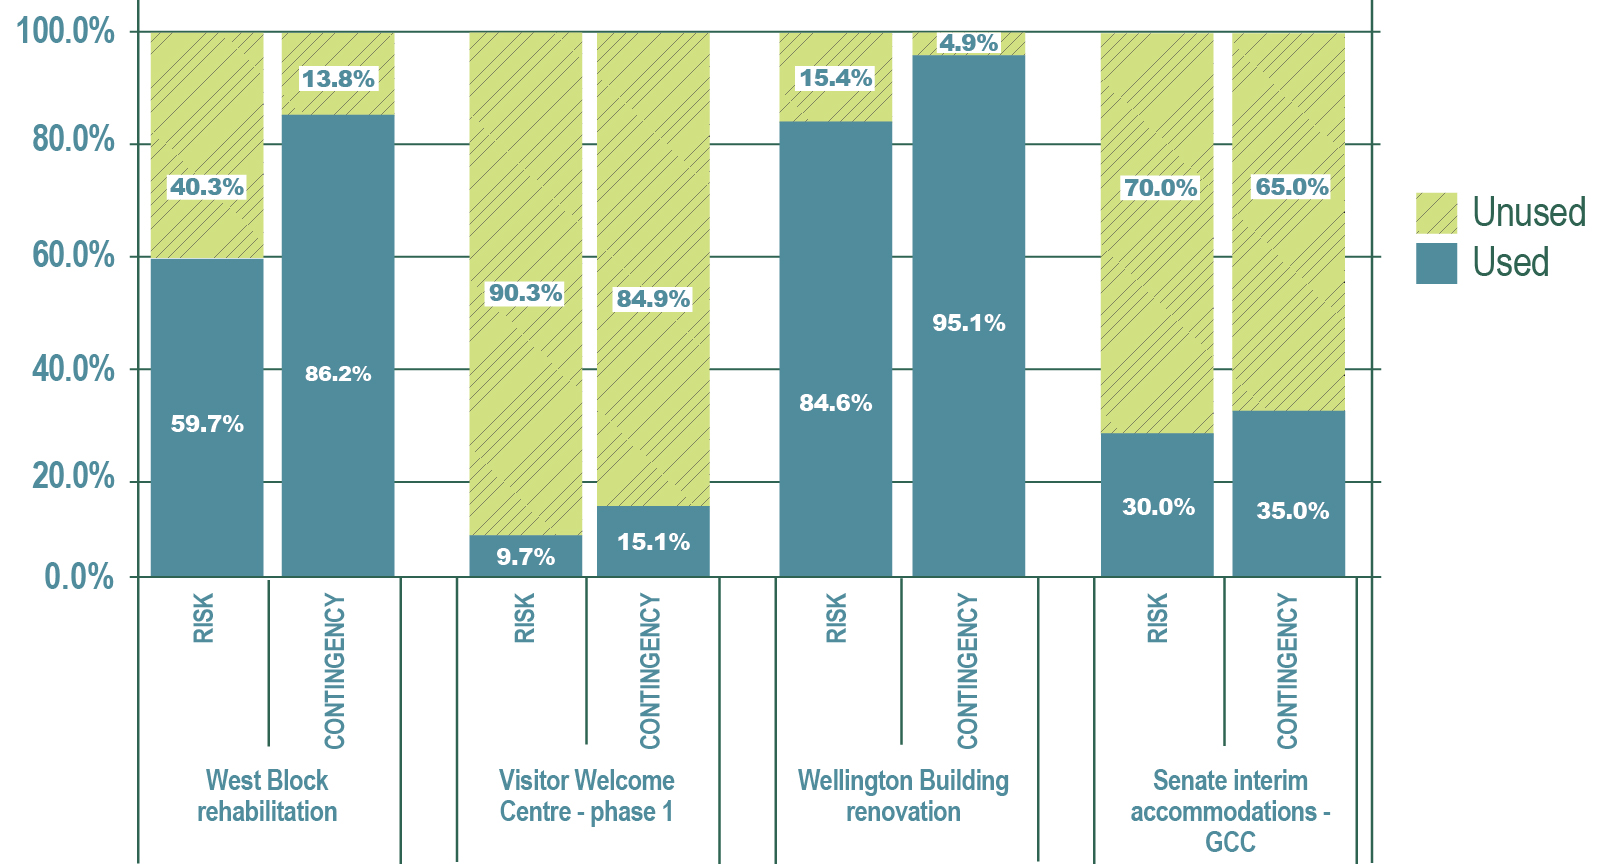
Table equivalent of figure 20—Major capital program risk and contingency data—Cumulative at fiscal year 2015 to 2016
| Risk/Contingency | Used | Unused | |
|---|---|---|---|
| West Block rehabilitation | Risk | 59.7% | 40.3% |
| Contingency | 86.2% | 13.8% | |
| Visitor Welcome Centre—phase 1 | Risk | 9.7% | 90.3% |
| Contingency | 15.1% | 84.9% | |
| Wellington Building rehabilitation | Risk | 84.6% | 15.4% |
| Contingency | 95.1% | 4.9% | |
| Senate interim accommodations—Government Conference Centre (GCC) | Risk | 30.0% | 70.0% |
| Contingency | 35.0% | 65.0% |
About risk and contingency
The renovation and rehabilitation of heritage buildings is complex and difficult to forecast. As an important component of effective costing, the Parliamentary Precinct Branch has developed and implemented a robust costing methodology including a systematic approach to allocating appropriate allowances for contingencies and risk. Based on lessons learned from other projects, internal and third party cost specialists and industry best practices, allowances are specific to every project to reflect its unique characteristics, building conditions and overall complexities and constraints. Over the past number of years, this methodology has been validated by independent third party experts as part of the PPB's sound project management practices.
Contingency allowances address cost estimating uncertainties and known issues that occur on every project (known—knowns). For example, this could include a change to a project's design to accommodate new scope. Contingency allowances are applied to key project cost elements, such as design and pricing and construction, and are adjusted to reflect the refinement of a project as part of ongoing project management activities.
Risk allowances address certain circumstances that may or may not occur during the implementation of a project (known—unknowns). For example, risk events could include unforeseen masonry deterioration and challenging site conditions. Risk allowances are applied as a single-line item to the aggregate project cost estimate. Initial risk allowances are reviewed and refined throughout the development of a project leading to the identification of individual risk events. Each risk event is then qualified as to its probability of occurrence and then quantified to determine its potential cost impact. Mitigation measures are also identified for each risk event. Managing risk is part of ongoing project management activities.
Program benefits
The impact of the LTVP has and continues to contribute to the local and national economy generating lasting economic, social and environmental benefits for all Canadians. Key benefits of the planning and implementation of the LTVP are highlighted below.
Job creation
It is expected that the five Major Capital Projects (Sir John A. Macdonald, Wellington, West Block, Visitor Welcome Centre—phase 1, Government Conference Centre) will generate over 10,000 direct jobs over the course of the work. These jobs will have been generated though contracts with small, medium and large companies.
Creating opportunities for youth
The LTVP offers unique opportunities for young Canadians to contribute to historic projects and gain invaluable experience. PPB's partnerships with universities have enabled students to get first hand exposure to innovative architectural and engineering practices and cutting edge technologies including 3D imaging, building information modeling and digital robotic assisted fabrication. Partnerships with Algonquin College have supported apprenticeship programs for trades such as electricians, plumbers, carpenters and others. PPB also makes extensive use of student programs to support the rehabilitation of the Parliament Buildings. Over the past five years, the Branch has directly hired approximately 200 students—some of whom have since been hired permanently.
Supporting aboriginals
Aboriginal set-asides have been used in some of the LTVP's contracts. For the rehabilitation of 180 Wellington, set-asides were included for the provision of environmental consulting services and custom millwork and furniture. Aboriginal set-aside criteria were also applied for the provision of project management support services for the Centre Block project.
Accessibility
PPB is committed to making the Parliamentary Precinct more accessible to all. Major projects are designed to meet the requirements established in the Treasury Board Accessibility Standard for Real Property and the National Building Code. Examples include barrier-free entrances, exits and amenities (such as washrooms) and elevators sized to accommodate power assisted wheelchairs.
Waste diversion
Limiting the amount of demolition material dumped in landfills is a key goal for major projects. In fiscal year 2015 to 2016, all Major Capital Projects over $1.0 million achieved waste diversion rates in excess of 90%, exceeding their targets of 80%.
Energy efficiency
Buildings within the Precinct will be considerably more energy efficient after rehabilitation. All heritage buildings are designed to 70% of Green Globes standard (LEED silver equivalent). Energy efficient measures incorporated into the buildings include high efficiency motors, heat recovery systems, green roofs, solar hot water panels and new energy efficient windows.
Hazardous waste abatement
All LTVP rehabilitation projects include the removal of hazardous waste materials from the buildings. Combined, over 7,000 metric tonnes of asbestos-containing material have been removed from the West Block, Sir John A. Macdonald Building, Wellington Building and Government Conference Centre.