
October - 2002
The eClassroom used as a Teacher's Training Laboratory to Measure the Impact of Group Facilitation on Attending, Participation, Interaction, and Involvement
Abstract
This paper describes and quantifies the role of group facilitation in an experiential, real-time, online, university level credit course entitled eAHSC/ 230 Interpersonal Communications and Relations. A new and unique group interaction pattern called parallel communication, as well as classical elements of group interaction are described and quantified. New measures of online group facilitation attributes with analogous face-to-face (F2F) counterparts are presented. Specifically, the impact of effective group facilitation on Attentiveness, on Interaction, on Involvement, and on Participation is explored. The paper also examines the eClassrom’s potential effectiveness as a real time teaching and training laboratory which also functions as a process observation tool that collects and feeds back interaction data, providing teachers and trainers immediate and ongoing measures of facilitation effectiveness.
Introduction
Communication not only enables humans to survive, it is the only way we can learn about whom we are. One’s sense of identity is derived from the way one interacts with other people. Deprived of communication with others, one would have no sense of identity. This is illustrated by cases like the “Wild Boy of Aveyron.” This feral child, who spent his early childhood without any apparent human contact, was discovered digging for food and captured in 1797 in the French countryside. As Shattuk (1980) put it: “The boy had no human sense of being in the world. He had no sense of himself as a person related to other persons (p.37).” It was only under the influence of a skilled connective facilitator that the boy began to behave and to think of himself as human. Communication not only defines human identity, it also provides a vital link with a community of others. Some theorists have gone as far as to argue that communication is the primary goal of human existence. Anthropologist Goldschmidt (1990) terms the drive for meeting social needs as the “human career.”
The extreme case of the Wild Boy of Aveyron serves well as a metaphor for interpersonal connections in face-to-face (F2F), as well as online interactions. In general, humans, regardless of circumstance, have a ‘lost child’ inside them. One deals with internal and external consequences when one fails to understand their impact on others, or when one encounters a blind spot that hampers their ability to appropriately decode feedback. No matter if one is male or female, young or old, rich or homeless, each person brings with them a ‘bag’ of interpersonal skills containing a unique constellation of needs and wants, strengths and limitations. In order to reduce unwanted consequences and maximize perceived successes in their relationships, humans need a skilled and connective facilitator in order to help them process knowledge about themselves and others and thus to learn interpersonal skills.
The Internet is presently the newest and, as of yet, the least understood communication channel available for people to connect and exchange information with others. Online, we are still experimenting with online human contact and interaction. In short, research on online facilitation is still in its infancy. How can one bring lost children into a community that does not yet know itself, and still act as competent connective facilitators of growth? This means that for those wishing to join in and learn in this new environment, online facilitators need to provide them with an accurate map of the online community. To achieve this objective, online facilitators must first observe, describe, and quantify characteristics of online communications and group development.
Conceptual Context
Communication or interaction is not a uniformly “good thing.” In fact, communication is neither good nor bad in itself. It is situation dependant and its value derives from the way or context in which it is used. Communication can be a tool for expressing useful facts and warm feelings, but under different conditions or contexts the exact same words and actions, may be perceived as harmful (Adler and Rodman, 2000). Another serious misconception about communication, is the notion that listening and actually “hearing,” is a natural, involuntary activity like breathing; wherein, in fact, “listening” is a is a learned skill, much like speaking, reading and writing. Once again, it is human contact and the inherent interactive exchange among and between humans that facilitates or retards the acquisition of these skills.
Theorists and researchers have identified a range of personal and social needs that are satisfied through interactive communication. Some of these needs such as inclusion, control, and affection are developmental in nature (Schutz, 1988). Other needs such as trust, acceptance, productivity, and interdependence are conceptualized as concurrent and omnipresent human factors (Gibb, 1964). In a qualitative sense, “interpersonal communication occurs when people treat one another as unique individuals, regardless of the context in which the interaction occurs or the number of people involved” (Adler and Rodman, 2000, p. 174).
In the quantitative sense, one may assess the communication process by using concrete group observational measures in the following four areas of group development:
1. Attentiveness (i.e., who is attentive and who is withdrawn)
2. Interaction (i.e., communication lines such as one to one, one to the group, one to the facilitator)
3. Involvement (i.e., Who are the influential members? Who are isolated? Who are absent? Who are late? ‘Idle’?)
4. Participation (i.e., Who are the over or under participators?) (Dimock, 1985).
The Internet, as a channel of communication, can provide immediate or delayed feedback containing personal or impersonal data. Computer Mediated Communication (CMC) is the process of one-to-one, one-to-many, and many-to-many communicative discourse, by using a computer-based communication channel, predominantly in a text-based environment.
Strangelove (1994) proposes:
The Internet is not about technology, it is not about information; it is about communication – people talking with each other, exchanging email, people doing the low ASCII dance. The Internet is mass participation in fully bi-directional, uncensored mass communication. Communication is the basis, the foundation... The Internet is a community of chronic communicators (p. 13).
In her article “Developing Personal and Emotional Relationships Via Computer-Mediated Communication,” Chenault (1998) further cites Smolowe (1995), who asserts that the vast majority of people surfing the Internet and communicating via CMC are there “in search of social interaction, not just sterile information” and that 80 percent are looking for “contact and commonality, companionship and community” (p. 20).
Chenault further adds: “CMC is a social phenomena. It is all about people communicating with other people, in any way they can (p. 80),” and “CMC has been debated and misunderstood as a negative phenomenon, because of the prominence given to what CMC does not offer, rather than what it does and suggests further exploration of the positive possibilities and outcomes of CMC interactions. The “virtual community” is not a mythic land of milk and honey, but neither is it any more dangerous, hostile, or unwelcoming than “real life” (p. 81).”
Parks and Floyd (1996) showed that personal relationships conducted via CMC are “common,” with just over 60 percent of people in their sample reporting that they have formed a “personal relationship” with someone they had initially contacted through a Usenet newsgroup.
Chenault (1998) concludes:
I do not see how the results of research and the personal accounts outlined in this literature review can be pushed aside – how anyone can say that a community is not possible via CMC, that personal relationships are not happening. They most certainly are (p. 77).
There is ample evidence that the information exchange afforded by CMC makes it possible for participants to become active distant education “learners.” Depending on the specific learning environment, at the very least, exchanging information online is as effective as book learning; most likely it is just as effective as face-to-face learning, albeit altered; and, at best, it may turn out to be the more efficient channel for delivering certain guided interactive learning opportunities. Of course, the type of guidance provided is a major determining variable of learning outcomes. Perception of the role of a skilled, connective facilitator in distance education is still varied and opposed. Teacher/ student interactions in the online learning process range from none, to emails, to message boards, to real-time synchronous discussion sessions.
The issues involved in effectively shaping group growth and learning through facilitation has been a continuing concern for both researchers and practitioners. There is little argument that learning in general, and learning interpersonal communication skills in particular, may be defined as the progressive modification of ideas and behaviors through interpersonal interaction and that the facilitator has a vital role in the acceptance, rejection or clarification of the knowledge being constructed.
French, Sherwood, and Bradford (1966) mention findings that indicate: “a person’s self-identity is influenced by the opinions that others have of him which they communicate to him and that the more that is communicated, the more change is in self-identity (p. 218).” This process of self-change predicated on self-awareness and feedback from others, while engaged in skill building interactions, is at the core of the learning-by-doing experiential pedagogy and the course content discussed in this paper. The role of group facilitators is seen as pivotal in assisting the team in the co-creation of an inclusive, open, and collaborative emotional climate in which participants feel free to engage in soliciting feedback and risking new behaviors.
Marks and Davis (1975) discuss the experiential model and its application to learning that serves well as a guideline for effective group facilitation. They include the following seven points:
1. Involvement and responsibility in an experiential model are centered on learner participation and active involvement
2. The experiential facilitator is responsible for assessing the group’s process, selecting the structured activity, attending to the group’s emotional climate and conducting the experiment
3. The focus of the experiential model is on process and content
4. Experiential learning fosters awareness of self and others and allows for both cognitive and affective behavioral involvement; the preferred leadership styles are collaborative and role sharing
5. Individuals establish their own levels of interaction and it is assumed they will “get out what they put into” the experience
6. The experiential model is predicated on choices and on taking responsibility for one’s actions
7. Facilitation occurs on the task level and on the level of social relationships
Interpersonal communication, effective or otherwise, is an acquired skill that necessitates a lifetime of practice. Teachers, for better or worse, abound under countless guises. This paper explores the role of group facilitation in an experiential, real-time, online, university level credit course entitled eAHSC/ 230 Interpersonal Communications and Relations. Specifically, the impact of effective group facilitation on Attentiveness, on Interaction, on Involvement, and on Participation is quantified, using the instantaneous data collected by the eClassroom in which the course was taught. Because the information collected is unique, new descriptions and measures of interactivity are offered in order to make sense of the experience and add knowledge to the village lore. The paper also examines the eClassrom’s potential effectiveness as an ongoing process observation tool, as an instantaneous feedback tool, as a concrete, immediate and ongoing measure of facilitation effectiveness, as well as a real-time teaching and training laboratory for facilitators.
Methods
Description of Test Environment
The Course
Lobel, Neubauer, and Swedburg (2002), describe the AHSC/ 230 course:
“Interpersonal Communications and Relationships’ is a multiple-section, introductory, pre-requisite, credit-course in the Applied Human Science Department of Concordia University. The course is designed to provide knowledge and skill in building and maintaining interpersonal relationships characterized by mutual understanding and respect. Students can expect to enhance their understanding of effective communication behavior and improve their abilities to attend to verbal and non-verbal communication from others, exchange constructive feedback, engage in effective problem-solving, address and deal constructively with conflict, and communicate across such differences as gender, class and race. Conceptual perspectives highlight the contextual influences in relationship dynamics and the role of affect in interpersonal communication. The course also examines ethical and value considerations . . . The target audience for the typical AHSC/ 230 course is undergraduate students, ranging in age between 20 and 70; the prototype student is a mature person, in the work force, seeking retraining in the ‘human services’ field” (p. 18).
The course is delivered by using the experiential, learning-by-doing pedagogy. Experiential learning is “defined as learning in which students are doing something – not just thinking about something (Lobel, et al., 2002, 26).”
The eCourse
The eClassroom design and the course materials presented were delivered online, in real-time, to 20 students in the fall semester of 2001. The course time was distributed into two four-hour weekend sessions, followed by nine consecutive three-hour weekly sessions, taught from 7:00 to 10:00 p.m. EST on Wednesday evenings, between September 8, and November 7, 2001.
The medium – a synchronous, online eClassroom available over the Internet and designed specifically for the experiential “learning-by-doing” pedagogy of the Department – uses a real-time, interactive HTML formatted text, image, and animation messaging system. The eClassroom, consisting of a main room and four breakout rooms for small eGroup experiential eActivities and eDiscussions, was password protected, monitored, and archived. Most students logged into the eClassroom from their homes. Text and image based lecture materials were posted to the eClassroom in real-time, and the “learning-by-doing” eGroup activities offered, in this medium, facilitated learning through practice and discussions.
One principal instructor and three eGroup co-facilitators staffed the eClassroom. The ratio of students to co-facilitators was seven to one. Students wrote weekly eJournals, an asynchronous component of the eCourse, which were emailed weekly to their eGroup co-facilitator and principal instructor for comments on the learning progress. All eClassroom activities and interactions took place online, in real-time. There were no face-to-face interactions whatsoever between the students and the instructors during the three months of this eCourse.
The mandate of this theory based and practitioner-oriented eCourse was to eTrain students in interpersonal communications competence skills. The content focused on two major components of interpersonal skills training. One objective was to increase students’ self-awareness as communicators. To this end, issues in trust, perception, values clarification, diversity, as well as individuals’ learning and conflict management styles were explored. The second goal was to identify interpersonal limitations through feedback, and to practice active listening skills and behavioral changes, both in the eClass and in F2F interactions.
The eClassroom and the program design afforded a new paradigm for a successful online synchronous, real-time distance learning experience, conducive to the practice of identified skills and lasting knowledge (Lobel, et al., 2002).
The eClassroom
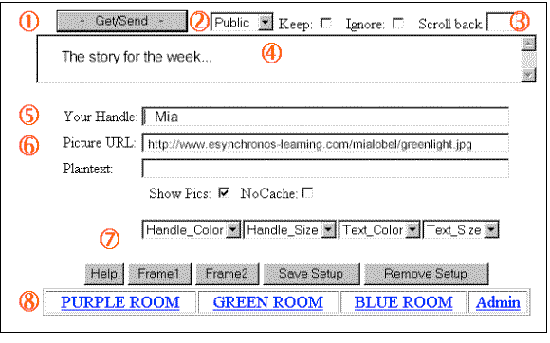
The software for the eClassroom creates HTML formatted real-time messages. The input form for these messages is shown in Figure 1. Instructors have the ability to speak privately with the students during eClass time using Private Messages (PM) (Figure 1, Item 2). Students may return the PM to the teaching staff, but cannot PM/ whisper to other students. All the data included in the post is logged and archived for future reference: ISP identification, eClassroom passwords, patterns of messages sent and received, the time of day, post number, all text, and all HTML formatting used to generate the post.
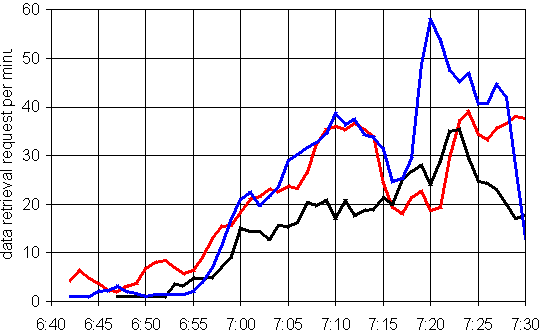
Students and teaching staff poll the server for data by clicking the “Get/ Send” button (Figure 1, Item 1). Each time an individual clicks the “Get/ Send” button when there is no text in the input box, the server receives the signal and refreshes that individual’s screen with the latest set of posts received since the last time the individual polled for data. The software also logs the polling for data, and it is not unusual for hundreds of requests to be processed per minute.
Figure 1. The Input Form: 1) Get/ Send Button. 2) A pull down menu for Private Messages to students and staff. 3) When retrieving posts, a number in this field; i.e., 25 will refresh the screen with 25 of the previous posts. 4) Input Data Field for the author's text and URL's to graphics. 5) The name of the student or staff member. 6) Input field for the URL to a graphic that is posted each time data is posted in the Input Data Field. 7) The font size and color for the name in item 5, and for the text in item 4. (8) Links to the Breakout Rooms.
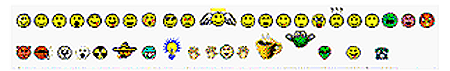
Emoticons can be added to the text to create expressive comments in the posts (Figure 2), and any GIF graphic with a URL can be placed in-line with the text by the author to create energetic, emotional, alive posting comments. The use of this type of graphical emoting has become a new lexicon within the experiential, online, distance learning environment, and the subject of the definition of social presence in the online classroom (Tu, 2000).
Figure 2. Examples of emoticons available in the eClassroom.
Graphical data are presented by the instructor using URLs to instructional materials uploaded to the classroom website. They can be either text or graphics, animated or not, and can be posted by the teacher in either the data input field or the picture URL field (Figure 1, Items 4 and 6). When posted from the picture, URL field the graphical data is re-posted each time new text is added to the input data field. This allows for re-emphasis of what is being taught, creating an ongoing instructional narrative for the students. Students also post graphics to create their social presence. Since all the posts are archived, a full reading of the three- hour class will include the lecture, the discussion, questions and answers, activities, and all comments by the principal instructor and co-facilitators. Archives, which are a unique feature of the eClassroom, are useful for students and teaching staff to review the interactions and reflect on their participation, and are of course, an invaluable adjunct for those who missed a session. A versatile feature of the eClassroom is a whiteboard used in the design of collaborative activities (Lobel, et al., 2002, p. 47).
As the data are examined and the patterns emerge, it becomes clear that the eClassroom is not just a classroom. It is a sophisticated learning and training laboratory, which collects interaction data, provides instantaneous feedback and measures the results of interventions in new and situation appropriate ways.
Data Collection and Analysis
Three generic types of data were collected in the eClassroom log files for later analysis: 1) Text; (2) time-stamped text; 3) time-stamped data requests. The four following analysis tools were used:
1. ATLAS.ti version 4.2 a computer aided text interpretation and theory building software.
2. Microsoft Excel 2000 for regression analysis, database organization, and graph making.
3. UCINET 5.0 Version 1.00 for network analysis.
4. Pajek, a freeware software program for large network analysis.
Results
The eClassroom becomes an observation and assessment tool that collects data and quantifies communication lines on learning measures such as: Attending, Participating, Interaction, and Involvement. For a practitioner or for training purposes, the impact of quantified, immediate and ongoing feedback on group facilitation, on group diagnosis and on the assessment of effective interventions, cannot be overemphasized.
Attending and Participating
Attending is defined both as being there and as paying attention or being attentive. In the F2F classroom it is easy to quantify physical attendance by simple roll calls, but there are no concrete measures available to assess attending as in paying attention. eClassroom software records both the “attending behaviors” as defined above, for each participant. In terms of being there, the eClassroom keeps a log of arrival and departure times, as well as the time participants are “idle” at the keyboard. This feature allows instructors to monitor participants and determine when students are not polling for data and take appropriate action to engage them in the ongoing process. Attentiveness is quantified as the frequency with which participants actively poll the server for the data generated since their last request.
Participation is defined as the state of being related to a larger whole. Participation is quantified as the number of messages containing a communication sent by participants.
Figure 3 is a scatter plot of Attentiveness and Participation. The data are totals for each participant for the entire semester. On an average, there were 3837 data polls per three-hour session with peaks of 80 data polls per minute; while the average number of data polls during the semester is 21 polls per minute. (The principal instructor’s data point is 892 messages and instructions, and 1401 data polls.) A regression analysis calculated a .23 correlation (P <.05). The low correlation is an important finding. It supports the F2F classroom experience, where students who do not speak out in class, may be just as attentive as students who do, while “speaking out” does not necessarily imply paying attention. The data suggest there may be extenuating variables involved, and with this quantifiable measure available in the eClassroom laboratory, it is possible to design further experiments to find the determining factors. For example, it may be that the level of attending as measured in the eClassroom Laboratory is explicated by students and instructors’ Personal Learning Styles (Kolb, 1984).
Figure 3. Attending and participating.
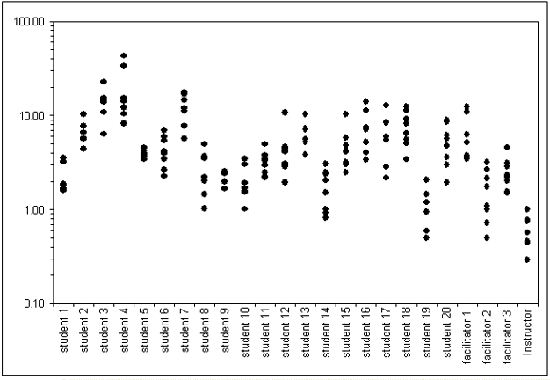
The relationship between attending and participating can be expressed as a ratio. In Figure 4, this ratio is plotted for each student, facilitator, and the principal instructor. It is striking how consistent the range is around a median for each participant, indicating a preference or consistency of style. For the principal instructor, the ratio tends to be less than unity, since her task is to present and explicate the content to the class. From the data, there appears to be three distinguishable types of students:
1. Students with a tendency to attend more than participate (3,4,7)
2. Students who are very consistent in this attribute (5,9, 11)
3. Students with a tendency to participate more than attend (8,10,14,19)
The measurement of this attribute suggests the eClassroom has sufficient flexibility in its design to allow this behavior to be expressed.
Figure 4. Ratio of Attending to Participating for each participant for each class session. Each data point represents one 3-hour class.
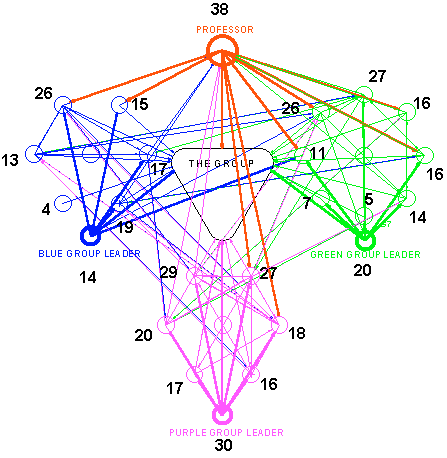
Another way to conceptualize Participation or the individual’s relationship to the whole is in terms of patterns of communication lines (Dimock, 1985). Is who speaks to whom worth noting in terms of frequency and diversity? Do members usually talk to one or two people? Such as to the designated leader? To a best friend? To everyone? The interaction diagram (Figure 5) generated by the eClassroom yields a reasonably accurate picture of this type of participation. Each arrow points to the person to whom the remark is directed, or, if it is addressed to the group, the arrow stops in the middle. The total number of directed remarks between the sender and receiver is tabulated and recorded on the diagram.
Over the semester, the median number of posts in the main room is 750 per three-hour class, with an average of 30 posts per student. At peak periods, the posting rate is 20 posts per minute. As mentioned earlier, the extremely high levels of interaction are the result of the “parallel communication” patterns afforded by the eClassroom design. It should be noted that the instructor does not need to interact with the students much more than one post per minute to facilitate the discussion that exhibits high rates of individual participation (Lobel, et al. 2002).
As the one hour Interaction Diagram from the October 10th Learning Module Activity illustrates (Figure 5), the eClassroom design enabled the twenty students present to generate 445 real-time, parallel interactions with an average of 22 words per message. Every student present added some information to the discussion. Such data flow would not be useful at all during serial F2F interactions, let alone while the instructor is introducing new material. There was no indication that students found it difficult to receive, assess, and respond to the information generated by the observed parallel communication interactions (Lobel, et al. 2002).
Figure 5. One hour Interaction Diagram of October 10, 2001 eClass, colour coded to the small breakout group identities. The bold numbers are the total messages sent by the participant during this time period.
Contrast the interaction illustrated in Figure 5 with the Interaction Diagram in Figure 6, derived from a one-hour videotaped segment of a F2F AHSC/ 230 session Activity section, taught by the same principal instructor in Summer 1999. There were 52 students present in the F2F classroom, but only twelve participated in the class discussion. There were 48 messages exchanged between the F2F class participants during the one hour covered by this measure. One wonders what was going on for the other 40 students as they sat in class? Could they have been lost? Was there space for them to contribute? Is it the nature of serial interaction that dictates a prescribed interactive process in the classroom? For example, the instructor asks a question and a “line of hands” go up and person #1 is given the floor. Subsequently, that interaction may spark other comments, but person #2 is waiting in the “line of hands” to offer an opinion. By the time person #4 gets a chance to speak, most likely the original comment is no longer relevant, and so on. In the eClassroom, however, the “line of hands” is in the hands of the participant. The instructor does not need to choose one individual respondent, and the participants need not wait their turn to add knowledge to the class narrative. The “line of hands” is replaced by a complex, parallel, and multi-directional communication pattern.
Figure 6. Interaction Diagram derived from a video of a F2F September, 1999 AHSC230 class.
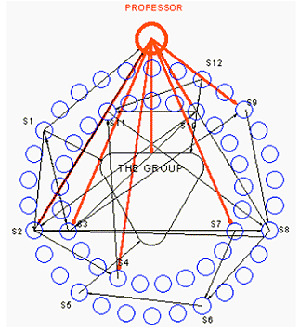
It appears the nature of parallel communication, as witnessed in the eClassroom, allows for everyone to participate and direct comments to any number of people in the same message, or in many messages. In fact, everyone can communicate with everyone at the same time, and at any time.
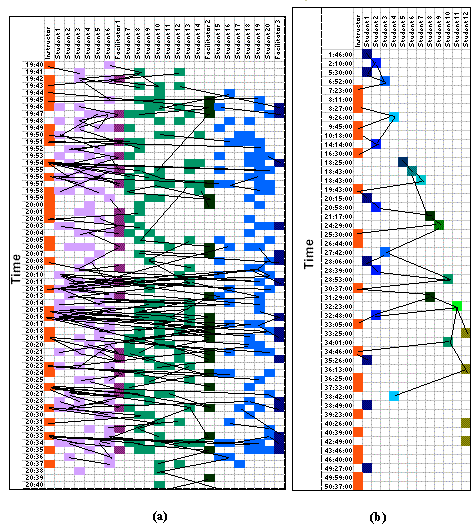
These observations made it clear that online interactions, in general, and the eClassroom interactions in particular, engender a new type of communication where time to communicate is no longer linear and serial, but holistic and parallel. The Interaction Diagram is an observational tool designed to describe F2F interaction, but it does not adequately describe the unique communication dynamics in the eClassroom. To this end the Interaction Diagrams presented in Figure 5 and Figure 6 are unwrapped along the time axis (Figure 7) that more accurately reflect the rich tapestry of communication lines woven by the participants in the eClassroom. The contrast between the numbers of communication lines generated in the eClassroom and those generated in the F2F session is visually striking. Is it possible that in a F2F classroom, where interaction is predicated on a “line of hands,” the participants are more apt to get lost?
The patterns of communication evidenced in Figure 7a, also point to the differences in the small group interaction patterns, to be discussed later in this paper.
Figure 7. Interaction diagram unwrapped along the time axis. Each colored square is a speaker. The red squares represent the instructor. The students in the purple, green, and blue groups are represented by their color. Each column represents a participant. The dark purple, dark green and dark blue columns represent the facilitators. The lines represent directed communications to the prior comments of participants. 1) One-hour discussion during Activity I of the October 10 session, showing parallel communication in the main eClassroom. Each row represents one minute of class time. 2) One hour Activity and discussion transcribed from a video of an AHSC/ 230 F2F class taught by the same instructor, illustrating serial communication. Each row is a time-stamped speaker during the F2F activity and discussion.
Group Interaction
Large Group
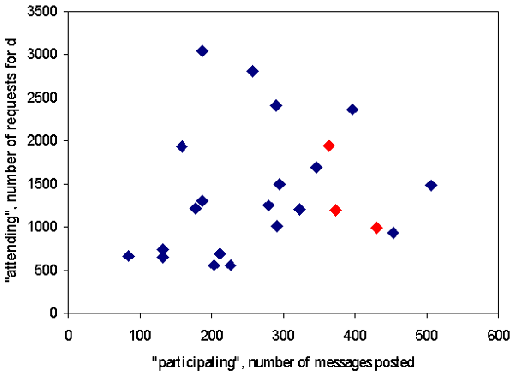
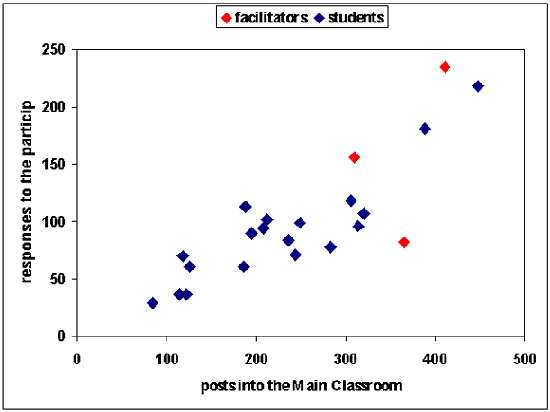
Interaction is defined as a mutual and reciprocal action or influence. An often-repeated maxim of facilitation included into the Course Outline states: “You are responsible for your own learning. You will get out what you put into the course.” This maxim is strikingly illustrated and dramatically confirmed by the data collected and displayed in the scatter plot of Figure 8. All the messages posted by each individual into the main classroom, over the entire semester, are plotted against all the directed messages received by the same individual. A directed message is defined as one that specifically names the intended receiver of the communication. A regression analysis calculated a .84 correlation between the variables (P <.05). The response rate, defined as the slope of the straight line curve fit, is 40 percent. Students who posted 100 messages received back an average of 40 responses; students who posted 200 messages received back an average of 80 responses. This appears to be a significant finding. It not only represents a facilitated democratic process at work, but it also suggests a benchmark for further study. What is the response rate in a F2F classroom? How could it be measured? Certainly, this kind of data is relevant for further instructional design modifications that would impact on the training process. What are the limits on interaction for this type of online eClassroom? How would twice as many participants affect this curve?
The Figure 8 scatter plot also indicates that during the large group eClass interactions the co-facilitators are responded to no differently than the group members. This may be a measure of collaborative co-facilitation, and the preferred distributed leadership style of the teaching team (Dimock, 1985). The data also point to the principal instructor’s overall prominence in the teaching process. The data for the instructor (not shown on the graph) indicate that 892 messages were posted with 624 directed responses for a 70 percent interactive response rate, representing the highest rate of feedback received by anyone.
Figure 8. Number of messages posted into the main classroom by individuals, and responses to the individuals. The data represents the entire semester.
Small Groups
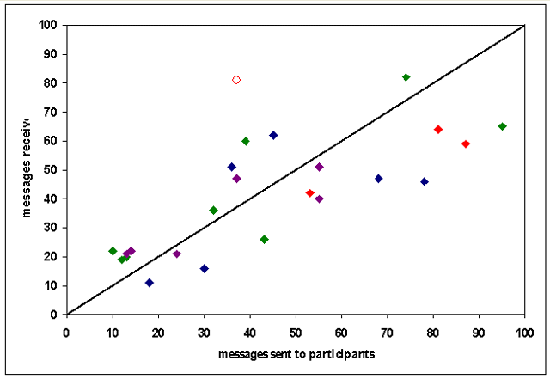
The small breakout groups are designed to give students an opportunity to interact with a small group, the facilitator, and each other. As expressed as the ratio of attending to participating, it was observed that each small group facilitator has a different interaction and leadership style. In Figure 9, the scatter plot illustrates the rate of interaction between individuals in the small groups during the semester. The 1:1 line represents a participant having the same number of directed messages sent as received. While above the line means the student received more directed messages addressed to them, than they themselves addressed to others. As may be noted in the blue group, thirty percent of the students are above the line; in the green group 75 percent of the students are above the line; and in the purple Group fifty percent the students are above the line.
A regression analysis calculated a .46 correlation between the variables (P <.05) and a mean response rate of 87 percent. As expected, the response rate in the small group is almost twice that of the larger group. This confirms the raison d’etre of small breakout rooms. It is apparent from the breakout groups’ data that there is enough “room” within the small groups for students to receive more directed comments than they initiate. This is the space above the diagonal line in Figure 9. Here, 11 of the 20 students are above the line. More than 50 percent of the students received a greater number of directed comments than they sent out. Clearly, such interaction was not achieved in the Main eClassroom, which further validates the pedagogical decision to create small breakout groups. There is a strong experiential indication that the eClassroom Laboratory functions the same as a F2F classroom on this measure. Once again, it appears that the maxim “what you get out is what you put in,” as a function of interactive response rates, remains consistent regardless of environment, group size and facilitation styles.
Unlike in the main eClassroom, nearly 75 percent of each small group facilitator’s communications were directly addressed. This is a near identical percentage noted for the principal instructor in the Main eClassroom. It appears that in the breakout rooms, facilitators assumed the position the principal instructor held in the Main Room on this particular measure. In the breakout groups, the principal instructor’s task is somewhat different than in the Main eClassroom. Since the teaching material has already been delivered in the Main eClassroom, the principal instructor’s role is to support the facilitators by clarifying instructions, delivering process questions, and fulfilling any missing leadership functions. The small groups’ data indicate that the principal instructor receives 220 percent more direct student responses than is directed to the students. Response rates remained consistent over time, groups, and facilitation styles. The question remains: How could the unusually consistent and direct correlation observed be used to evaluate facilitation and facilitation training effectiveness?
Figure 9. Rate of interaction between individuals in the small groups.
Stages of Interaction
An overview of the interaction data for the duration of the course reveals a distinct pattern. This pattern seems to remain constant throughout all the nine Learning Management Modules. There are four distinct stages of interaction during each session and they are named: the Greeting stage, the Gathering stage, the Activity stage, and the Conclusion stage. In addition, each Activity stage appears to have four distinct phases of interaction: 1) adding knowledge to the group; 2) facilitation; 3) building on the knowledge of others; and 4) reporting back to the group. It is postulated that each one of these stages of group interactions in the eClassroom has complimentary components to F2F classrooms, but unlike F2F classrooms, interactions in the eClassroom are measurable and quantifiable from the data collected automatically and archived by the synchronous online eClassroom.
The Greeting Stage
The first stage of group interaction in the eClassroom is the Greeting stage, during which time all participants login and present themselves to the class with greetings to their small group members, to the facilitators, to the larger group, and to individuals within the group. This stage is characterized by socially oriented gobletting behaviors (Schutz, 1988) and the task is simply to make one’s presence known to others. The number of interactions measured during this ten-minute stage, throughout all the Learning Management Modules, was typically one hundred and fifty messages per session. As shown in Figure 10, there was surprising consistency in this quantifiable measure.
Figure 10. Cumulative number of messages during the greeting stage for each class session.
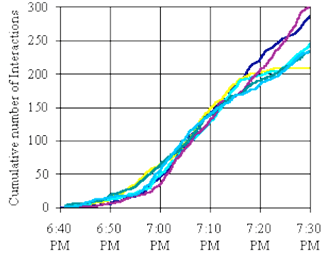
In a F2F group environment, the Greeting stage may be accomplished by a long chat or a simple nod, and is terminated when the “show” begins. Twenty-five participants, sending one hundred and fifty greeting messages in ten minutes, in a F2F situation, would constitute a zesty, noisy crowd. Qualitatively, greeting behaviors in a real-time synchronous environment resemble the F2F situations, albeit adapted to suit the limited bandwidth of social cues. From personal observation, it appears that in terms of group development, unstructured random groups with general goals, like a F2F party or an online chat-room, will rarely move past the Greeting stage of inclusion. There is no need to do so because members’ “stakes” in the group are individually oriented. However, once structure is provided and goals specified so that individuals perceive the group as valuable, (in other words the group process and content is facilitated), the Greeting stage becomes a small part of the inclusion process.
The Gathering Stage
No matter what environment people meet and greet in, every person comes to the experience from his or her own perspective and present morale (Kass, 2002), having interrupted their lives in some way to be there. The facilitator, as a process observer, at this stage will recognize the need for the stage to be set based on trust and to make it as level as possible. One method to accomplish this is to begin the session with a Transferring In activity. In the F2F environment this may take the form of a relaxation exercise, a guided meditation or a short activity relating to the topic to be covered. From years of feedback, it is clear the effect of this intervention is to bring or gather everyone into the classroom, so that everyone will begin the session from the same “frame.”
After approximately ten minutes of greeting interactions, the instructor assesses the appropriate time to formally begin instructions. This judgment is based upon the general level and energy of interactions, and is usually after tending to housekeeping issues such as handing in journals or pictures for identification, and addressing technical issues such as how to use the archives. In F2F classes, the instructor usually begins the session with a short Transfer In event to facilitate students in the transition from “then-and-there/ separate” to “here-and-now/ together.” In the online classroom, after the third session, the instructor posted some topic-relevant story, quote, or poem for the students to read and discuss.
This Gathering stage is characterized by socio-emotional interactions designed to resolve issues of membership and prominence, in terms of testing who is listening to whom and searching for personal similarities and differences (Schutz, 1985). Unlike in F2F classroom settings, in the eClassroom, this process of gathering the students into a common starting place is actually measurable by the quantity and frequency of participants’ interactions.
The number of times participants polled the server for new data, may provide a valid measure of attentiveness and by extension a measure illustrating individuals’ anticipatory interest to find out what information is being generated by the other group members. The data used to identify and describe the gathering process are collected to measure participants’ attentiveness, and are quantified as the total number of times the server was polled for data by each participant.
As shown in Figure 11a, this anticipatory interest has two distinct peaks of interaction during the first fifteen minutes of the first three classes. In these first three sessions, these anticipatory interest peaks are well defined, the first occurring five minutes from the start of class and the second occurring fifteen minutes into the class. The content of these gathering discussions centered on commonalities such as names, pictures and technical concerns and served as the Transfer In activity for the first three Learning Management Modules.
Figure 11a. Sept 12-26 (After 7:15 the curves reflect the beginning of that week's activity. The activity for the week with the blue line was to go to their respective breakout groups and to discuss content there.)
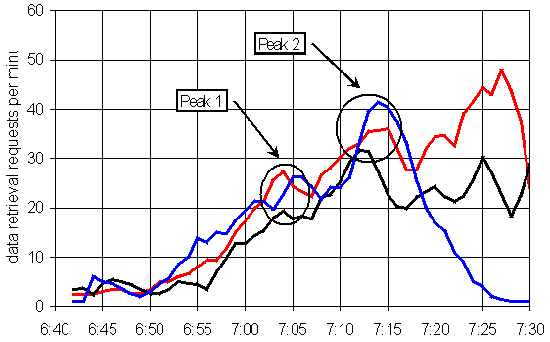
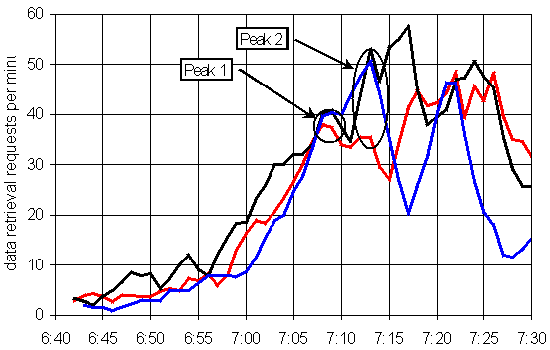
The relatively low points between these peaks were experienced by the principal instructor as a “lull” in the process, and a potential waste of valuable instruction time. Starting each class with a Transfer In story that would then lead into the class content is an intervention directed at eliminating the relatively low points of interaction that occurred during the Greeting stage of the first three sessions. As shown in Figure 11b, the two peaks of interest begin to merge in the three middle Learning Management Modules. Figure 11b shows that the time period between the peaks has changed from ten minutes to five minutes, and the peaks themselves are beginning to disappear. This would indicate that students’ anticipatory interest was greater during this fifteen minute time period, compared to the first three sessions, and that the intervention facilitated the important task of creating and maintaining momentum in the gathering process.
Figure 11b. October 3 to 17.
Finally, in the last three Learning Management Modules, as shown in Figure 11c, the merging of interest and momentum in the Gathering stage appears well managed. The periods of reduced attention or waiting are eliminated, as everyone seems primed to know what is to follow. The established gathering process is such: participants arrive and greet one another, housekeeping is addressed, a story is introduced and the ensuing comments form a common base from which to enter into the group and engage in the process, increasing members’ preparedness to participate in the learning activity.
Figure 11c. October 24 to -November 7
It is important to mention classical conditioning as a major variable involved in the act of polling for data, and its subsequent use as a measure of attentiveness and anticipatory interest. The fact is this button may be akin to a lever one presses to get yet another ‘conversational pellet.’ In addition, certain personality traits and learning styles may also influence the rate with which any given individual seeks more information in this fashion.
The Activity Stage
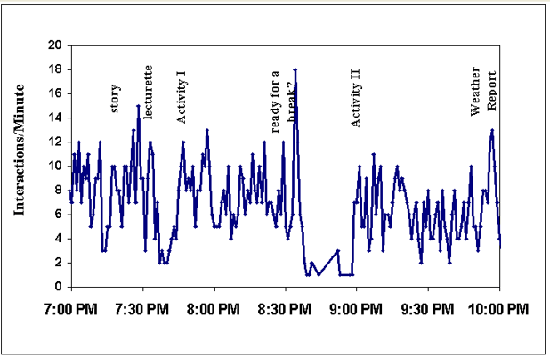
Each Learning Management Module contains at least two associated activities. The learning-by-doing instructional design of these activities follows closely that of the F2F classes, but in the online eClassroom the measures of outcome are quantifiable. The time-line in Figure 12 illustrates a typical class where interactions can peak at 16 to 20 messages per minute and remain consistently at six to ten posts per minute throughout the session.
Figure 12. Level of Interactions during the Oct 10 Learning Management Module.
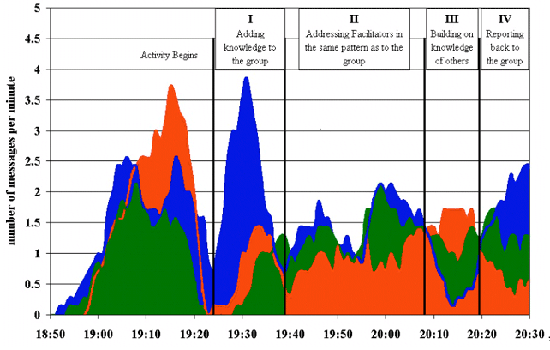
The Activity stage is characterized by task related behaviors. If the Gathering stage was about “being seen” then the Activity stage is about “being heard.” The common goal in this stage is to grapple with the instructional material and make decisions about its relevance to the self. As mentioned earlier, each Activity stage includes four distinct phases of interaction: 1) adding knowledge to the group; 2) facilitation; 3) building on the knowledge of others; and 4) reporting back to the group. The Rate of Interaction characteristics during the Activity stage are shown in Table 1. A discussion of the emerging interaction patterns is included below. The flow of interactions as it varies over time is shown in Figure 13. It is clear that throughout all the Learning Management Modules, interaction occurred student-to-student, student to facilitator, and student to group. What appears to have changed over time is the frequency with which the participants were addressed in their respective roles. The fluctuations in the directions of the messages were sent seems to be phase dependent.
Table 1. Rate of interaction from student to: Student, Facilitator, and Group during the various phases of the Learning Module Activity.
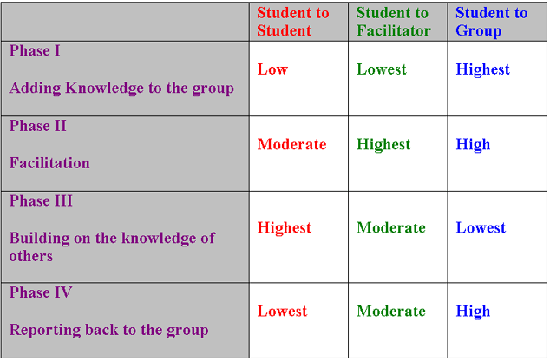
Figure 13. The four interactive phases of the activity stage: Student-to-Student. Student-to-Group. Student-to-Facilitator.
Adding Knowledge to the Group
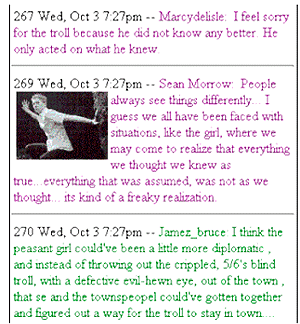
During the adding knowledge to the group phase student-to-student and students-to-facilitators interactions are low while the instructional material is being delivered, and students are interacting by directing most of their reactions about the activity to the group in general. Examples of these postings are shown in Figure 14.
Figure 14. Examples of "adding knowledge" to the group in the eClassroom.
Facilitation
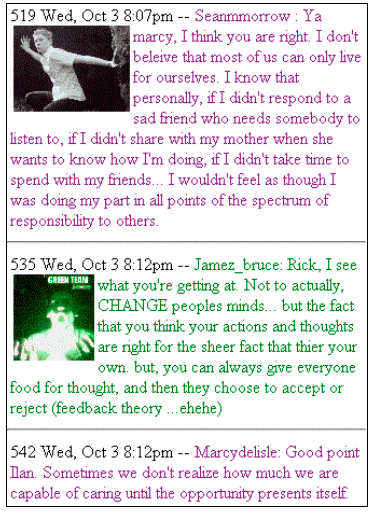
During the facilitation phase student-to-facilitator interactions are at their highest, as participants define their understanding of the topic and accept the goals of the activity, while student-to-group interactions continue to remain higher than student-to-student ones. Examples of these postings are shown in Figure 15.
Figure 15. Examples of facilitating

Building on the Knowledge of Others
Building on the knowledge of others is clearly illustrated by the highest concentration of student-to-students interactions at the expense of student-to-group interactions, with the student-to-facilitator interactions reduced to a relatively moderate frequency. Examples of these postings are shown in Figure 16.
Figure 16. Examples of building on the knowledge of others
Reporting Back to the Group
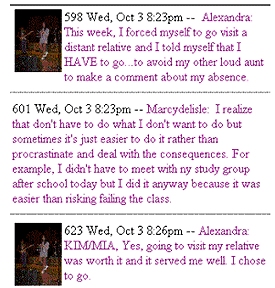
Finally, during the reporting back to the group phase student-to-student interactions are minimal, while student-to-group interactions, moderately facilitated, become relatively high, indicating that students actually have something to report back to the large group. Examples of these postings are shown in Figure 17.
Figure 17. Examples of reporting back to the group
The Conclusion Stage
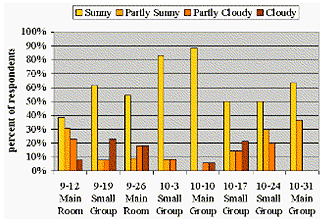
At the end of each session, after processing the experience either in the main eClassroom or in the small breakout rooms, students were asked to fill in a questionnaire called “The Weather Report.” The weather became the metaphor used to express and assess students’ satisfaction level with themselves and the sessions. As seen in Figure 18, in general, the satisfaction level is “sunny” and topic dependant.
Figure 18. Weather reports from the students.
Involvement
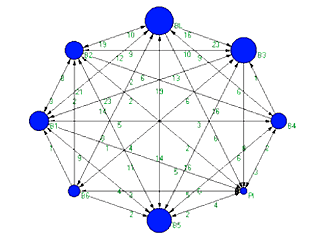
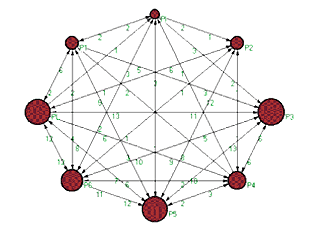
Involvement means to engage as an influential participant, and to commit emotionally to the group. Commitment to the whole increases the value and the influence of the group for the individual. Group members can report on their personal stake in the group and on the importance they each place on the task and on the social relationships. In terms of involvement or willingness to participate, one would need to differentiate between “high” and “low participators.” It stands to reason that an “over participator,” in general, and in the eClassroom in particular, would send and receive more messages than an “under participator.” It also makes sense that “high participators,” for better or worse, will become the important hubs, or centers of activity within the group, by drawing interactions to themselves, as illustrated by the direct correlation between sending and receiving directed messages. High participation is a useful tool for information delivery, but does not serve well for processing an experience in a group discussion. In any effective interaction, legitimate, responsible and facilitative authority is necessary to include the lost children. As a result of the willingness and the ability of the teaching team to intervene, if there is inappropriate participation, it is assumed that in the synchronous eClassroom this good authority is well distributed between the students and the teaching team. According to Pajek software (Batagelj and Mrvar, 1996), a hub is good if it points to many good authorities, and it is a good authority, if many good hubs point to it. The following analysis was made with the assumption that all members of the breakout groups were by definition good authorities. This definition will then emphasize the facilitator, whose task it is to direct inquiry and comments to individuals in the group, as needed. The greater the number of directed comments, the larger the circle representing the individual’s attribute as a hub within the group. The directed network hubs in Figures 19, 20 and 21 reflect all of the small group interactions over the entire semester.
Hubs in the Directed Network of Small Groups
Blue Group
In the blue group, the facilitator, BL, is the most important hub. It appears the strong leadership in the blue group may result in the principal instructor’s (PI) position as the smallest hub, meaning that the PI sent the least amount of directed messages in this group. The number of directed messages for the members of this group from highest to lowest is BL-97, B3-78, B5-68, B1-45, B2-36, B4-30, B6-18, and PI-10. It is only after generating this figure that it became apparent that there is a missing link between students B4 and B6, who have not directly addressed each other once, throughout the semester. This information is the impetus used to modify the eClassroom data collection algorhythm so that in the future such data is made available to instructors and facilitators on an ongoing basis.
Figure 19. Directed network of hubs in the blue group.
As was seen in the Unwrapped Interaction Diagram in Figure 7a, in the main eClassroom, the blue group members direct more communication lines to the rest of the class than to each other. This measure may also speak to the group’s cohesion level. Cohesion is defined as the degree of solidarity or “we’ness” in a group (Dimock, 1985). According to this definition, group cohesion in the group appears low.
Green Group
In the green group, the most important hub, the one directing most of the comments was student G2. The green group facilitator GL, and student G4 were almost equal in terms of directed comments to members of the group, while some group members directed very few comments in general. In this group, the PI seems to have exerted more influence with directed messages to the students in the group. Without exerting too much influence and without drowning out the comments of the other group members in this group, the PI provides the authority balance and is more influential as a hub than student G1 and G3. The number of directed messages for the members of this group from highest to lowest is G2-95, GL-87, G4-74, G5-43, G6-39, G7-32, PI-19, G8-13, G3-12, and G1-10. The missing links in this small group were between G3-G6, G1-G3, and G7-G8. It remains to be seen how the hubs in a directed network, in which the facilitator receives immediate feedback about the existence of these missing links, would be different.
Figure 20. Directed network of hubs in the green group
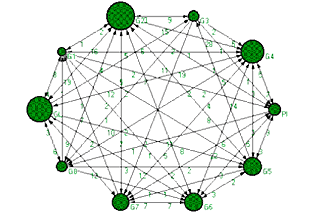
The Unwrapped Interaction Diagram in Figure 7a points to the green group members’ preference to associate in a balanced fashion with each other and with the large group as well. This group may represent a group that exhibits a sense of connection with both the large and the small groups.
Purple Group
In the purple group, the facilitator PL, Student P3 and Student P5 had almost equal importance as hubs, directing comments to other members of the group. In this group, the PI did not exert any influence and remained in the background as the least important hub, directing the fewest comments to members of the group. The number of directed messages for the members of this group from highest to lowest is P3-55, P5-55, PL-53, P6-37, P4-24, P1-14, P2-13, and PI-8. In this small group, the missing links were between P2-P3 and P1-P2.
Figure 21. Directed network of hubs in the purple group
The vigorous and dense small group intra-communication shown in the Unwrapped Interaction Diagram, Figure 7a, at the expense of inter-group communication, exemplifies another pattern of involvement students exhibited during the semester. This group may represent a group with a high degree of “village” solidarity.
In conclusion, the principal instructor’s role was least pronounced in the blue and purple groups, and most pronounced in the green group. This can be seen by the size of the hub relative to the size of other hubs in the directed network of the group. It appears that the small group facilitators’ participation styles may be reflected in their groups’ interactions with each other and with the class as a whole. These measures also illustrate the eClassroom’s efficacy as a feedback tool for the facilitators, pointing towards the interventions needed to manage leadership roles and hubs of influence effectively. It is surprising that there were students who did not interact with one another, even in the small group setting. While all students interacted with other students, and in that sense they were not lost, there still remained a few individuals who remained lost to each other.
Conclusion
The data presented throughout this paper visually demonstrate the social network woven by the participants’ interactions during the eClass sessions. The interactions presented clearly illustrate that given the chance, people will reach out to each other to establish connections and to develop relationships any way they can. The lost children, who in this pilot study would include the instructor, the facilitators, and the students, found ways to show up and pay attention, to participate and get involved, and to construct lasting interpersonal knowledge, all within the context of the eCourse and the eClassroom. The measures provided by the eClassroom offer the instructor and facilitators real-time, instantaneous data in order to observe the areas of potential group development and intervene in effective ways to increase appropriate group interaction, to build trust and cohesion and to experience learning in productive and creative ways.
Since this online learning environment is a new one, new terms and definitions have to be applied. For the eClassroom, attendance is defined as both “being there” and as “paying attention.” “Paying attention” is quantified as the number of times a participant polled the server for new data generated since their last polling. In the eClassroom, participation is defined as the state of being related to the whole and it is seen as the number of messages posted by each participant. There is no apparent correlation between the measures of “attending” and “participating,” which confirms that “vocal participation” may not necessarily mean “paying attention,” while “non vocal participation” does not necessarily imply inattention. The relationship between attending and participating is expressed as a ratio that remains surprisingly consistent for each of the participants over time. In the eClassroom, three distinguishable types of ratios are observed: 1) participants with the distinct tendency to attend more than participate; 2) participants who attend and participate equally; 3) participants with a tendency to participate more than attend.
Interaction is defined as mutual or reciprocal action or influence. The eClassroom collects data instantaneously. The data can be used to illustrate the interactions in a way that affords feedback to the instructor and facilitators. Lines of communications indicate high levels of democratic interaction as participants build a solid interpersonal network. Parallel participation patterns are found to be a unique feature of online synchronous real-time communication. A new Unwrapped Interaction Diagram, which quantifies and illustrates the unique online parallel communication patterns observed in the eClassroom, is offered.
In the time series data there are four distinct Interaction stages noted during each Learning Management Module: 1) greeting stage; 2) gathering stage; 3) activity stage; and (4) conclusion stage. Within each Activity stage four distinct phases of interactions are described. These are: 1) adding knowledge to the group; 2) facilitation; 3) building on the knowledge of others; and 4) reporting back to the group. The data describing the four phases illustrate high levels of participation and phase appropriate interactions. Quantitative and qualitative measures of interactions are presented to illustrate the nature of interaction and learning that took place.
The power of the eClassroom as an observational, diagnostic and feedback tool is clearly demonstrated. The eClassroom not only fosters learning of content, but it also provides the laboratory in which a “problem” can be observed, it offers the tools to diagnose the problem, it points to the map to formulate a prescription, and it supplies the feedback needed to assess the results of an intervention.
A matched study, comparing a F2F class with an eClass on the measures presented in this paper, while keeping content, time frames, facilitators and pedagogy a constant, will be conducted in the Fall 2002. Perhaps much like the “Wild Boy of Aveyron,” as people connect online and learn how to learn in this environment, each answer will elicit a flood of new questions, as we grapple with the medium and the process it entails. This process of inquiry will itself hone the skills of the participants to become effective group members, teachers, and facilitators.
References
Adler, R., and Rodman, G. (2000). Understanding human communication. Orlando, FL.: Harcourt College.
ATLAS.ti (2002). The Knowledge Workbench Visual Qualitative Data Analysis: Management and Theory Building c 1997-2002. Scientific Software Development, Berlin.
Batagelj, V., and Mrvar, A. (1996). Pajek, a freeware software program for large network analysis. University of Ljubljana, Slovenia. Retrieved February 25, 2002 from: http://vlado.fmf.uni-lj.si/pub/networks/pajek/
Borgatti, S. P., M. G. Everett, and Freeman, L.C. (1999). UCINET 5.0 Version 1.00. Natick: Analytic Technologies.
Chenault, B. G. (1998). Developing personal and emotional relationships via computer-mediated communication. Computer-Mediated Communication Magazine, 5(5) Retrieved April 5, 2002 from: http://www.december.com/cmc/mag/1998/may/chenault.html
Dimock, H. (1985). How to observe your group. Center for Human Resource Development Monograph Series for People working with People. Second Edition, 1 – 46.
French, D., Sherwood, W., and Bradford, D. (1996). Changes in the self-identity in a management training conference. Journal of Applied Behavioral Science, 2(2), 210 – 218.
Gibb, J. R. (1964). Climate for trust formation. In L. P. Bradford, J. R. Gibb, and K. Benne (Eds.) T-group Theory and Laboratory Method. New York: Wiley.
Goldschmidt, W. (1990). The Human Career: The self in the symbolic world. Cambridge, MA.: Basil Blackman.
Kass, R. (2002). Theories of Small Group Development. Montreal: The Center for Human Relations and Community Studies.
Lobel, M., Neubauer, M., and Swedburg, R. (2002). Elements of group interaction in a real-time synchronous online learning-by-doing classroom without F2F participation. USDLA, April. Retrieved May 5, 2002 from: http://www.usdla.org/html/journal/APR02_Issue/article01.html
Marks, S., and Davis, W. (1975). The experiential learning model and its application to large groups. The 1975 annual handbook for group facilitators. San Diego, CA: University Associates Publishers, Inc.
Parks, M., and Floyd, K. (1996). Making friends in cyberspace. Journal of Computer Mediated Communication 1(4). Retrieved February 17, 2002 from: http://jcmc.huji.ac.il/vol1/issue4/parks.html
Schutz, W. (1988). Profound simplicity. (3rd Ed.) Muir Beach, CA.: WSA.
Shattuk, R. (1980). The Forbidden Experiment: The story of the wild boy of Aveyron. New York: Farrar, Straus, and Giroux.
Strangelove, M. (1994). The Internet, electric gala and the rise of the uncensored self: from essays on the anthropology of cyberspace. Computer-Mediated Communication Magazine, 1(5). Retrieved April 5, 2002 from: http://www.ibiblio.org/cmc/mag/1994/sep/self.html
Tu, C.H. (2000). Online Learning Migration: From social learning theory to social presence theory in CMC environment. Journal of Network and Computer Applications, 23(1), 27 – 37.