
December – 2012
A Qualitative Analysis Framework Using Natural Language Processing and Graph Theory
 |
Patrick J. Tierney
Brock University, Canada
Abstract
This paper introduces a method of extending natural language-based processing of qualitative data analysis with the use of a very quantitative tool—graph theory. It is not an attempt to convert qualitative research to a positivist approach with a mathematical black box, nor is it a “graphical solution”. Rather, it is a method to help qualitative researchers, especially those with limited experience, to discover and tease out what lies within the data. A quick review of coding is followed by basic explanations of natural language processing, artificial intelligence, and graph theory to help with understanding the method. The process described herein is limited by neither the size of the data set nor the domain in which it is applied. It has the potential to substantially reduce the amount of time required to analyze qualitative data and to assist in the discovery of themes that might not have otherwise been detected.
Keywords: Qualitative analysis; graph theory; natural language processing
Qualitative research is often seen by quantitative researchers as not presenting the positivist rigor that is found in quantitative studies because of its subjectivity and its dependence on “an investigator’s own style of rigorous empirical thinking, along with the sufficient presentation of evidence and careful consideration of alternative interpretations” (Yin, 2009, p. 127). A number of software applications exist to make the often copious amount of data more manageable for the analyst, but they are mostly assistive, tracking the asignation of codes and categories to specific entities in the data, but are still dependent on the inferential capabilities of the researcher-analyst. In recent years, a new class of software applications has become available that use natural language processing (NLP) as a first step in reducing the subjective nature of qualitative analysis. Some of these applications have introduced graph theory in representing the data. This report describes an analytical process developed for a recent study that incorporated techniques from standard coding processes to include the use of graph theory. The process was developed during a recent study that explored the use of distance education (DE) technologies to support lifestyle change (Tierney, 2011). Qualitative data generated during the study were limited to the transcripts from semistructured qualitative interviews. However, the methods described herein are not limited to interview analysis, particularly in the distance-learning domain. DE researchers have long used text from discussion forums in their studies, which can represent a copious amount of information when examining threads spanning an entire semester or multiple semesters. In much the same way, social media (e.g., Facebook and Twitter) represent another vast source of data. Standard coding methods require substantial investments of time and resources, which may not always be available to researchers.
The methods herein were not used as a graphical method with deterministic outcomes per se. Rather, they assisted the qualitative researcher to visualize relationships within the data. The result was a process which may hold promise in analyzing and understanding data more quickly and in presenting a form of qualitative analysis that has some aspects of positivism, but still allows the researcher the ability to examine data and provide an understanding that can only be gained through qualitative inquiry.
Literature Review
This section provides a brief overview of the domains that form part of the new approach to qualitative data analysis, starting with the domain of quantitative text analysis. A very brief review of coding is followed by an introduction to natural language processing and its relationship to artificial intelligence and a review of the pertinent areas of graph theory. The section ends with a survey of existing software applications for computer-assisted qualitative analysis software (CAQDAS).
Quantitative Text Analysis
Evans (1996) provided a review of the state of computer-assisted analysis of text and images in the mid-1990s. At the time,
developers of software for qualitative data analysis [had] long known that it is most appropriate to view computers as tools with which to support rather than replace human coders, especially when so few tools exist[ed] to automate sophisticated analysis procedures. (p. 271)
However, most of his discussions in that paper dealt with quantitative rather than qualitative approaches to text and image analysis. It is unclear whether his decision to not foray into the qualitative aspects of the tools and techniques reviewed was due to positivist leanings, whether his own or the research community at the time. After all, qualitative research had only taken firm hold just a few years before, following the paradigm wars of the 1980s (Denzin & Lincoln, 2011, p. 1).
Roberts (2000) provided some history on the origins of quantitative text analysis, recounting the results of a 1955 conference of Harvard University which developed the contingency analysis method:
The first step in a contingency analysis involves counting occurrences of content categories within sampled blocks of text. This produces a data matrix... with distinct content categories (or themes) heading the columns, unique text blocks heading the rows, and counts of occurrences (of theme within block) in the cells. The analysis proceeds by computing a matrix of associations between pairs of themes. Finally, the researcher develops (usually post hoc) explanations of why some themes co-occurred and why others were disassociated (i.e., negatively associated). (pp. 260-261)
The contingency analysis method assists the researcher in keeping track of relationships between textual elements and emerging themes, but at its heart it is still a quantitative method, relying entirely on the researcher to provide the meaning within the text.
Coding Qualitative Data
Qualitative researchers often use broad ideas, themes, or concepts as tools for making generalizations. The analysis of this data can have nonvariable concepts or nominal-level variables (Neuman, 2006, p. 459). New or refined concepts are grounded in the data. Because concept formation is an integral part of qualitative data analysis and begins during data collection, “conceptualization is one way that a qualitative researcher organizes and makes sense” (p. 460). Data coding is used to assist this conceptualization process. Neuman (2006, p. 460) cites the description of codes by Miles and Huberman (1994, p. 56):
Codes are tags...for assigning units of meaning to the descriptive or inferential information compiled during a study. Codes usually are attached to “chunks” of varying size—words, phrases, sentences or whole paragraphs, connected or unconnected to a specific setting.
Neuman identifies Strauss (1987) as having defined the coding process, made up of three distinct kinds of qualitative data coding. (Neuman [2006, p. 460] also reiterates the Strauss [1987, p. 55] warning that “coding is the most difficult operation for inexperienced researchers to understand and to master.”) The three coding types are open, axial, and selective, and are sequential. In the first step, open coding, the researcher examines the data to condense them into preliminary analytic categories or codes (Neuman, 2006, p. 461). The next step, axial coding, requires the researcher to organize the codes, link them, and discover key analytic categories (p. 462). In the final step, selective coding, the researcher examines previous codes to identify and select specific passages that will support the conceptual coding categories that were previously developed (p. 464).
Large data sets “require considerable manual effort to analyze as researchers read and reread the data to locate evidence to support or refute their theories” (Crowston, 2010, p. 1). However, most qualitative data analysis software packages primarily track the manual conceptualizations and categorization performed by the researcher; they do not assist with the conceptualization process itself.
Natural Language Processing
“Natural language,” as the terms suggests, is language spoken or written by humans, as opposed to a language used to program or communicate with computers. Natural language processing (NLP) falls under the rubric of artificial intelligence (AI), which is the subfield of computer science concerned with the concepts and methods of symbolic inference by computer and symbolic knowledge representation for use in making inferences. Natural language understanding by computers is one of the hardest problems of artificial intelligence due to the complexity, irregularity and diversity of human language and the philosophical problems of meaning (natural language, n.d.). AI can be seen as an attempt to model aspects of human thought on computers (artificial intelligence, n.d.). (This report does not attempt to explain the very complex computational theories, processes, or algorithms that underpin NLP software. Instead, NLP applications are treated as a black box, with a brief description of how a qualitative researcher would use NLP software.)
In its current state of development, the setup and use of AI-based software can be tedious and time-consuming because these technologies (e.g., speech and speaker recognition, biometric-based identification such as fingerprint and face recognition, and retinal scanning) require training prior to processing input data. Crowston, Allen, and Heckman (2011, p. 2) studied two methods for training NLP software. In each approach, a portion of the data set is used for training purposes, with the remainder being used to inform the research project. The first is a rules-based approach which is knowledge-based, analyzing linguistic phenomena that occur within text using syntactic, semantic, and discourse information. The researcher iteratively constructs coding rules for the most abundant and obvious examples for each code. Training occurs as the rules are progressively refined for coverage and accuracy. The second approach involves machine-learning (ML) algorithms to “automatically learn the complex patterns underlying the extraction decisions based on statistical and semantic features identified in textual data” (p. 2). Crowston et al. determined that, compared to manual rule writing, the ML process was more automatic: training data is used to train a classifier using a machine-language algorithm that infers rules for extraction using features within the dataset itself. However, in practical terms, “human coders would still have to be used to code an initial set of data for training, but from there the trained classifier could be used to infer the code labels for the rest of the data automatically, allowing coders to shift their attention to checking the machine-coded data to further improve precision, focusing on the most important and nonautomatable job of making sense of the data.
Graph Theory
One NLP-based qualitative analysis software package uses graphs, mathematical structures used to model pair wise relations between objects from a certain collection, as one technique for representing the relationships between categories developed during analysis. Graph theory is the study of graphs and how they can be used to solve or sometimes only understand what are often very complex problems. In fact, there are graphs for which a general solution is not available, only a subset that bound by very specific conditions can be solved.
A graph refers to a collection of vertices or nodes and a collection of edges that connect pairs of vertices. The edges represent relationships amongst the nodes (Manber, 1989, p. 83). Any subset of a graph’s nodes and edges is called a subgraph. Using the simple components of nodes and edges, graphs can be used to model a large variety of both natural and human-made structures and situations.
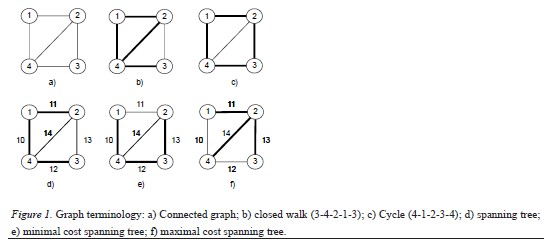
As with all other branches of mathematics, graph theory uses very specific terminology. Graphs can be directed, where the relationship between the joined vertices is unidirectional and the edges are represented with an arrow. In undirected graphs, the relationship between the joined vertices is bi-directional, represented simply with a line (Figure 6a). An additional property of edges is that they can have a weight associated with them: a numerical value that quantifies the relationship of the two nodes joined by the edge (Figure 6d). Weights are sometimes referred to as costs. For example, the weight can represent properties such as distance, frequency, resistance, or flow.
An important aspect of graphs, which influences their analysis, is the connectedness of the vertices. A pair of vertices is connected if there is a path (i.e., edge) between them. In a connected graph, every pair of vertices are connected (Figure 1a). A closed walk in a graph is a path of nodes and edges between a vertex and itself (Figure 1b). A closed walk in which no edges repeat is a circuit (Figure 6c). A cycle is a circuit with no repeated vertices (Balakrishnan, 1997, p. 29; Figure 1c); an acyclic graph has no cycles. A specialized form of graph addressed in this report is the tree, a connected acyclic graph.
A lengthy discussion of the mathematics involved in studying and analyzing graphs is beyond the scope of this report. However, certain algorithms pertaining to trees are germane to the discussion because these constructs can identify relationships across entire data sets that might not be evident to all observers. A spanning tree of a connected, undirected graph is a tree composed of all the vertices and some (or all) of the edges in the graph (Figure 1d). Prim’s algorithm (Manber, 1989, p. 208; Balakrishnan, 1997, p. 94) is used to find the minimum weight spanning tree within an undirected graph. Such a construct defines the acyclic subgraph that connects all the vertices of the graph at minimal cost (Figure 1e). In a subsequent section, a maximum weight spanning tree connects all the vertices of the graph at maximal cost (Figure 1f).
Computer-Assisted Qualitative Data Analysis
Many qualitative researchers use electronic spreadsheet software (e.g., OpenOffice/LibreOffice Calc, Microsoft Office Excel) to assist with managing the coding of qualitative data. Such applications aid in the capture of codes and categories, searching data associated with specific codes and categories, and the generation of histograms and other frequency representations. The ubiquity of such applications and their relatively low cost—OpenOffice/LibreOffice Calc are open source, making them available at no cost—plays a substantial role in their widespread use, particularly among student researchers.
There are several software tools specifically designed for qualitative data analysis (QDA), such as Atlas.ti and Nvivo.
[They] manage the traditional processes of manual coding and support retrieval of coded segments (Richards, 2002)....[Some] offer capabilities for automatic coding such as supporting automated searches for keywords or regular expressions but no support for semantic or higher levels of language. (Crowston, Allen, & Heckman, 2011, p. 5)
Hence, any further development of meaning that may be found in the data becomes an inductive process for which QDA tools provide no direct assistance. Some packages (e.g., Atlas.ti) are able to present network views of the data, but these views do not provide a visualization of the frequency codes or categories nor do they report the strength/weight of the relations between codes.
Open source packages offer the researcher tools for QDA. NLP libraries such as Carrot2 and Apache’s OpenNLP require additional programming to form an integrated application. RapidMiner is a mature data mining tool with text processing and visualization capabilities but would require some customization or the development of ad hoc procedures to analyze qualitative research data.
The IBM SPSS Text Analytics for Surveys (TAS) package incorporates several features which bookend the categorization process. (TAS does not use the standard code and category method where categories are mutually exclusive. Instead, it uses non-exclusive categories.) Prior to the categorization step, TAS can use NLP to identify potential categories which the analyst can then keep or discard. Once categories have been developed, the visualization component of TAS offers features not found in other packages. The researcher can use the application’s graphing capabilities to create category maps which show the relative strength of the relations between categories. The analyst can filter for weight ranges, further isolating specific data for closer analysis. No other packages were found to have this visualization capability.
Method
The study data for which this natural language processing/graph theory (NLP/GT) method was first used originated from a series of semistructured qualitative interviews on participants’ experiences using distance education technologies for lifestyle modification/behavior change. Five interviews were conducted generating over seven hours of recordings. The purpose of this report is to document the qualitative analysis process, thus any further description of the study or how the data was collected is considered ancillary and therefore not presented here.
The qualitative data analysis for the study used the IBM SPSS Text Analytics for Surveys V4 (TAS4) tool (http://www.spss.com/software/statistics/text-analytics-for-surveys/) to analyze the interview data. There are two key differences between TAS4 and other qualitative data analysis tools (e.g., Atlas.ti, Nvivo). First, it does not rely solely on the reasoning and capabilities of the researcher to carry out the analysis. Instead, through the use of internal resources such as dictionaries, thesauruses, templates, and libraries, it uses NLP to identify keywords within the data, providing results that are more objective than researcher induction alone. Second, there is no defined hierarchy as would be found in codes and their categories: There are only categories. Further, the categories are not mutually exclusive as is normally the case for traditional coding using codes and categories, thus the meaning of a single data object can be placed in more than one category. When the researcher assigns categories to a single quotation or other data object, TAS4 looks for keywords from that data object in other quotes, assigning the same category when a keyword or synonym match are found.
TAS4 was selected for several reasons. Primarily, it was chosen on the recommendation of colleagues of the principal researcher on this study. In their experience, TAS4 substantially reduced analysis time, sometimes by as much as 50% when compared to other methods/tools. TAS4’s visualization capabilities, particularly the category maps, enable researchers to more quickly expose meaning and nuance, thus enabling the development of themes more quickly. Furthermore, the validity of the analysis results is augmented as a result of machine-processing, which could also result in a time-savings by not having to reanalyze data based on questioning of data that can arise when analysis is completely subjective.
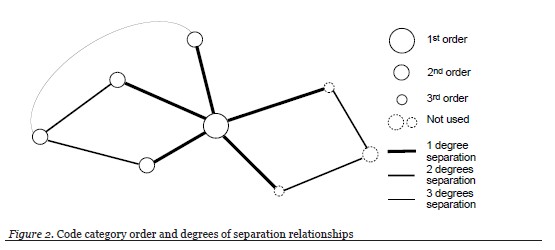
In order to replace the hierarchical nature normally found in codes and categories, a relationship which aids in the identification of themes, a hierarchy based on order of magnitude (i.e., powers of 10) was introduced. For this study, a first order category had at least 100 (102) shared responses, a concept that has been associated with two or more categories, with other categories; a second order category had from 10 to 99 (101) shared responses; a third order category had 9 (100) or fewer shared responses. Figure 2 illustrates these concepts. A more generalized heuristic would define the “orders” in a data set based on the category frequencies found in that data set. Orders of magnitude seemed to be appropriate, but another researcher may decide to use another scheme based on the number of categories generated and their respective frequencies. With the order of magnitude approach, first order would include those categories whose frequencies had a factor with the highest power of ten, second order would have the second highest power of ten as a factor, and so on. The maximum number of “orders” for any dataset would be the exponent of ten in the first order frequencies plus one because the factor 100 represents the lowest order. This can be expressed mathematically, using scientific notation as
Category frequency = F (10n)
where F is a ratio-level measurement greater than or equal to 1 and less than 10 [i.e., 53=5.3(101), 942=9.42(102)]; n is the exponent (power) of ten, also the order of magnitude. The maximum number of orders would be n + 1. For example, a data set with the highest category frequencies being greater than or equal to 1,000 but less than 10,000, the maximum number of orders would be 4 (i.e., 3 + 1), first order category frequencies would have a factor of 103, fourth order categories would have a factor of 100.
For any category, its order, Oc, would be
Oc = (nmax + 1) – n
where nmax is the order of magnitude of the first order categories and n is the order of magnitude of the specific category.
In order to reduce the “noise” within the category graphs, the concept of degrees of separation was introduced. Any two categories that had a direct relationship (i.e., they had shared responses between them) were identified as having one degree of separation. Categories that had responses common with another category, but not each other, were assigned two degrees of separation. Categories separated by two categories have three degrees of separation, and so on. See Figure 2.
Results and Discussion
The steps in the analysis of the qualitative interview data collected for this study were as follows.
1)Transcripts were created from the audio recordings of the interviews.
2) The transcripts were then dissected to identify single concepts. Concepts are usually a single sentence or several sentences centered around a single idea.
3) The concepts were entered into a single electronic spreadsheet file, with each concept in its own cell.
4) Identifiers, unique codes for each interviewee, and demographic data were added for each entry.
5) Once completed, the spreadsheet file was imported into TAS4.
6)TAS4 processed the interview data using natural language processing to identify keywords within each quotation.
7) Categories with names meaningful to the study were created (e.g., role modeling, metacognition, trust, multimedia, etc.).
8) Categories were then assigned to individual quotes. Multiple categories were applied if
appropriate (e.g., the quote “I am not a Facebook person” was assigned the facebook, social support, and perception of others categories).
9) If a category was improperly assigned as a result of the NLP, that quote was removed from the category. As an example, the natural language processing of the entire data set generated people as one of the keywords. The NLP engine uses synonyms, thus it would associate the term person with people. The quote “I am not a Facebook person” contains the keyword person. The researcher created the category perception of others and linked the quote “I am not a Facebook person” to it. As a result, any data that contains the word person would automatically be associated to perception of others. The quote “I am not an ‘easy solution’ person – anything like that would not interest me” was assigned to perception of others because it contained the keyword person. However, the quote’s meaning was not about perception of others, per se, but was closer in meaning to type of person. The quote was removed from perception of others and linked to type of person.
10) The initial NLP generated several thousand keywords within the data. The researcher identified approximately 40 categories.
11) Five first-order categories developed. These categories were the basis of the themes found in the data analysis.
12) TAS4 created category graphs, or category webs as they are called in the software, which gave a pictorial representation of each of the first-order categories and their associated second-order categories.
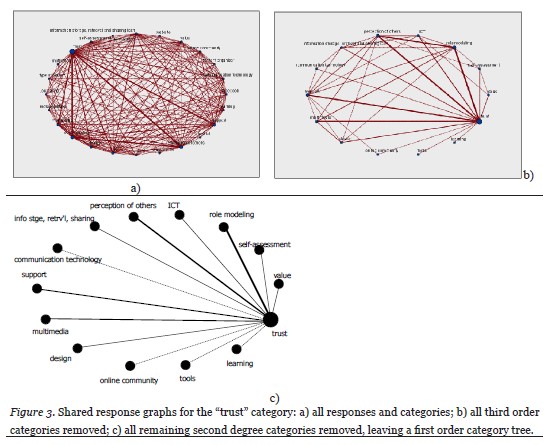
The category graphs were used to develop and expand each of the themes. Most of the second order categories in a given graph had a direct relationship to the given first-order categories, hereafter referred to as having one degree of separation. Others only had an indirect relationship to the first-order category, and these were designated as having two degrees of separation. Figure 3a illustrates these concepts. Third order categories and categories with more than one degree of separation were not used in order to reduce the amount of “noise” in the graph. Figure 3b illustrates the difference between the original graph for the category trust and when third order categories have been removed. A third graph must be created that removes all categories and links with more than one degree of separation (Figure 3c). TAS4 was not able to isolate interview data between a given theme category and just one of its meaning categories. To overcome this limitation, an electronic spreadsheet file was constructed to allow examining only those data objects that were shared between the two categories.
Categories Developed From Study Data
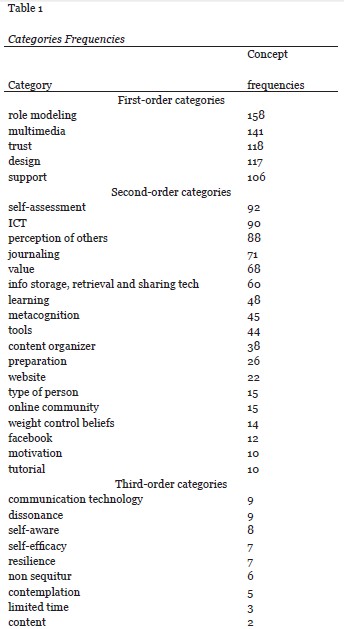
The transcribed interview data was broken down into 505 concepts. Using the natural language processing of TAS4, 38 categories were developed. Table 1 lists those categories and the number of concepts associated with each one.
Theme Discovery
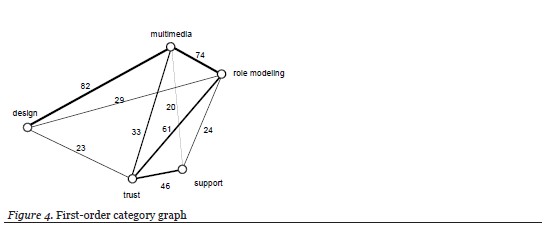
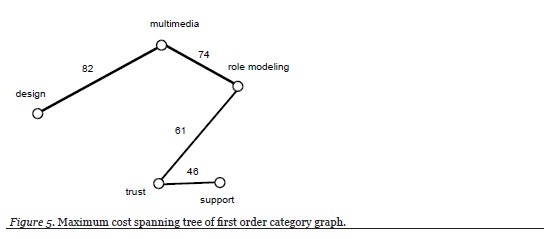
The use of graphs is not intended to be a graphical method of analysis with deterministic outcomes. Instead, their purpose is to aid the qualitative researcher, especially novice qualitative researchers, in discovering any structures that lie within the data and their relationships with the research question(s). To start the theme discovery within the study data set, a graph was constructed that included all the first order categories and the single degree of separation relationships between them. See Figure 4. Using the maximum spanning tree method from graph theory, a graph was constructed that contains all of the first order categories and only the relationships amongst those activities with the highest shared response rate. See Figure 5. Upon examination of the maximum spanning tree graph, a number of category pairings were identified: design | multimedia; multimedia | role-modeling; role-modeling | trust; trust | support. These pairings were then qualitatively analyzed for meaning.
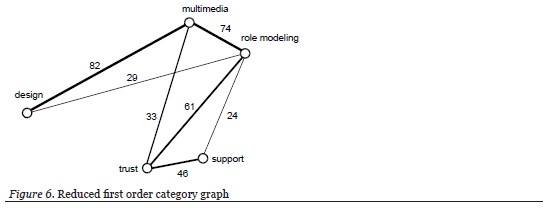
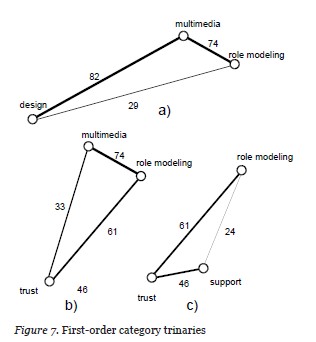
Themes could have been developed from the maximum cost spanning tree using three subgraphs: role modeling—multimedia—design; multimedia—role modeling—trust; and, role modeling—trust—support. However, there was no obvious way, through the included edges, to relate the start and end nodes of each subpath thereby creating more cohesive themes. Therefore, in order to find such logical connections within the data, the first order category graph was revisited, removing all relationships among the first-order categories with less than approximately 24 shared responses (Figure 6). This resulted in the identification of three cycles in the graph that might help in better formulating the themes (Figure 7):
- role modeling, multimedia, and design (Figure 7a);
- role modeling, multimedia, and trust (Figure 7b);
- role modeling, trust, and support (Figure 7c).
Based on these combinations, three themes were developed. These themes and what they mean for distance-based lifestyle change are as follows: 1) Online multimedia resources for lifestyle change should be designed for role modeling; 2) Online multimedia for the purpose of
role modelling should promote a sense of safety and security, avoid risk of physical or emotional harm, and ensure that only accurate up-to-date information is provided; 3): Social support for lifestyle change should involve trusted role models.
Conclusion
Analyzing qualitative data can be a laborious and at times pedantic, time-consuming process. Conceptualization, especially for new researchers, can be very difficult to master. A new class of qualitative data analysis software which uses natural language processing offers tools to both simplify and accelerate the discovery of new themes and theory within that data. The concepts presented in this paper have built on natural language processing to further accelerate the discovery of what lies within the data.
This project has exposed opportunities for further research in several areas. No formal comparison was made with other tools such as Atlas.ti or Nvivo prior to embarking on the use of TAS4. Nonetheless, TAS4 does appear to have some strengths over these other software packages. Its nonexclusive use of categories uniquely allows for the generation of graphs. And with the ability to build and extend templates, the speed of analysis is almost certain to be increased when working on data sets within a given field, compared to other tools. (For the demonstration project described in this report, the categorization and theme development for 505 concepts took less than two days.) A study to identify such time savings would prove very useful in supporting the use of graph theory and natural language processing for qualitative data analysis. The cost of applications like TAS4 represent a substantial barrier to their adoption, especially in academia. The availability of open source natural language processing packages and other data/text mining software (e.g., Apache NLP, RapidMiner) may represent an avenue to the wider adoption of NLP-based qualitative data analysis.
As with all new approaches, only their use in different situations can help to debug and refine them. It is hoped that others will do exactly that to enhance the robustness of using graph theory with qualitative data natural language processing. In addition to new validation attempts of the method based on first order categories, analysis at a finer granularity than was attempted in the study for which the method was developed needs to be carried out. It is believed that when second and third order relationships are included, very subtle nuances can be discovered and teased out, further strengthening the contributions of qualitative studies.
References
Artificial intelligence (n.d.). In Free online dictionary of computing. Retrieved September 1, 2011 from http://foldoc.org/artificial+intelligence.
Balakrishnan, V. K. (1997). Schaum’s outline of theories and problems of graph theory. New York, NY: McGraw-Hill.
Crowston, K., Allen E. E., & Heckman R. (2011). Using natural language processing for qualitative data analysis. International Journal of Social Research Methodology. Doi:10.1080/13645579.2011.625764.
Crowston, K. (2010). Machine learning and rule-based automated coding of qualitative data. Paper presented at ASIST 2010, Pittsburgh, PA.
Denzin, N. K., & Lincoln, Y. S. (2011). The Sage handbook of qualitative research (4th ed.). Thousand Oaks, CA: Sage Publications, Inc.
Manber, U. (1989). Introduction to algorithms: A creative approach. Reading, MA: Addison-Wesley Publishing Company.
Miles, M. B., & Huberman, M. (1994). Qualitative data analysis (2nd ed.). Thousand Oaks, CA:Sage.
Natural language (n.d.). In Free online dictionary of computing. Retrieved September 1, 2011 from http://foldoc.org/natural+language
Neuman, W. L. (2006). Social research methods: Quantitative and qualitative approaches (6th ed.). Boston, MA: Pearson Education Inc.
Roberts, C. W. (2000). A conceptual framework for quantitative text analysis: On joining probabilities and substantive inferences about texts. Quality & Quantity, 34(3), 259–274.
Strauss, A. (1987). Qualitative analysis for social scientists. New York, NY: Cambridge University Press.
Tierney, P. (2011). Exploring the use of distance education technologies for lifestyle change (Unpublished master’s thesis). Athabasca University, Athabasca, AB. Retrieved from http://hdl.handle.net/10791/12
Yin, R. K. (2009). Case study research: Design and methods (4th ed.). Thousand Oaks, CA: Sage Inc.