
October – 2008
Meta-Analysis: The preferred method of choice for the assessment of distance learning quality factors
Mickey Shachar
TUI University
College of Health Sciences and College of Education
USA
Abstract
Current comparative research literature, although abundant in scope, is inconclusive in its findings, as to the quality and effectiveness of distance education versus face-to-face methods of delivery. Educational research produces contradictory results due to differences among studies in treatments, settings, measurement instruments, and research methods. The purpose of this paper is to advocate the use of a meta-analytic approach by researchers, in which they synthesize the singular results of these comparative studies, by introducing the reader to the concept, procedures, and issues underlying this method. This meta-analytic approach may be the best method appropriate for our ever-expanding and globalizing educational systems – in general, crossing over geographical boundaries with their multiple languages, and educational systems in particular. Furthermore, researchers are called to contribute to a common database of distance learning factors and variables, from which future researchers can share, glean, and extract data for their respective studies.
Keywords: Distance Learning; Meta-Analysis
Introduction
"I had hoped to find research to support or to conclusively oppose my belief that quality integrated education is the most promising approach. For every study that contains a recommendation, there is another, equally well-documented study, challenging the conclusions of the first...No one seems to agree with anyone else's approach. But more distressing: no one seems to know what works." Senator Fritz Mondale (Bangert-Drowns & Rudner, 1991).
U.S. Senator Fritz Mondale's quote (true then as it is today) illustrates a common plight: Current comparative research literature, although abundant in scope, is inconclusive in its findings, as to the quality of distance education versus face-to-face methods of delivery.
Furthermore, educational research often produces contradictory results due to differences among studies in treatments, settings, measurement instruments, and research methods, leading to the point where research findings are difficult to compare, and may become so extensive as to obscure trends with an overwhelming amount of information.
This problem has now been intensified by the telecommunication revolution of the 1990s and 2000s that has also boosted the proliferation of DL, opening local and international geographical boundaries, allowing schools to offer their academic programs to a diverse and growing potential student body. It is therefore obvious, that the assessment of this diverse and international boundary-less trend and its academic outcomes should require undertaking new directions that can encompass said enhanced change of scope.
It may be that there is an answer to this dilemma, should researchers adopt a meta-analytic approach, in which they synthesize the singular results of these comparative studies. The purpose of this paper is to advocate the use of Meta-Analysis (MA) by introducing the reader to the concept, procedures, and issues underlying this method. It should be noted, that the meta-analytic approach may be the best (if not the only) method appropriate for our ever-expanding and globalizing educational systems – in general, crossing over geographical boundaries with their multiple languages, and educational systems in particular.
DL Assessment: The current research problem
Although a substantial body of research on distance education (DE) academic outcomes was conducted and compiled in the 1990s-2000s, it seemed to conclude that distance education outcomes were not that different from those achieved in traditional classrooms (DeSantis, 2001; Phipps & Merisotis, 1999; Russell, 2002). On the other hand numerous research studies present results that show a different picture and conflict with the conclusions cited above, creating a mixed and confusing situation (Dellana, Collins, & West, 2000).
It should be explicitly noted, that the abundance of research conducted, has not passed with out controversy and debate within the academic community. Phipps and Merisotis (1999) provided a ‘collective’ problem definition: The most significant problem is that the overall quality of the original research is questionable and thereby renders many of the findings inconclusive, pointing out the major drawbacks and key shortcomings of the research: (a) Much of the research does not control for extraneous variables and therefore cannot show cause and effect; (b) Most of the studies do not use randomly selected subjects; and (c) The research focuses mostly on the impact of individual technologies rather than on the interaction of multiple technologies.
The most frequently asked and researched questions regarding comparisons between DE and traditional education pertain to the quality of instruction and learning, the cost of attendance, the needs of the “characteristic or average” DE student, Student satisfaction towards DE, and a comparison of the factors affecting the instructional efficacy and student learning in both situations. A caveat to note is that DE is not uniform in its delivery and utilizes various instructional methods (synchronous and a-synchronous), and technologies (CD and Internet based instruction, one/ two way audio and visual interactions, etc.), leading to the usage of very broad measures to examine the effectiveness of DE.
Although, there are numerous independent studies pertaining to DE recorded in the literature, we also can see the recurring appearance in recent years of secondary data analyses in many DE related fields, of which I will point out but a few: Zhao and colleagues (2005) in their meta-analytical study of research on distance education identify factors that affect the effectiveness of distance education, and report that DE programs, vary a great deal in their outcomes to be associated with pedagogical and technological factors; Williams (2006) focuses on the effectiveness of DE in allied health science programs, by conducting a meta-analysis of student achievements and reports that open learning and synchronous instruction were the most effective distance education models of instruction; Sitzmann, Kraiger, Stewart and Wisher(2006) compared the effectiveness of Web-based and classroom instruction by means of a meta-analysis and further examined the moderators of the two delivery media; Saba (2000) provides a status report past and current on research trends and methods in distance education; Glenn, Jones and Hoyt (2003) compared differences from multiple studies between web-mediated versus traditional delivery in terms of the impact on student learning and satisfaction; and Allen, Bourhis, Burrell and Mabry (2002) compared student satisfaction with DE versus traditional classrooms in the higher education arena by means of a meta-analysis.
Effect Size and Meta-Analysis: The conceptual and practical solution
Consequently, many researchers advocate the ‘refining’ of these “broad” measures and variables, further debating and arguing that in terms of statistics, null-hypothesis testing should be eliminated altogether, advocating alternatives in future research that should focus on effect size to the extent that reporting them should be ‘mandatory’ (Lockee, Burton & Cross, 1999; Thompson, 1996).
Educational measurement in general would benefit greatly, should researchers adopt: (1) The practical usage of comparative effects sizes in their studies, in general, and (2) The synthesizing of these effect sizes by means of a meta-analysis, in particular.
The ‘acceptance of the Glassian meta-analysis concept,’ and the ‘implementation of meta-analytic procedures in research,’ provide a feasible answer and solution to this plight (as, meta-analysis is the application of statistical procedures to collections of empirical findings, from individual studies for the purpose of integrating, synthesizing and making sense of them (Bangert-Drowns & Rudner, 1991; Becker, 1998; Cook, Heath & Thompson, 2000; Heberlein & Baumgartner, 1978; Lemura, Von Duvillard & Mookerjee, 2000; and Niemi, 1986).
As in many other fields, the concept in itself, does not promise accurate or true results. It is the strict adherence to the procedures, and systematic treatment and analysis of the data, which will ensure acceptable statistical findings.
It seems appropriate, that an honest and professional effort be exerted to find ‘common ground,’ and a ‘common denominator’ between all relevant educational measurements in general, and learning outcomes in particular. One of the benefits and advantages of conducting meta-analysis, is that it ‘gives a voice’ to ‘small and distinct’ studies, each one in itself not strong enough to qualify as being statistically significant, or robust enough to warrant serious consideration. But ‘integrated together,’ can contribute their findings to the ‘big picture.’
Definitions
Meta-Analysis (MA): A collection of systematic techniques for resolving apparent contradictions in research findings; Meta-analysts translate results from different studies to a common metric and statistically explore relations between study characteristics and findings; A meta-analysis on a given research topic is directed toward the quantitative integration of findings from various studies, where each study serves as the unit of analysis; The findings between studies are compared by transforming the results to a common metric called an effect size (ES)” (Bangert-Drowns & Rudner, 1991; Becker, 1998; Cook, Heath, & Thompson, 2000; Lemura, Von Duvillard, & Mookerjee, 2000).
Effect Size (ES): Comparison in terms of a standard, i.e. a ‘standardized difference’ denoted by the symbol ‘d’; the mean difference between groups in standard score form - the ratio of the difference between the means to the standard deviation (Yu, 2001).
The logic of calculating ES is that researchers should be concerned with not only whether a null hypothesis is false or not, but also how false it is (When the President asks the five-star general to estimate the war casualty, can he give "not zero" as a satisfactory answer?), i.e., if the difference is not zero, how large the difference one should expect? By specifying an effect size, which is the minimum difference that is worth research attention, the researcher could design a study with optimal power rather than wasting resources on trivial effects. The larger the effect size (the difference between the null and alternative means) is, the greater the power of a test is (Yu, 2001).
Meta-Analytic Approaches
Within the field of meta-analysis, we have different approaches as to their procedures, computations, and interpretation of results. It is most important that the researchers explicitly point out which was implemented within their respective studies. For the purpose of this paper, only the Glassian and Study MA will be discussed:
-
Classic or Glassian Meta-Analysis – Glass' early meta-analyses set the pattern for conventional meta-analysis: define questions to be examined, collect studies, code study features and outcomes, and analyze relations between study features and outcomes. Features: (1) ‘classic’ meta-analysis applies liberal inclusion criteria; (2) the unit of analysis is the study finding. A single study can report many comparisons between groups and subgroups on different criteria. Effect sizes are calculated for each comparison; (3) meta-analysts using this approach may average effects from different dependent variables, even when these measure different constructs. Glassian meta-analysis has proven quite robust when submitted to critical re-analysis.
- Study Effect Meta-Analysis – Study effect meta-analysis alters the Glassian form in two ways: (1) inclusion rules are more selective. Studies with serious methodological flaws are excluded; and (2) the study is the unit of analysis. One effect size is computed for each study.
Meta-Analysis: Process and Procedures
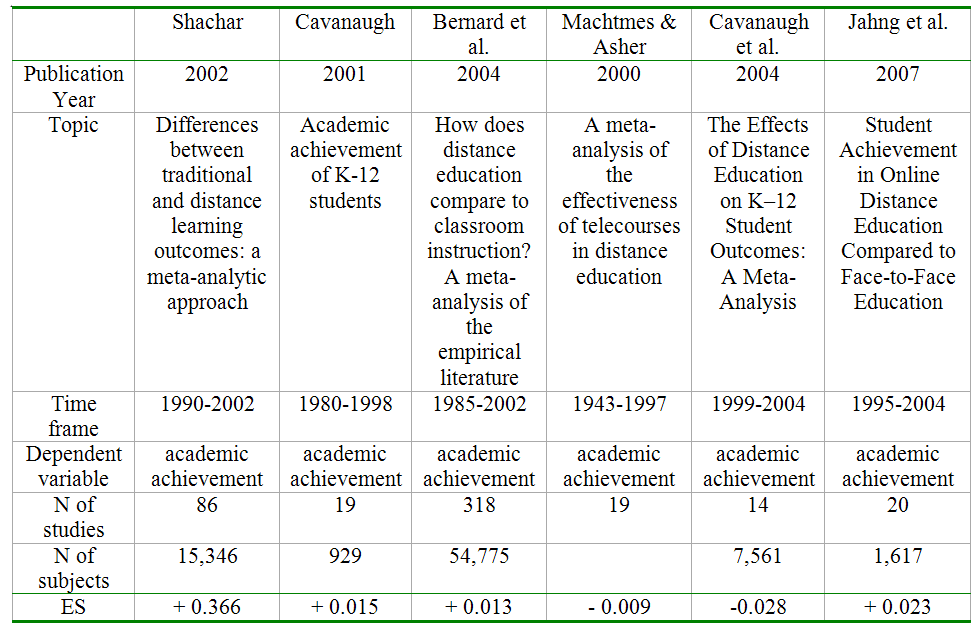
The MA required processes and procedures will be presented as implemented by the author (Shachar, 2002) in detail, and by other researchers (Cavanaugh, 2001; Bernard et al., 2004; Machtmes & Asher, 2000; Cavanaugh et al. 2004; and Jahng et al., 2007) in general, all having conducted comparative DE versus Traditional education meta-analyses with students’ academic achievement as their dependent variable (see Table 1).
Table 1. Meta-Analyses in Recent DE Research
Procedures
In general, the procedures for conducting a meta-analysis were suggested by Glass, McGraw, and Smith (1981). Their approach requires a reviewer to complete the following steps: carry out a literature research to collect studies; code characteristics of studies; calculate effect sizes as common measures of study outcomes; and search for relationships between study features and study outcomes. The following sections provide an enhancement of these broad requirements and explain (as ‘painlessly’ as possible) each methodological step and decision needed to be undertaken in a MA study:
Step 1: Defining the Domain of Research – The IV is the method/ mode of delivery, operationalized as: (1) Distance education mode and (2) The traditional mode. The commonly researched variables are of the factors pertaining to the quality/ effectiveness of distance learning programs: academic performance; student attitudes; student satisfaction; student cognitive learning and evaluation of instruction. In Shachar (2002) - the factor and DV is Final Academic Performance. Note: the researcher must ascertain that the DV is the same across all studies.
Step 2: Criteria for Including Studies in the Review: Criterion 1 – The time period to be covered in the review. In Shachar (2002) 1990 – 2002; Criterion 2 – Published / Unpublished studies. In Shachar (2002): Both types were included; Criterion 3 – The quality of a study. In Shachar (2002): Only studies showing no severe methodological flaws were included; Criterion 4 – Control group - Each primary study should have a control or comparison group. This is ‘essential,’ as we are calculating the effect size, which is the: “mean difference between groups in standard score form; Criterion 5 – Sufficient Quantitative Data presented in the studies, e.g. sample size, mean and standard deviation, from which effect sizes can be calculated.
Step 3: Determining the Type of Effect Size to Use – As different statistical methods exist for combining data, with no single ‘correct’ method (Egger, Smith, & Phillips, 1997) one can choose between and/ or assess the appropriateness of two ‘popular’ approaches for mean comparison: (a) Glass, McGraw & Smith (1981) developed the basic formula for the effect size as: ‘The mean of the experimental group (Me) minus the mean of control group (Mc), divided by the standard deviation of the control group’, or (b) Hunter and Schmidt (1990) suggesting using a ‘pooled within-group standard deviation’ and ‘corrected the effect size’ for measurement error.
Hedges and Olkin (1985) have laid the foundation for estimating the ‘g’ effect size: Modified Glass statistic with pooled 1 sample standard deviation:
![]()
and correcting its sample bias to obtain the unbiased estimator 2‘d’ by:
Note: By convention the subtraction of the means (M) of the 2 groups (experimental and control), is done so that the difference is ‘positive’ if it is in the direction of improvement or in the predicted direction a nd ‘negative’ if in the direction of deterioration or opposite to the predicted direction.
Step 4: Searching for Relevant Studies – As the outcome of the MA is dependent and based on the quality and success of an assiduous search for potential studies, possible search directions are as follows: computer search engines (define relevant languages); Reference Lists from studies; Letters/ emails to journals and researchers in this field of study to include follow-up requests for missing data; Libraries – based on the electronic findings, physical visits to libraries for review and copying of full-text studies.
Step 5: Study Database and Selection of Final Set of Relevant Studies – all studies should be compiled into a ‘Master Data Base’( MDB) within an electronic spreadsheet (after being assigned a unique ‘I.D. Number’), allowing for convenient repetitive sorting and extracting of data, and later on for transferring data to supporting statistical compatible software packages. The final set of studies, will be selected from those studies that meet all the inclusion criteria.
Step 6: Data Extraction and Coding – All studies should be reviewed for relevant information and note-worthy characteristics (that might be related to the effect size), pertaining to the study. This should be done by more than one researcher, and findings should be then compared between them and discrepancies cleared out.
Step 7: Determining the Individual and Overall Effect Sizes Across Studies – (a) Individual effect sizes ‘d’ or ‘g’ need to be expressed in a standardized format to allow for comparison between studies, and (b) overall effect size ‘d+’. Once all effect sizes of the individual studies are acquired, the overall pooled mean effect size estimate ‘d+’3 is calculated by utilizing a statistical computing software program (Shachar, 2002) – StatsDirect LTD (2002), using direct weights defined as the inverse of the variance of ‘d’ for each study/ stratum, and providing a confidence interval for ‘d+’ with a chi-square statistic and with the probability of this pooled effect size being equal to zero (Hedges & Olkin, 1985). Note: the researcher must decide on whether to use the ‘fixed effects’ model or the ‘random effects’ model, which differ in the way the variability of the results between the studies is treated.
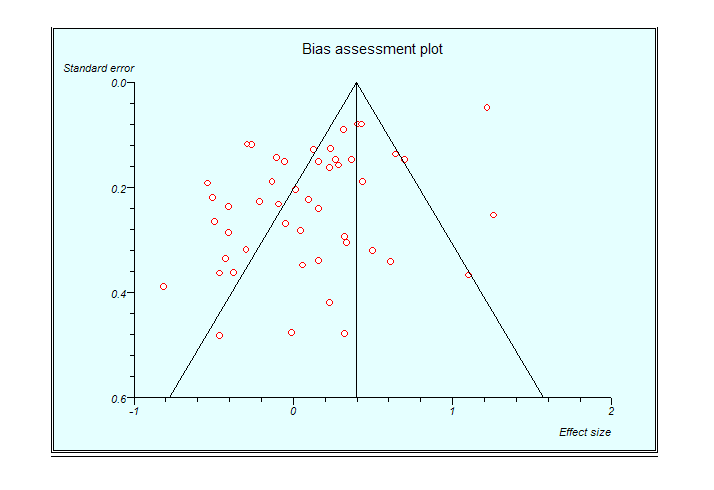
Step 8: Homogeneity and Bias Analyses – As a synthesis of a variety of studies and data is conducted, each with its own method of calculation, it is necessary to examine the robustness of the findings to different assumptions by conducting three Homogeneityand Bias analyses: (1) Homogeneity. The individual trials will show chance variation in their results, therefore, it is necessary to explore whether the differences were larger than those expected by chance alone. (2) Bias. One of the main concerns in conducting meta-analysis is that there would be a publication bias arising when trials with statistically significant results are more likely to be published and cited, and are preferentially published in English language journals (Jüni, Holenstein, Sterne, Bartlett, & Egger, 2001). The outcome of which would be that plots of trials’ variability or sample size against effect size, and which would be usually skewed and asymmetrical in the presence of publication bias and other biases (Sterne & Egger, 2001), and are more likely to affect small trials. Detection of bias is done by the examination of the left-right symmetry of the plot (where asymmetrical plots denote small sample bias). For illustration purposes, see example in Figure 1. (3) Fail-Safe-N. Since only published studies are analyzed, there is the “ file drawer problem,” that is, how many studies that did not find significant effects have not been published? If those studies in the file drawer had been published, then the effect sizes for those treatments would be smaller. The researcher therefore needs to calculate the Fail-Safe-N based on Orwin’s (1983) formula.
Figure 1. Bias Assessment Plot (Illustration)
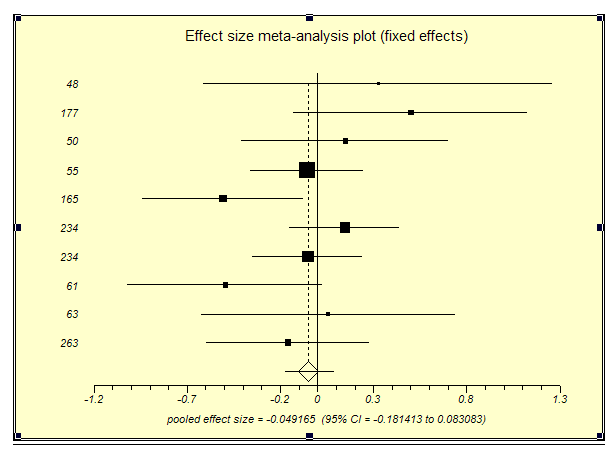
Step 9: Presenting the Results – An overall effect size (d+) calculated from a very large sample is likely to be more accurate than one calculated from a small sample. This margin for error can be quantified using the idea of a 95% confidence interval (CI) which is further explained in the end notes 4. As meta-analysis results are better understood when displayed graphically, the effect sizes with their 95% CI are presented using a Forest Plot (Egger et al. 1997), or by presenting the results in a histogram of the ‘g’ effect size distribution. Figure 2 depicts a Forest Plot where: each horizontal line represents the confidence interval of an effect estimate ‘d’; the effect estimate ‘d’ is marked with a solid black square (the size of the square represents the Mantel-Haenzsel weight that the corresponding study exerts in the meta-analysis); and the pooled estimate ‘d+’ is marked with an unfilled diamond that has an ascending dotted line from its upper point.
Confidence Interval (CI) – Whenever we estimate a parameter we need to know the distribution of said estimator, so, in addition to providing a point estimate of the parameter, we wish to obtain a confidence interval. The definition of a 95% Confidence Interval (95% CI) is: if the procedure for computing a 95% confidence interval is used over and over, 95% of the time the interval will contain the true parameter value, in our case the parameter of interest is the effect size. Hedges and Olkin (1985) provide several methods for computing the exact (when Ne+Nc<20) and approximate (when Ne+Nc is moderate to large) CI respectively. In a nutshell: (a) the large sample distribution of ‘ d’ tends to normality, and the asymptotic distribution of ‘ d’ is normal with a mean corresponding to the population ES. This allows us to use it to ob tain an excellent large sample approximation to the distribution of ‘ d’. A 100(1-alfa) – percent confidence interval for the ES is given by: ‘ d’ plus/ minus the two-tailed critical value of the standard normal distribution. (b) when we have small sample sizes, the calculation is based on the exact distribution of the effect size estimator ‘g’, and utilizing the non-central t-distribution. It is recommended to review the statistical package used, for its choice of the CI calculating method.
Figure 2. Effect Size Meta-Analysis – Forest Plot (Illustration)
Step 10: The Qualitative Interpretation of Effect Size (d+) – Interpreting the results of a meta-analysis requires the understanding of the standards employed that allow for meaningful interpretation of effect sizes. The statistical community is not of one voice in regard to the interpretation of the effect sizes and although judgments about whether a specific effect size is large or small are ultimately arbitrary, some guidelines for standards do exist in the literature, to assess the meaningfulness of an effect size on one hand, and for conventional measures on the other. For example, Cohen (1977) suggested 0.2, 0.5, and 0.8 as minimal, moderate, and meaningful effect respectively; Lipsey (1990) categorized effect sizes into three groups: Small<0.32; 0.33<Medium<0.55; and Large>0.56.
Meta-Analysis: Limitations
A meta-analysis is not a panacea and/ or a perfect solution to all research studies. There are many within the professional statistical community who question its suitability and validity by using buzz-words like “you are comparing apples to oranges,” and that the heterogeneity of studies does not allow for true comparisons.
The answer to this is two-fold. First, on the professional statistical side, there have been countless papers addressing these “flaws,” providing proof that if and when a meta-analysis is conducted correctly, and appropriate ‘corrections’ are implemented for various possible biases, the results are valid and reliable. Second - even if we do accept some scientific criticism, on the practical side, there is no other better method available to synthesize numerous studies.
Discussion
Standardization in Research Reports
Many of the researchers collecting, reviewing, and extracting data from previous research studies have regrettably noted that many of said studies suffer from flaws in their research design and/ or their representation (or lack of) of complete statistical findings. Furthermore, many meta-analyses overlap in the periods they cover and the studies they include/ exclude from their data bases (see Table 1). Should present researchers fully make available their databases and statistical findings to the scientific community, future researchers may and could be able to extract data for their respective meta-analyses analyzing every possible variable of interest.
As one sparrow, does not denote the coming of spring, so do the individual studies not suffice to form an answer regarding the effectiveness of DE. Thus, meta-analysis provides a comprehensive answer to the DE versus traditional education continuing conundrum, by analyzing and synthesizing a wide body of academic comparative studies.
The need is for research that guides practitioners in refining practice so the most effective methods are used. Given sufficient quantity and detail in the data, meta-analysis is capable of not only comparing the effectiveness of distance education programs to classroom-based programs, but it can compare features of various distance education programs to learn what works. For example: Various levels of education (i.e., high school, college, and university), so as to observe ‘best fit’; the trend of DE versus F2F across time; various topics/ subjects of study, so as to observe differences between students enrolled in humanities, science or business courses; and other learning factors, such as satisfaction, evaluation of instruction and attitudes.
In the words of the “master” himself Glass (2000) on the 25th anniversary of the development of his meta-analysis method: “Meta-analysis was created out of the need to extract useful information from the cryptic records of inferential data analyses in the abbreviated reports of research in journals and other printed sources . . . Meta-analysis needs to be replaced by archives of raw data that permit the construction of complex data landscapes that depict the relationships among independent, dependent and mediating variables . . . We can move toward this vision of useful synthesized archives of research now if we simply re-orient our ideas about what we are doing when we do research. We are not testing grand theories . . . rather we are sharing data collected and reported according to some commonly accepted protocols. We aren't publishing 'studies,' rather we are contributing to data archives” (p. 17).
Who better than an Online Internet-based journal, such as IRRODL, should be the leading force to create and develop such a database and become the source of knowledge-sharing.
As meta-analysis is a unique and powerful tool that can provide for these educational contributions, it is therefore strongly implied, that the educational community, adopt meta-analysis, subject to strict adherence of its procedures, as a sound alternative approach to wide scope research, bearing in mind of course, Green and Hall’s (1984) dictum: “Data analysis is an aid to thought, not a substitute.”
Conclusions
Meta-analysis, if and only if executed rigorously as detailed above, is a powerful concept and tool, carrying advantages and benefits to the individual researcher and the scientific community in addressing DE related research questions.
To name a few: (a) we transcend above and beyond the individual study by examining and synthesizing multiple comparison (experimental and control group) studies that, in turn, establish a sound base for generalizing findings; (b) we focus on effect sizes (not on p values), i.e., the magnitude of the treatment standardized across all studies; and (c) each study receives its fair weight within the overall ‘d+’ effect size.
By encouraging independent researchers to provide and publish their respective statistical data and findings, we can create a vast pool of common knowledge that will lay the foundation for researchers implementing meta-analytical methods, to see the big distance education picture.
References
Allen, M., Bourhis, J., Burrell, N., & Mabry, E. (2002). Comparing student satisfaction with distance education to traditional classrooms in higher education: A metaanalysis. American Journal of Distance Education, 16(2), 83-97.
Bangert-Drowns, R. L., & Rudner, L. M. (1991). Meta-Analysis in Educational Research. ERIC Digest. ED339748.
Becker, L. A. (1998). Meta-analysis. http://web.uccs.edu/lbecker/Psy590/es.htm
Berge, Z. L., & Mrozowski, S. (2001). Review of research in distance education, 1990 to 1999. American Journal of Distance Education, 15(3), 15-19.
Bernard, R. M., Abrami, P. C., Lou, Y., Borokhovski, E., Wade, A., Wozney, et al. (2004). How does distance education compare with classroom instruction? A meta-analysis of the empirical literature. Review of Educational Research, 74(3) 379-439
Buchan, I. E. (2000). The development of a statistical computer software resource for medical research. Unpublished Doctorate Thesis. University of Liverpool: Liverpool, England.
Cavanaugh, C. S. (2001). The effectiveness of interactive distance education technologies in IK-12 learning: A meta-analysis. International Journal of Educational Telecommunications, 7, 73-88.
Cavanaugh, C. S. (2001). The effectiveness of interactive distance education technologies in K-12 learning: A meta-analysis. International Journal of Educational Telecommunications, 7(1), 73-88.
Cavanaugh, C., Gillan, K. J., Kromrey, J., Hess, M., & Blomeyer, R. (2004). The Effects of Distance Education on K–12 Student Outcomes: A Meta-Analysis. Learning Point Associates.
Clark, R. E. (2000). Evaluating distance education: Strategies and cautions. Quarterly Review of Distance Education, 1, 3-16.
Cohen, J. (1977). Statistical Power Analysis for the Behavioral Sciences. New York: Academic Press.
Cook, C., Heath, F., & Thompson, R. (2000). A meta-analysis of response rates in Web-based or Internet-based surveys. Educational and Psychological Measurement, 60(6), 821-836.
De Santis, C. G. (2001). Is online learning really effective? ELearners. http://www.elearners.com/elearning/q2c.asp
Dellana, S., Collins, W., & West, D. (2000). Online education in a management science course – effectiveness and performance factors. Journal of Education for Business 76(1), 43-47.
Egger, M., Smith, D., & Phillips, A. (1997). Meta-analysis Principles and procedures. British Medical Journal, 315, 1533-1537.
Glass, G. V. (2000). Meta-analysis at 25. http://glass.ed.asu.edu/gene/papers/meta25.html
Glass, G. V., McGraw, B., & Smith, M. L. (1981). Meta-analysis in social research. Beverly Hills, CA: Sage Publications.
Glenn, L. M., Jones, C. G., & Hoyt, J. E. (2003). The effect of interaction levels on student performance: A comparative analysis of web-mediated versus traditional delivery. Journal of Interactive Learning Research, 4(3), 285-299
Green, B., & Hall, J. (1984). Quantitative methods for literature review. Annual Review of Psychology. 35, 37-53.
Heberlein, T., & Baumgartner, R. (1978). Factors affecting response rates to mailed questionnaires: A quantitative analysis of the published literature. American Sociological Review, 43, 447-462.
Hedges, L. V., & Olkin, I. (1985). Statistical methods for meta-analysis. London: Academic Press.
Hunter, J. E., & Schmidt, F. L. (1990). Methods of meta-analysis: Correcting error and bias in research findings. Newbury Park, CA: Sage Publications.
Jahng, N., Krug, D., & Zhang, Z. (2007). Student achievement in online distance education compared to face-to-face education. The European Journal of Open and Distance Learning. http://www.eurodl.org/materials/contrib/2007/Jahng_Krug_Zhang.htm
Jung, I., & Rha, I. (2000). Effectiveness and cost-effectiveness of online education: A review of the literature. Educational Technology, 40(4), 57-60.
Jüni, P., Holenstein, F., Sterne, J., Bartlett, C., & Egger, M. (2001). Direction and impact of language bias in meta-analyses of controlled trials: Empirical study. International Journal of Epidemiology 31, 115-123 .
Lemura, L., Von-Duvillard, S., & Mookerjee, S. (2000). The effects of physical training of functional capacity in adults: Ages 46 to 90: A meta-analysis. Journal of Sports Medicine and Physical Fitness, 40(1), 1-10.
Lipsey, M. W. (1990). Design Sensitivity: Statistical Power for Experimental Research. Newbury Park, CA: Sage Publications.
Lockee, B., Burton, J., & Cross, L. (1999). No comparison: Distance education finds a new use for 'no significant difference. Educational Technology, Research and Development 47(3), 33-42.
Machtmes, K., & Asher, J. W. (2000). A meta-analysis of the effectiveness of telecourses in distance education. The American Journal of Distance Education, 14(1), 27-46.
Moore, M., & Thompson, M. (1990). The effects of distance learning: A summary of the literature. ERIC Document Reproduction Service No. ED 391 467.
Niemi, R.G. (1986). Series editor's introduction. In Fredric M. Wolf (Ed.), Meta-analysis: Quantitative methods for research synthesis (pp.4-5). London: Sage Publications.
Orwin, R. G. (1983). A fail safe N for effect size in meta-analysis. Journal for Educational Statistics, 8, 157-159.
Phipps, R., & Merisotis, J. (1999). What’s the Difference? A review of contemporary research on the effectiveness of distance education in higher education. Washington DC: The Institute for Higher Education policy.
Russell, T. (2002). “The No Significant Difference Phenomenon" as reported in 355 research reports, summaries and papers: A comprehensive research bibliography on technology for distance education. WCET: No Significant Difference website. http://www.nosignificantdifference.org/
Saba, F. (2000). Research in distance education: A status report. International Review of Research in Open and Distance Education, 1(1), 1-9. http://www.irrodl.org/index.php/irrodl/article/view/4/337
Schlosser, C. A., & Anderson, M. L. (1994). Distance education: Review of the literature. Washington, DC: Association for Educational Communications and Technology.
Shachar, M. (2002). Differences Between Traditional and Distance Learning Outcomes: A Meta-Analytic Approach. Dissertation. Touro University International.
Sitzmann, T.M., Kraiger, K., Stewart, D. W., & Wisher, R. A. (2006). The Comparative Effectiveness of Web-Based and Classroom Instruction: A Meta-Analysis. Personnel Psychology, 59(3) 623-664.
Smith, P. L., & Dillon, C. L. (1999). Comparing distance learning and classroom learning: Conceptual considerations. American Journal of Distance Education, 13, 107-124.
StatsDirect Ltd. (2002). StatsDirect Ltd. StatsDirect statistical software. http://www.statsdirect.com
Sterne, J., & Egger, M. (2001). Funnel plots for detecting bias in meta-analysis: Guidelines on choice of axis. Journal of Clinical Epidemiology 54, 1046-1055.
Thompson, B. (1996). AERA editorial policies regarding statistical significance testing: Three suggested reforms. Educational Researcher, 25(2), 26-30.
Ungerleider, C., & Burns, T. (2003). A systematic review of the effectiveness and efficiency of networked ICT in education: A state of the art report to the Council of Ministers Canada and Industry Canada. Ottawa: Industry Canada.
Williams, S. L. (2006). The Effectiveness of Distance Education in Allied Health Science Programs: A Meta-Analysis of Outcomes. American Journal of Distance Education, 20(3), 127 – 141.
Yu, C. (2001). Meta-analysis and effect size. Unpublished dissertation. Arizona State University.
Zhao, Y., Lei, J., Yan, B., Lai, C., & Tan, H. S. (2005). What makes the difference? A practical analysis of research on the effectiveness of distance education. Teachers College Record, 107(8),1836–1884.
1The formula for the pooled sample standard deviation is  (Hedges & Olkin, 1985, p. 79).
2Unbiased Estimator – Because g is a sample statistic, it has a sampling distribution. The sampling distribution is closely related to the non-central t-distribution. Hedges and Olkin (1985) computed the correction factor J(m) as a constant tabulated for values of m from 2 to 50. The constant J(m) is less than unity and approaches unity when m is large, and is closely approximated by ![]() . But for all working purposes, the formula
. But for all working purposes, the formula ![]() is most adequate.
is most adequate.
3‘d+’: As the sample sizes of the independent studies we wish to combine differ, then the estimates from the larger studies will be more precise than the estimates of the smaller studies. Hence, it is reasonable to give more weight to the more precise estimates when pooling for ‘d+’. There are many methods for assigning weights, e.g., StatsDirect, 2002 calculates ‘d+’ by using direct weights defined as the inverse of the variance of ‘d’ for each study/ stratum.
4 Confidence Interval (CI) – Whenever we estimate a parameter we need to know the distribution of said estimator, in addition to providing a point estimate of the parameter, we must obtain a confidence interval. The definition of a 95% Confidence Interval (95% CI) is: If the procedure for computing a 95% confidence interval is used over and over, 95% of the time the interval will contain the true parameter value, in our case the parameter of interest is the effect size. Hedges and Olkin (1985 p . 85-91) provide several methods for computing the exact (when Ne+Nc<20) and approximate (when Ne+Nc is moderate to large) CI respectively. In a nutshell: (a) the large sample distribution of ‘ d’ tends to normality, and the asymptotic distribution of ‘ d’ is normal with a mean corresponding to the population ES. This allows us to use it to obtain an excellent large sample approximation to the distribution of ‘ d’ . (a) The 100(1-alfa) – percent confidence interval for the ES is given by: ’d’ plus/ minus the two-tailed critical value of the standard normal distribution. And (b) when we have small sample sizes, the calculation is based on the exact distribution of the effect size estimator ‘g’, and utilizing the non-central t-distribution. It is recommended to review the statistical package used, for its choice of the CI calculating method.