Prepared for the Canadian Radio-television and Telecommunications Commission
POR 068-17
Contract # 82082-180158/001/CY
Produced by Kantar TNS
Contract Award Date: December 22, 2017
Report Date: March 1, 2018
Ce rapport est aussi disponible en français.
communications@crtc.gc.ca
The Wireless Code, which was established in 2013 by the CRTC, is a mandatory code of conduct for wireless service providers and applies to all retail mobile wireless voice and data services provided to individual and small business consumers in Canada. The Wireless Code applied to all wireless contracts as of June 3, 2015.
The CRTC committed to evaluating the effectiveness of the Wireless Code and recently completed a review to assess whether the Wireless Code meets and continues to meet its objectives, which includes ensuring that consumers are empowered to make informed decisions about wireless services. On June 15, 2017, the CRTC announced multiple changes to the Wireless Code, which came into effect on December 1, 2017.
The information collected in the 2018 Wireless Code public opinion research (POR) will help the CRTC assess whether Canadians are satisfied with the changes and whether further changes are required to ensure the objectives of the Wireless Code continue to be met. Additionally, the 2018 Wireless Code POR continues to monitor trends related to the perceptions of the CRTC and has added a number of questions related to Canadians’ understanding and satisfaction with the new Television Service Provider (TVSP) Code, which came into effect on September 1, 2017.
The methodology was designed to ensure consistency with previous iterations of Wireless Code PORs conducted in the Fall and Spring of 2016.
This POR was designed to address the following objectives:
Wireless Data Usage
The composition of wireless plans has remained stable when compared to the Fall 2016 results. More specifically, wireless plans that include data continue to be common in Canada (76%). The majority of wireless plans have limited data (85%), which results in most Canadians (94% compared to 91% in Fall 2016) attempting to manage their data so as not to incur additional costs.
Canadians report finding it easy to manage their data (77%) and use tools to track their usage (59%). Despite this, a considerable portion (49%) of wireless owners report having paid data overages in the last 12 months, suggesting that data management may in fact be harder than anticipated for many Canadians.
Bill shock and Roaming fees
Almost a quarter of Canadians (24%) continue to experience bill shock suggesting that there continues to be room for improvement in this area moving forward. This is a slight, although not statistically significant increase, from Fall 2016 (21%). Some Canadians continue to struggle to track how much data they use, to understand the cost of international roaming and to understand the cost of long distance calling.
Younger Canadians (18-54) continue to be more likely to experience bill shock compared to those who are 55 years of age or older (21-63% vs. 15%), as are those with tab contracts (29% vs. 21%), and not unexpectedly, those who find data management difficult (62% vs. 19%).
The amount of unexpected charges varies greatly – from less than $50 to over $1 000 in one billing cycle. Most of the unexpected charges continue to be $100 or less (61%).
Almost one in every five Canadians (17%) finds it quite difficult to manage roaming fees while travelling. Men find managing roaming fees easier to manage than women (56% vs. 48%), as well as those with a higher income (68% vs. 39-53%).
Understanding of Contracts
A majority of Canadians (61%) find their contracts clear and easy to understand. This is truer for those aged 18-34 when compared to older Canadians (74% vs. 55-56%). Unlimited data contracts seem to be easier to understand (70% vs. 42%) for many Canadians and those who find data management easy also find their contracts easier to understand (70% vs. 42%).
The newly instated trial period explanation is somewhat unclear to many Canadians. It was found clear and easy to understand by only one in three Canadians (36%). There is also some indication that the trial period may be more confusing for those with a higher education. Those with higher education levels are more likely to find the explanation unclear or difficult to understand compared to those with lower education levels (44% vs. 31%). A more thorough investigation into this would be required.
Some Canadians are also having some challenges related to the explanation of cancellation fees. One in four Canadians find the explanation unclear. Interestingly, the data also shows that Canadians with higher educations are more likely to find the cancellation fee explanation unclear (32% vs. 18%) which raises a red flag as to how well this clause is really understood.
Changes
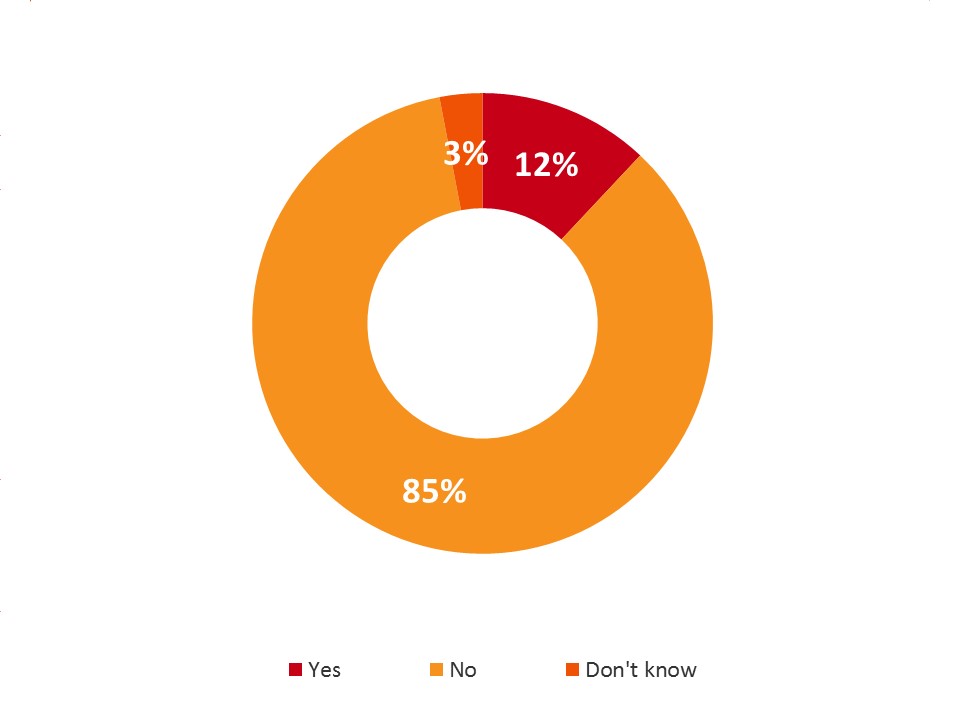
When it comes to changes to contracts, a small number of wireless owners report changes being made to their contracts without prior notification (12%).
A small number of Canadians (16%) have switched service providers in the last two years with the main reason being a better deal (49%).
Complaints
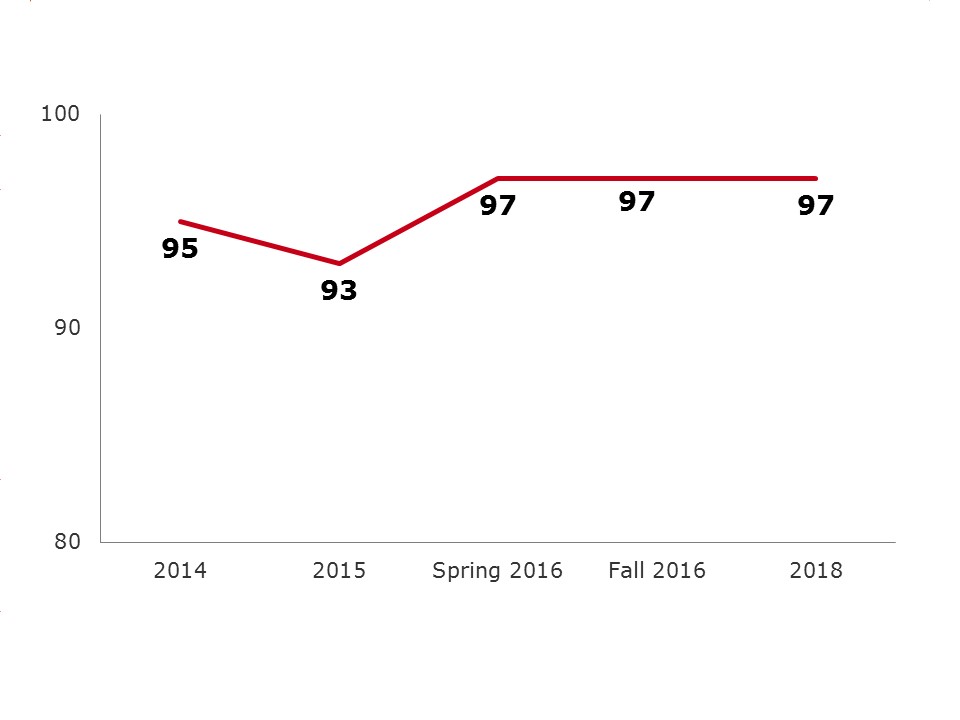
Canadians are making fewer complaints than in the past suggesting the Wireless Code is having a positive impact for wireless consumers. Eighteen per cent of Canadians have made a complaint in the last year resulting in a decrease of eight per cent since 2014. The reasons for complaints are changing with only one of the previous four main reasons now being mentioned (compared to Fall 2016) – previous main reasons for complaints comparing Fall 2016 with 2018 results, were incorrect charges on their bill (45% vs. 17%), inadequate quality of service (25% vs. 16%) and misleading information about the terms of contract (23% vs. 12%). In 2018 data charges seem to be the biggest thorn in consumers’ sides (29%), which was the fourth highest reason for complaining in Fall 2016 (32%). Consumers continue to primarily complain to their service providers (97%) with 5% of these complaints also going to the Commissioner for Complaints for Telecommunications Services (Canada) (CCTS). The CCTS responds to complaints from consumers if the consumer believes the complaint remains unresolved by the service provider.
Demographic Differences
A number of additional demographic analyses were also undertaken including age, gender, education, income and language. The most significant differences were related to age and education.
Age:
Canadians aged 18-54 are substantially different than their older counterparts (55+) in a number of ways:
Education:
Canadians with a higher level of education (university degree or higher) have slightly different outcomes compared to those with lower levels of education. More specifically:
Television Service Provider Code
Due to the relatively recent introduction of the Television Service Provider (TVSP) Code, it is not surprising that only half of Canadians have heard of the TVSP Code (56%). It is however, surprising that only half of TV subscribers (54%) believe they have been informed of their entry-level service offering, especially given the requirement that all customers should have been informed.
At an overall level many Canadians find their TV contracts clear and easy to understand (57%) and only 14% have experienced difficulties related to TV service calls. TV subscribers are usually informed of price changes (76%) and only one in four consumers have made a complaint about their TV service in the last 12 months.
CRTC
Over the past five years, Canadians’ understanding of the mandate and role of the CRTC has declined. In 2014, 38 per cent of Canadians considered themselves informed about the mandate and role of the CRTC while in 2018, only 29 per cent consider themselves informed.
Overall Canadians’ impressions of the CRTC continue to be more neutral in 2018 than they were in 2014. However, it is necessary to take into consideration that only one in three Canadians report being well informed of the CRTC’s role which implies that two in three consumers’ impressions of the CRTC are based on very little to no knowledge. In fact, when looking at the opinions of those who consider themselves very well or well informed about the CRTC’s role, 50-55% are positive about the CRTC. This implies that there is still work to be done to not only inform the public of the CRTC and its role, but also to address public perceptions.
Strategic implications
The results of this research provide evidence that suggests the Wireless Code continues to have positive impacts on Canadians[1]. It also provides information to be considered for future updates of the Wireless Code and/or the Television Service Provider Code.
The methodology was designed to ensure consistency with previous waves of Wireless Code surveys conducted by TNS in the Fall and Spring of 2016. A telephone survey was conducted among 1,345 Canadians age 18 years and older; 1,152 with those who have their own wireless plan and 193 with those who do not have a wireless plan. The sample was split into two distinct segments: Canadians who currently have a personal wireless plan covering services such as voice, text and data and Canadians who do not currently have a personal wireless plan. Interviews were conducted using random landline telephone sampling sources. Only landline phones were targeted for this survey as results from previous research indicate there are no discernible differences of opinions based on landline versus cell phone respondents.
Included within the sample are 1,034 Canadians that are under contract with TV service providers.
A pre-test consisting of 10 completed English interviews and 10 completed French interviews was completed before fielding the survey on January 25th, 2018. The survey was in field from January 26th to February 8th, 2018. The sample for this study was a probability sample and as such the findings can be extrapolated to the Canadian population with a margin of error of +/3 per cent, 19 times out of 20.
The total contract value for this project was $79,903.66 including HST.
I hereby certify as a Representative of Kantar TNS that the deliverables fully comply with the Government of Canada political neutrality requirements outlined in the Communications Policy of the Government of Canada and Procedures for Planning and Contracting Public Opinion Research. Specifically, the deliverables do not include information on electoral voting intentions, political party preferences, standings with the electorate or ratings of the performance of apolitical party or its leaders.
Tanya Whitehead
Kantar TNS
Senior Research Director & Public-Sector Practice Lead
The Wireless Code, which was established in 2013 by the CRTC, is a mandatory code of conduct for wireless service providers and serves two primary goals: to ensure consumers are empowered to make informed decisions about wireless services; and to make it easier for consumers to take advantage of competitive offers. The Wireless Code includes provisions that address clarity; contracts and related documents; changes to contracts; bill management; mobile device issues; and cancellation.
The Wireless Code started to apply to new contracts as of December 2013 and applied to all contracts for retail mobile wireless voice and data services (wireless services) provided to individual and small business consumers in Canada as of June 3, 2015.
The CRTC committed to evaluating the effectiveness of the Wireless Code and recently completed a review to assess whether the Wireless Code has met and continues to meet its objectives, which includes ensuring that consumers are empowered to make informed decisions about wireless services.
On June 15, 2017, the CRTC announced multiple changes to the Wireless Code, which came into effect on December 1 2017 for all contracts.
The information collected in the 2018 Wireless Code public opinion research (POR) will help the CRTC assess whether Canadians are satisfied with the changes and whether further changes are required to ensure the objectives of the Wireless Code continue to be met.
Additionally, the 2018 Wireless Code POR continues to monitor trends related to the perceptions of the CRTC and has added a number of questions related to Canadians’ understanding and satisfaction with the new Television Service Provider (TVSP) Code, which came into effect on September 1st, 2017.
The overall objective of this research was to obtain tracking data on how consumers understand their wireless service contracts and their related rights as well as to further explore a variety of topics such as wireless complaints, data usage, bill shock, and ease of switching service providers.
The methodology was designed to ensure consistency with previous waves of Wireless Code surveys conducted in the Fall and Spring of 2016. This iteration of the research also explores Canadians’ satisfaction with the June 15th changes to the Wireless Code, general satisfaction with the CRTC and a number of issues related to the new TVSP Code.
More specifically, the survey was designed to address the following objectives:
For tracking purposes and comparability over time, some questions remained the same or similar to the ones used for the Wireless Code POR published in the Spring and Fall of 2016. To keep the survey no longer than 15 minutes, questions not needed for tracking purposes were removed and several new questions were added to the survey to obtain the additional informational requirements.
A telephone survey was conducted among 1,345 Canadians aged 18 years and older; 1,152 with those who have their own wireless plan and 193 with those who do not have a wireless plan. Interviews were conducted using random landline telephone sampling sources. A pre-test consisting of 10 completed English interviews and 10 completed French interviews was done before fielding the survey on January 25th, 2018. The survey was in field from January 26th to February 8th, 2018. The sample for this study was a probability sample and as such the findings can be extrapolated to the Canadian population with a margin of error of +/-3 per cent, 19 times out of 20. A detailed methodology can be found in Chapter 5.
Please note: Analysis was undertaken to establish the extent of the relationship among variables such as gender, age, region, level of education attained, language spoken, household income, type of plan (family vs. individual; prepaid vs, postpaid; employee; subsidized phone/device; limited vs. unlimited data), complaints and bill shock. Only differences significant at the 95% confidence level are presented in this report. Any differences that are statistically significant between subgroups are indicated with an uppercase letter to refer to the applicable column.
The numbers presented throughout this report are rounded to the closest full number. Due to this rounding, in some cases it may appear that ratings collapsed together are different by a percentage point from when they are presented individually, and totals may not add up to 100%. Also, the data for 2014 and 2015 was taken directly from the 2014 and 2015 Wireless Code Public Opinion Research reports. TNS has incorporated these results as well as results from Spring and Fall 2016 into the 2018 report for year-over-year comparison where possible.
Wireless Data Usage
The composition of wireless plans has remained stable when compared to the Fall 2016 results. More specifically, wireless plans that include data continue to be common in Canada (76%). The majority of wireless plans have limited data (85%), which results in most Canadians (94% compared to 91% in Fall 2016) attempting to manage their data so as not to incur additional costs.
Canadians report finding it easy to manage their data (77%) and use tools to track their usage (59%). Despite this, a considerable portion (49%) of wireless owners report having paid data overages in the last 12 months, suggesting that data management may in fact be harder than anticipated for many Canadians.
Bill shock and Roaming fees
Almost a quarter of Canadians (24%) continue to experience bill shock suggesting that there continues to be room for improvement in this area moving forward. This is a slight, although not statistically significant increase, from Fall 2016 (21%). Some Canadians continue to struggle to track how much data they use, to understand the cost of international roaming and to understand the cost of long distance calling.
Younger Canadians (18-54) continue to be more likely to experience bill shock compared to those who are 55 years of age or older (21-63% vs. 15%), as are those with tab contracts (29% vs. 21%), and not unexpectedly, those who find data management difficult (62% vs. 19%).
The amount of unexpected charges varies greatly – from less than $50 to over $1 000 in one billing cycle. Most of the unexpected charges continue to be $100 or less (61%).
Almost one in every five Canadians (17%) finds it quite difficult to manage roaming fees while travelling. Men find managing roaming fees easier to manage than women (56% vs. 48%), as well as those with a higher income (68% vs. 39-53%).
Understanding of Contracts
A majority of Canadians (61%) find their contracts clear and easy to understand. This is truer for those aged 18-34 when compared to older Canadians (74% vs. 55-56%). Unlimited data contracts seem to be easier to understand (70% vs. 42%) for many Canadians and those who find data management easy also find their contracts easier to understand (70% vs. 42%).
The newly instated trial period explanation is somewhat unclear to many Canadians. It was found clear and easy to understand by only one in three Canadians (36%). There is also some indication that the trial period may be more confusing for those with a higher education. Those with higher education levels are more likely to find the explanation unclear or difficult to understand compared to those with lower education levels (44% vs. 31%)). A more thorough investigation into this would be required.
Some Canadians are also having some challenges related to the explanation of cancellation fees. One in four Canadians find the explanation unclear. Interestingly, the data also shows that Canadians with higher educations are more likely to find the cancellation fee explanation unclear (32% vs. 18%) which raises a red flag as to how well this clause is really understood.
Changes
When it comes to changes to contracts, a small number of wireless owners report changes being made to their contracts without prior notification (12%).
A small number of Canadians (16%) have switched service providers in the last two years with the main reason being a better deal (49%).
Complaints
Canadians are making fewer complaints than in the past suggesting the Wireless Code is having a positive impact for wireless consumers. Eighteen per cent of Canadians have made a complaint in the last year resulting in a decrease of eight per cent since 2014. The reasons for complaints are changing with only one of the previous four main reasons now being mentioned (compared to Fall 2016) – previous main reasons for complaints comparing Fall 2016 with 2018 results, were incorrect charges on their bill (45% vs. 17%), inadequate quality of service (25% vs. 16%) and misleading information about the terms of contract (23% vs. 12%). In 2018 data charges seem to be the biggest thorn in consumers’ sides (29%), which was the fourth highest reason for complaining in Fall 2016 (32%). Consumers continue to primarily complain to their service providers (97%) with 5% of these complaints also going to the Commissioner for Complaints for Telecommunications Services (Canada) (CCTS). The CCTS responds to complaints from consumers if the consumer believes the complaint remains unresolved by the service provider.
Demographic Differences
A number of additional demographic analyses were also undertaken including age, gender, education, income and language. The most significant differences were related to age and education.
Age:
Canadians aged 18-54 are substantially different than their older counterparts (55+) in a number of ways:
Education:
Canadians with a higher level of education (university degree or higher) have slightly different outcomes compared to those with lower levels of education. More specifically:
Television Service Provider Code
Due to the relatively recent introduction of the Television Service Provider (TVSP) Code, it is not surprising that only half of Canadians have heard of the TVSP Code (56%). It is however, surprising that only half of TV subscribers (54%) believe they have been informed of their entry-level service offering, especially given the requirement that all customers should have been informed.
At an overall level many Canadians find their TV contracts clear and easy to understand (57%) and only 14% have experienced difficulties related to TV service calls. TV subscribers are usually informed of price changes (76%) and only one in four consumers have made a complaint about their TV service in the last 12 months.
CRTC
Over the past five years, Canadians’ understanding of the mandate and role of the CRTC has declined. In 2014, 38 per cent of Canadians considered themselves informed about the mandate and role of the CRTC while in 2018, only 29 per cent consider themselves informed.
Overall Canadians’ impressions of the CRTC continue to be neutral in 2018 than they were in 2014. However, it is necessary to take into consideration that only one in three Canadians report being well informed of the CRTC’s role which implies that two in three consumers’ impressions of the CRTC are based on very little to no knowledge. In fact, when looking at the opinions of those who consider themselves very well or well informed about the CRTC’s role, 50-55% are positive about the CRTC. This implies that there is still work to be done to not only inform the public of the CRTC and their role, but also to address public perceptions.
Strategic implications
The results of this research provide evidence that suggests the Wireless Code continues to have positive impacts on Canadians[2]. It also provides information to be considered for future updates of the Wireless Code and/or the Television Service Provider Code.
The Wireless Code came into effect in 2013 and was updated in 2017. As a result, the Wireless Code now ensures that customers will be provided with unlocked devices, gives families more control over data overages, sets minimum usage limits for the trial period that correspond to at least half of the monthly usage limits of the customer’s plan, and clarifies that data is a key contract term that cannot be changed during the commitment period without the customer’s consent.
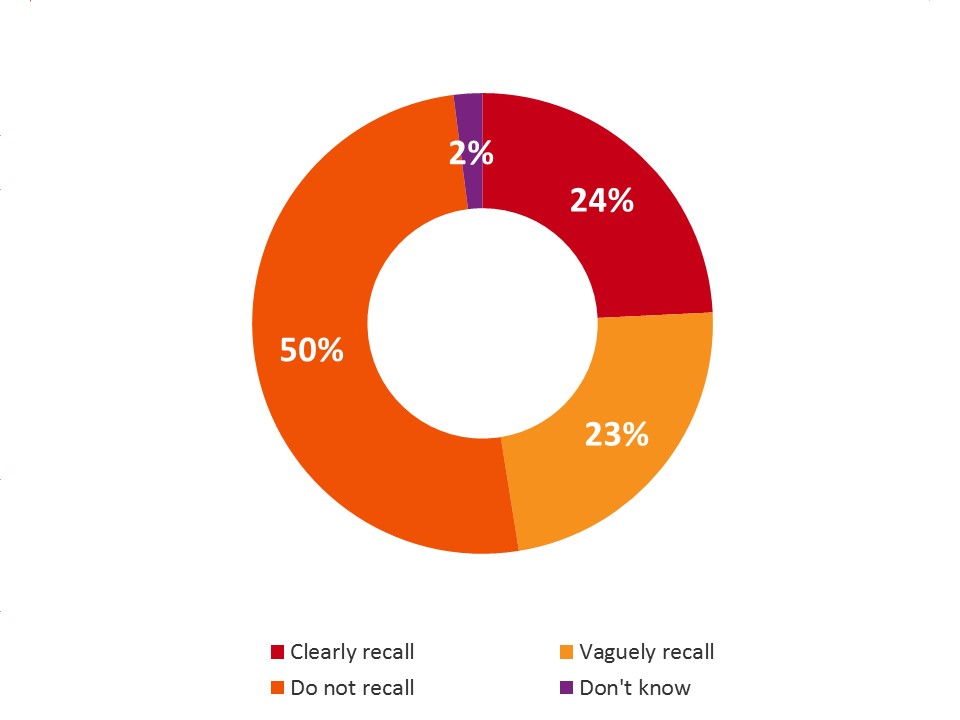
Despite the Wireless Code being in effect for nearly 5 years, half of Canadians (50%) do not recall hearing or seeing anything about it. There is higher awareness of the Wireless Code among those with a higher education level (clear recall 24-31% for College or University graduates vs. 12% for those with no tertiary education) as well as those with a higher income (clear recall 29-39% for those who earn more than $60k per year vs. 12-14% for those with an income of less than $60k per year).
Exhibit 4.1.a Recall of the Wireless Code
Recall of the Wireless Code - text version
WC1. In 2013 a Wireless Code came into effect establishing guidelines for wireless service providers. The Code ensures that wireless consumers are empowered to make informed decisions and that there is a more competitive wireless marketplace. The Code was updated in 2017 to end unlocking fees and offer longer trial periods for new contracts. To what extent, if any would you say you recall hearing or seeing anything about this Code? Would you say you clearly recall, vaguely recall or do not recall?
Base: Total respondents (n=1,345)
Exhibit 4.1.b Recall of the Wireless Code by education and income
Data included in wireless plan |
Total (A) |
Income | Education | ||||||
|---|---|---|---|---|---|---|---|---|---|
| <$40K (E) |
$40K- <$60K (F) |
$60K- <$100K (G) |
$100K- <$150K (H) |
$150K+ (I) |
High school or less (P) |
College (Q) |
University or more (R) |
||
| Base=actual | (1,345) % |
(286) % |
(210) % |
(296) % |
(183) % |
(154) % |
(382) % |
(366) % |
(576) % |
| Clearly Recall | 24 | 12 | 14 | 30 EF | 29 EF | 39 EF | 12 | 24 P | 31 P |
| Vaguely Recall | 23 | 17 | 21 | 28 E | 24 | 26 | 18 | 25 | 25 |
| Do not recall | 50 | 66 GHI | 60 GHI | 41 | 46 | 33 | 67 QR | 50 R | 41 |
| Don’t know | 2 | 4 | 5 | 1 | 1 | 1 | 3 | 1 | 3 |
QWC1. In 2013 a Wireless Code came into effect establishing guidelines for wireless service providers. The Code ensures that wireless consumers are empowered to make informed decisions and that there is a more competitive wireless marketplace. The Code was updated in 2017 to end unlocking fees and offer longer trial periods for new contracts. To what extent, if any would you say you recall hearing or seeing anything about this Code? Would you say you clearly recall, vaguely recall or do not recall?
Note: Letters denote statistically significant difference. For example, if there is a B then the result is significantly higher than the corresponding result in column B.
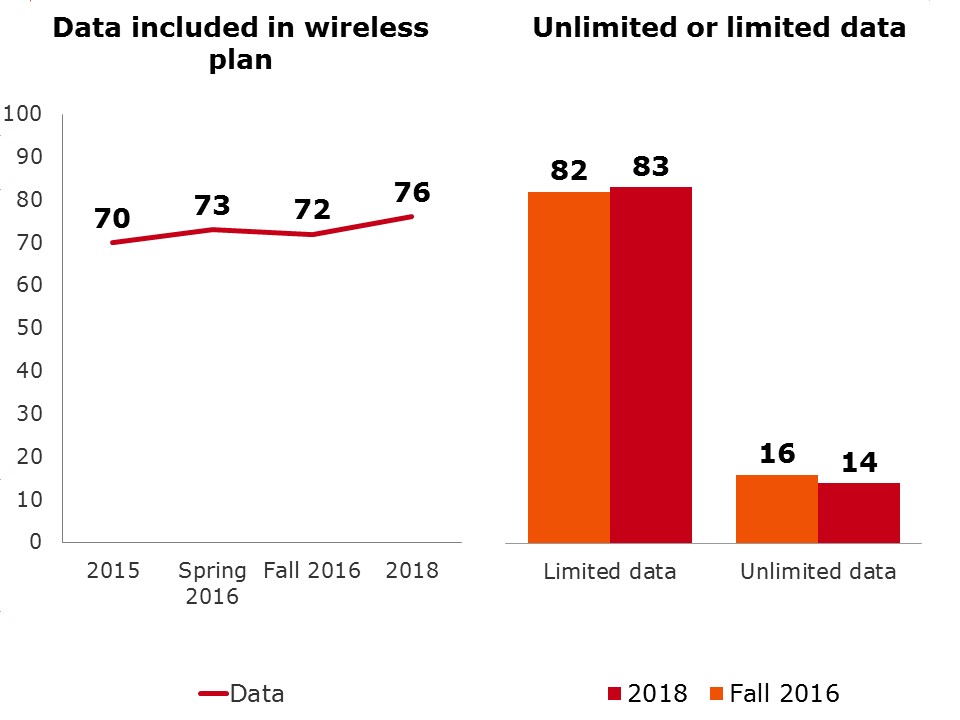
Wireless plans that include data continue to be increasingly common in Canada. Now more than three quarters of Canadians (76% compared to 72% in Fall of 2016) have wireless plans that include data. The clear majority still have limited data (83%) while a small but significant proportion have unlimited wireless data (14%).
Exhibit 4.2.a. Data included in wireless plan over time and limited or unlimited plans
Data included in wireless plan over time and limited or unlimited plans - text version
QB2a. Which of the following are included in your wireless plan?
Base: Respondents who own a cell phone, fall 2016 (n=1,277), 2018 (n=1,111)
QB9c3. Is Data included as part of your plan?
Base: Total Respondents Spring 2016 (n=925), 2015 (n=1,005)
QB4. Does your plan include unlimited or limited data?
Base: Respondents who have data included in the wireless plan, fall 2016 (n=831), 2018 (n=796)
A variety of demographic factors continue to influence whether or not Canadians have wireless plans that include data:
Exhibit 4.2.b. Data included in wireless plan by age and region
| Data included in wireless plan | Total (A) |
Age | Region | |||||||
|---|---|---|---|---|---|---|---|---|---|---|
| 18-34 (D) |
35-54 (E) |
55+ (F) |
Atl (G) |
Que (H) |
Ont (I) |
Pra (J) |
BC (K) |
Terr (O) |
||
| Base=actual | (1,111) % |
(141) % |
(359) % |
(594) % |
(102) % |
(224) % |
(301) % |
(310) % |
(126) % |
(48) % |
| Yes | 76 | 83 F | 87 F | 60 | 70 | 71 | 75 | 81 GH | 79 | 90 GH |
QB2a. Which of the following are included in your wireless plan?
Note: Letters denote statistically significant difference. For example, if there is a B then the result is significantly higher than the corresponding result in column B.
Exhibit 4.2.c. Data included in wireless plan by income and education
| Data included in wireless plan | Total (A) |
Income | Education | ||||||
|---|---|---|---|---|---|---|---|---|---|
| <$40K (E) |
$40K- <$60K (F) |
$60K- <$100K (G) |
$100K- <$150K (H) |
$150K+ (I) |
High school or less (P) |
College (Q) |
University or more (R) |
||
| Base=actual | (1,111) % |
(199) % |
(168) % |
(261) % |
(163) % |
(141) % |
(278) % |
(314) % |
(501) % |
| Yes | 76 | 61 | 73 | 75 E | 92 EFG | 95 EFG | 65 | 78 P | 81 P |
QB2a. Which of the following are included in your wireless plan?
Note: Letters denote statistically significant difference. For example, if there is a B then the result is significantly higher than the corresponding result in column B.
Exhibit 4.2.d. Data included in wireless plan by language and tab contract
Data included in wireless plan |
Total (A) |
Language | Tab contracts | |||
|---|---|---|---|---|---|---|
| English (B) |
French (C) |
Other (D) |
Yes (E) |
No (F) |
||
| Base=actual | (1,111) % |
(741) % |
(219) % |
(144) % |
(293) % |
(744) % |
| Yes | 76 | 78 C | 69 | 77 | 88 F | 71 |
QB2a. Which of the following are included in your wireless plan?
Note: Letters denote statistically significant difference. For example, if there is a B then the result is significantly higher than the corresponding result in column B.
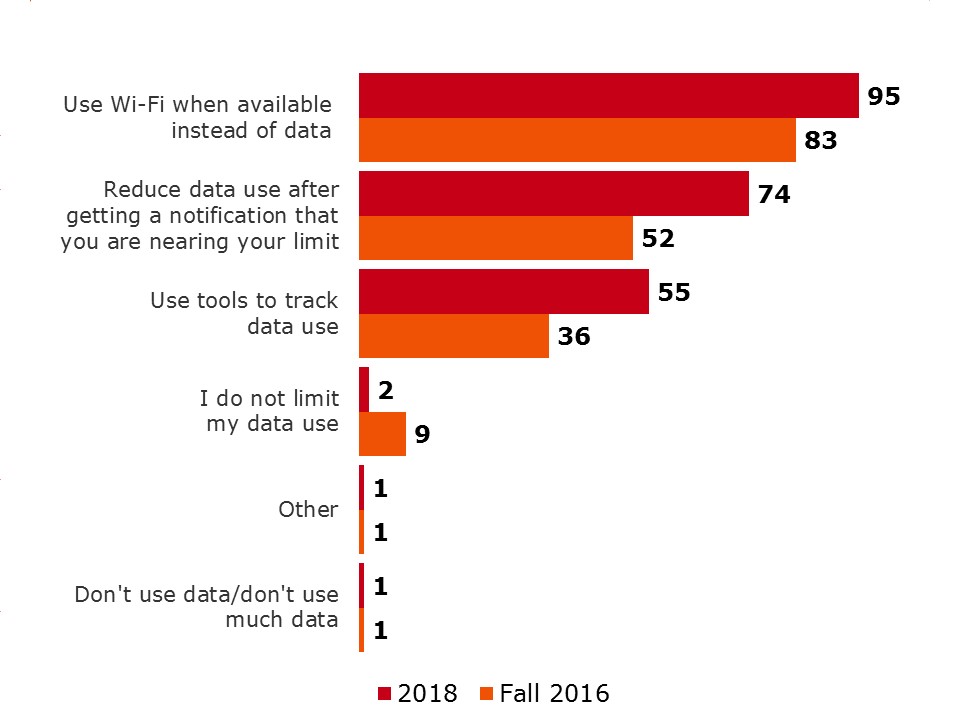
Almost all Canadians who have data in their wireless plans try to manage or limit their data use (94%). The extent of the activities undertaken to manage data varies and continues to mostly involve using Wi-Fi when available (95%). However, there is a significant increase in those who reduce data use when notified (74% vs. 52%) or actively monitor usage (55% vs. 36%) when comparing fall 2016 to 2018.
The younger age groups (18-54) are more likely to employ activities to manage or limit data usage. This is true for switching to Wi-Fi when available (97-98% for 18-54 year olds vs. 88% for 55+), using tools to track data (56-68% for 18-54 year olds vs. 35% for 55+) as well as reducing data usage when notified (75-84% for 18-54 year olds vs. 61% for 55+). This might well be due to a more limited understanding of the older age group of how to manage and limit data usage as opposed to a resistance to do so.
Not surprisingly, those who report data management to be easy are more likely to use tools to track data than those who find data management difficult (59% vs. 43%). A reduction in data usage is more likely to occur by those who have family plans (81% vs. 68%).
Exhibit 4.2.1.a. Activities to manage or limit data use
Activities to manage or limit data use - text version
QB5a. Which of the following activities, if any, do you do to manage or limit your data use? Select all that apply.
Base: Respondents who have limited data included in the wireless plan, fall 2016 (n=831), winter 2017 (651).
Exhibit 4.2.1.b. Activities to manage or limit data use by age
Activities done to manage or limit data use |
Total (A) |
Age | ||
|---|---|---|---|---|
| 18-34 (D) |
35-54 (E) |
55+ (F) |
||
| Base=actual | (651) % |
(99) % |
(267) % |
(278) % |
| Use Wi-Fi when available instead of data | 95 | 98 F | 97 F | 88 |
| Reduce data use after getting a notification | 74 | 84 F | 75 F | 61 |
| Use tools to track data use | 54 | 68 F | 56 F | 35 |
| I do not limit my data use | 2 | 4 | 1 | 2 |
QB5A. Which of the following activities, if any, do you use to manage or limit your data use? Select all that apply.
Note: Letters denote statistically significant difference. For example, if there is a B then the result is significantly higher than the corresponding result in column B.
Exhibit 4.2.1.c. Activities to manage or limit data use data management and family plans
| Activities to manage or limit data use | Total (A) |
Manage Data | Plan | ||
|---|---|---|---|---|---|
| Easy (F) |
Difficult (G) |
Family (J) |
Individual (K) |
||
| Base=actual | (651) % |
(498) % |
(85) % |
(267) % |
(376) % |
| Use Wi-Fi when available instead of data | 95 | 96 | 95 | 97 | 94 |
| Reduce data use after getting a notification | 74 | 72 | 83 | 81 K | 68 |
| Use tools to track data use | 55 | 59 G | 43 | 59 | 51 |
| I do not limit my data use |
2 | 1 | 2 | 1 | 2 |
| Other | 1 | 1 | 1 | 2 | <1 |
| Don't use data/don't use much data | 1 | 1 | 2 | 1 | 2 |
QB5a. Which of the following activities, if any, do you do to manage or limit your data use? Select all that apply.
Note: Letters denote statistically significant difference. For example, if there is a B then the result is significantly higher than the corresponding result in column B.
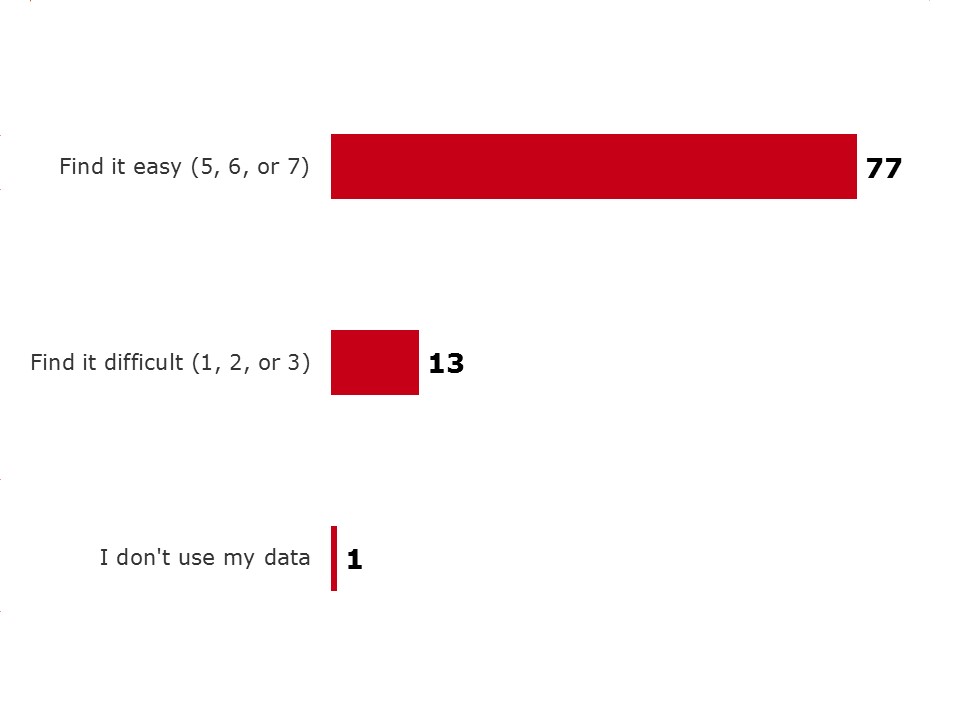
Most Canadians report finding it easy to manage their data each month. More than three in four Canadians (77%) consider it easy (5, 6 or 7 on a scale of 1-7).
However, we have seen in the previous section that older people (55+) are less likely to use data management strategies. Despite that, there is no significant differences in the reporting of ease of data management between the younger and older age groups.
Canadians who have lodged a complaint (19%) however, continue to find it more difficult to manage data use (26% vs. 8%) (1, 2 or 3 on a scale of 1-7).
Exhibit 4.2.2.a. Level of difficulty managing data use each month among those with data and those with data in a shared plan
Activities to manage or limit data use - text version
QB6. How easy do you find it to manage your data use each month? Please use a 7-point scale where 1 means extremely difficult and 7 means extremely easy. Base: Respondents who have data included in the wireless plan, fall 2016 (n=831)
WC6. How easy do you find it to manage the data used by yourself and/or your family each month?
Base: Respondents who have data included in their plan, winter 2017 (n=792)
Exhibit 4.2.2.b. Level of difficulty managing data use each month by lodged a complaint
| Level of difficulty to manage data use | Total (A) |
Lodged Complaint | ||
|---|---|---|---|---|
| Yes (S) |
No (T) |
|||
| Base=actual | (792) % |
(148) % |
(642) % |
|
| Find it easy to manage data each month (5, 6 or 7) | 77 | 60 | 82 S | |
| Find it difficult to manage data each month (1, 2 or 3) | 13 | 26 T | 9 | |
QWC6. How easy do you find it to manage the data used by yourself and/or your family each month? Please use a 7-point scale where 1 means extremely difficult and 7 means extremely easy.
Note: Letters denote statistically significant difference. For example, if there is a B then the result is significantly higher than the corresponding result in column B.
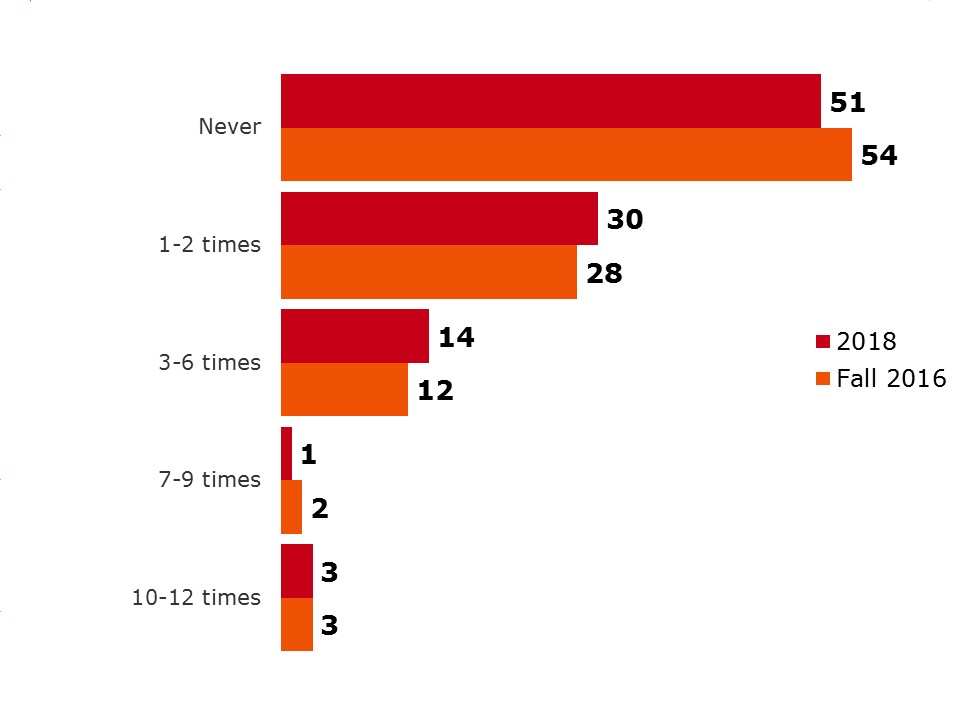
While many Canadians consider it easy to manage their data, a considerable portion (49%) continue to have paid data overages in the past 12 months suggesting that some Canadians are, in fact, struggling to manage their data in a way that prevents additional fees. Although not significant, there is a slight increase since Fall 2016 (46%). Most of those (74%) that have paid data overages have done so only once or twice in the past 12 months.
While the 2016 results showed no skews towards any particular demographic group, the picture has changed considerably in 2018 with a variety of demographic factors that influence whether or not Canadians have paid data overage fees:
There are a number of other factors that impact whether or not Canadians have paid data overage fees. These include what type of plan they have, whether or not they manage their data and how informed they are about the CRTC.
Consistent with previous year’s results, those with a family plan are more likely to have paid data overage fees in the last 12 months compared to those on an individual plan (58% vs. 42%).[3] Canadians with an employee purchase plan are less likely to have paid data overage fees (32% vs. 50%) compared to those who do not have an employee purchase plan. This is also true for those with unlimited data compared to those with limited data (33% vs. 63%).
Not surprisingly, those who find data management difficult are more likely to have paid data overage fees in the past 12 months (81% vs. 42%). However, this may also be due to a difference in perception of ease of data management. As one would expect, those who find data management easy are less likely to have paid data overage fees. In fact, only 13 percent of those who find data management easy have paid data overage fees 3 times or more in the past 12 months.
The data also shows that Canadians who are very well informed of the role of the CRTC are less likely to have paid data overage fees (25%) compared to those who are less informed of the role or do not understand its role very well (52-54%). While, the CRTC doesn’t manage data for consumers, it did specifically examine the tools available to help consumers manage their data and expects wireless service providers to offer those tools. Thus, it is not surprising that a more informed consumer tends to have a greater ability to steer clear of data overage fees.
Exhibit 4.2.3.a. Data overage fees paid in the past 12 months
Data overage fees paid in the past 12 months - text version
QB8. In the past 12 months, how often have you paid data overage fees?
Base: Respondents who have data included in the wireless plan, fall 2016 (n=831)
Exhibit 4.2.3.b. Data overage fees paid in the past 12 months by plan and data
Data overage fees paid in the past 12 months |
Total (A) |
Plan | Data | ||
|---|---|---|---|---|---|
| Family (J) |
Individual (K) |
Unlimited (D) |
Limited (E) |
||
| Base=actual | (796) % |
(326) % |
(460) % |
(122) % |
(651) % |
| Never | 51 | 42 | 58 J | 67 E | 47 |
| 1-2 times | 30 | 32 | 28 | 23 | 32 |
| 3-6 times | 14 | 20 K | 10 | 7 | 16 |
| 7-9 times | 1 | 2 | * | - | 1 |
| 10-12 times | 3 | 3 | 3 | 2 | 4 |
* denotes less than 1%.
QB8. In the past 12 months, how often have you paid data overage fees?
Note: Letters denote statistically significant difference. For example, if there is a B then the result is significantly higher than the corresponding result in column B.
Exhibit 4.2.3.c. Data overage fees paid in the past 12 months by age and region
Data overage fees paid in the past 12 months |
Total (A) |
Age | Region | |||||||
|---|---|---|---|---|---|---|---|---|---|---|
| 18-34 (D) |
35-54 (E) |
55+ (F) |
Atl (G) |
Que (H) |
Ont (I) |
Pra (J) |
BC (K) |
Terr (O) |
||
| Base=actual | (796) % |
(120) % |
(313) % |
(353) % |
(71) % |
(141) % |
(219) % |
(226) % |
(96) % |
(43) % |
| Never | 51 | 39 | 52 D | 63 DE | 55 O | 62 IO | 47O | 56 O | 48 O | 26 |
| 1-2 times | 30 | 34 F | 31 F | 23 | 25 | 25 | 32 | 28 | 33 | 33 |
| 3-6 times | 14 | 19 F | 13 | 10 | 10 | 10 | 16 | 10 | 15 | 35 GHIJK |
| 7-9 times | 1 | 1 | 1 | 1 | 3 | - | 1 | 1 | 2 | - |
| 10-12 times | 3 | 6 | 2 | 2 | 8 | 2 | 3 | 4 | 1 | 6 |
QB8. In the past 12 months, how often have you paid data overage fees?
Note: Letters denote statistically significant difference. For example, if there is a B then the result is significantly higher than the corresponding result in column B.
Exhibit 4.2.3.d. Data overage fees paid in the past 12 months by language, employee purchase plan, and data
| Data overage fees paid in the past 12 months | Total (A) |
Language | Employee purchase plan | Data | ||||
|---|---|---|---|---|---|---|---|---|
| English (B) |
French (C) |
Other (D) |
Yes (N) |
No (O) |
Unlimited (D) |
Limited (E) |
||
| Base=actual | (796) % |
(550) % |
(137) % |
(106) % |
(62) % |
(728) % |
(122) % |
(721) % |
| Never | 51 | 51 | 62 D | 46 | 68 O | 50 | 67 E | 47 |
| 1-2 times | 30 | 27 | 23 | 42 BC | 21 | 31 | 23 | 32 |
| 3-6 times | 14 | 17 | 11 | 8 | 8 | 14 | 7 | 16 |
| 7-9 times | 1 | 2 | - | - | - | 1 | - | 1 |
| 10-12 times | 3 | 3 | 2 | 4 | 3 | 3 | 2 | 4 |
QB8. In the past 12 months, how often have you paid data overage fees?
Note: Letters denote statistically significant difference. For example, if there is a B then the result is significantly higher than the corresponding result in column B.
Exhibit 4.2.3.e. Data overage fees paid in the past 12 months by manage data and CRTC mandate
| Data overage fees paid in the past 12 months | Total (A) |
Manage data | Informed role of CRTC | ||||
|---|---|---|---|---|---|---|---|
| Easy (F) |
Difficult (G) |
Very well (K) | Well (L) |
Not very well (M) |
Not (N) |
||
| Base=actual | (796) % |
(610) % |
(98) % |
(51) % |
(204) % |
(333) % |
(197) % |
| Never | 51 | 58 G | 19 | 75 MN | 57 | 46 | 48 |
| 1-2 times | 30 | 29 | 31 | 19 | 22 | 37 L | 28 |
| 3-6 times | 14 | 10 | 36 F | 4 | 18 | 12 | 17 |
| 7-9 times | 1 | 1 | 3 | 1 | 2 | 1 | - |
| 10-12 times | 3 | 2 | 11 F | 1 | 1 | 3 | 6 L |
QB8. In the past 12 months, how often have you paid data overage fees?
Note: Letters denote statistically significant difference. For example, if there is a B then the result is significantly higher than the corresponding result in column B.
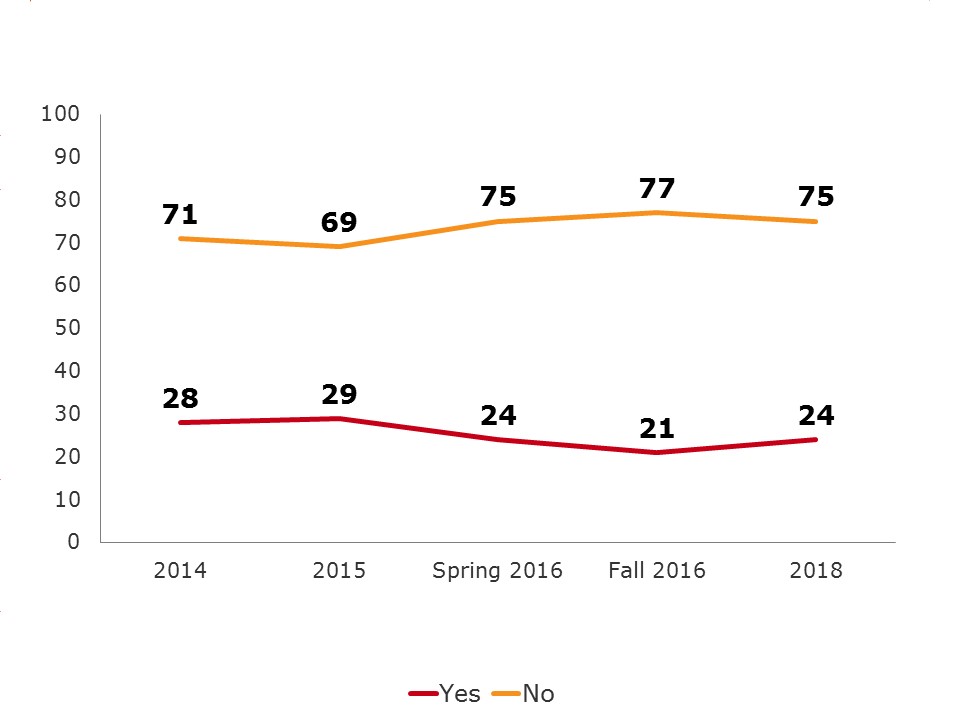
While the overall incidence of experiencing bill shock is relatively low, a small but significant portion of the population continues to experience bill shock in 2018 (24%). This suggests there continues to be room for improvement in this area.
Exhibit 4.3.1.a. Experienced bill shock
Experienced bill shock - text version
QB10/B6. During the last year, have you experienced ‘bill shock’, meaning a surprisingly high bill?
Base: Respondents who own a cell phone,2018 (n=1,111), fall 2016 (n=1,277), total respondents Spring 2016 (n=925), 2015 (n=1,005), 2014 (n=1,016)
Younger Canadians (18-54) continue to be substantially more likely to experience bill shock than their older counterparts (18-35: 36% & 35-54: 21% vs. 55+:15%). As are those who have made a complaint (61% vs. 15%), those with tab contracts (29% vs. 21%) and those who find data management difficult (62% vs. 19%). Quebec residents (16% vs. 26-31%) and Francophones (23% vs. 13%) are still the least likely to experience bill shock, as are those with individual plans (29% vs. 21%).
There are also a number of factors that appear to play a role in relation to experiencing bill shock in the last 12 months. Canadians with a wireless family plan where four people share the plan are more likely to experience bill shock ( (26% vs. 13%) and Canadians with data services included in their wireless plan are more likely to experience bill shock (83% vs. 74%).
Not unexpectedly, Canadians who experience bill shock are also more likely to take action by reducing data usage after receiving a notification of nearing their data limit (87% vs. 69%). Those with bill shock also find it more difficult to manage roaming fees while travelling (34% vs. 12%). Furthermore, those who have experienced bill shock in the last year, are more likely to report unclear explanation of contract cancellation implications (rated 1-3 on a scale from 1-7) (34% vs. 24%), find their contracts unclear and difficult to understand (rated 1-3 on a scale from 1-7) 29% vs. 14%) and are also more likely to report changes made to their contracts without being made aware of the changes (27% vs. 7%).
Exhibit 4.3.1.b. Experienced bill shock by age and region
| Experienced bill shock | Total (A) |
Age | Region | |||||||
|---|---|---|---|---|---|---|---|---|---|---|
| 18-34 (D) |
35-54 (E) |
55+ (F) |
Atl (G) |
Que (H) |
Ont (I) |
Pra (J) |
BC (K) |
Terr (O) |
||
| Base=actual | (1,111) % |
(141) % |
(359) % |
(594) % |
(102) % |
(224) % |
(301) % |
(310) % |
(126) % |
(48) % |
| Yes | 24 | 36 EF | 21 F | 15 | 16 | 16 | 28 H | 26 H | 19 | 31 |
| No | 75 | 63 | 78 D | 84 D | 84 I | 83 IJO | 71 | 73 | 77 | 67 |
QB10. During the last year, have you experienced ‘bill shock, meaning a surprisingly high bill?
Note: Letters denote statistically significant difference. For example, if there is a B then the result is significantly higher than the corresponding result in column B.
Exhibit 4.3.1.c. Experienced bill shock by language and plan
| Experienced bill shock | Total (A) |
Language | Plan | |||
|---|---|---|---|---|---|---|
| English (B) |
French (C) |
Other (D) |
Family (J) |
Individual (K) |
||
| Base=actual | (1,111) % |
(741) % |
(219) % |
(144) % |
(368) % |
(713) % |
| Yes | 24 | 23 C | 13 | 35 BC | 29 K | 21 |
| No | 75 | 76 D | 87 BD | 63 | 70 | 78 J |
QB10. During the last year, have you experienced ‘bill shock, meaning a surprisingly high bill?
Note: Letters denote statistically significant difference. For example, if there is a B then the result is significantly higher than the corresponding result in column B.
Exhibit 4.3.1.d. Experienced bill shock by tab contract, manage data and complaint
Experienced bill shock |
Total (A) |
Tab Contract | Difficulty managing data | Lodged a complaint | |||
|---|---|---|---|---|---|---|---|
| Yes (B) |
No (C) |
Easy (F) |
Difficult (G) |
Made one (S) |
Did not make one (T) |
||
| Base=actual | (1,111) % |
(293) % |
(744) % |
(610) % |
(98) % |
(183) % |
(925) % |
| Yes | 24 | 29 C | 21 | 19 | 62 F | 61 T | 15 |
| No | 75 | 70 | 78 B | 80 G | 37 | 37 | 84 S |
QB10. During the last year, have you experienced ‘bill shock, meaning a surprisingly high bill?
Note: Letters denote statistically significant difference. For example, if there is a B then the result is significantly higher than the corresponding result in column B.
Reasons
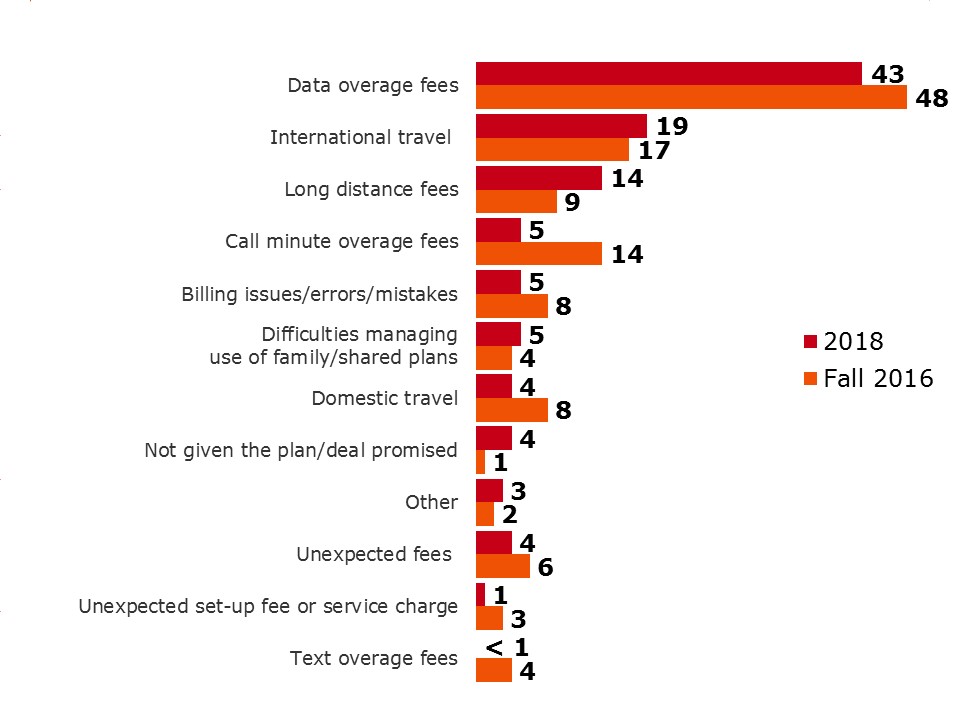
Results suggest that data overage fees are still the main reason for bill shock (43%). This is especially true for those who have a high school education or less compared to those with a college or university education (52% vs. 38-43%). However, base sizes are small which means the findings should be considered directional.
While call minute overage fees were one of the leading causes of bill shock in the Fall of 2016 (14%) it is not as common in 2018 (5%). However, long-distance fees (14%) appear to be more pertinent than in the Fall of 2016. This suggests that Canadians are still struggling to:
Exhibit 4.3.1.e. Main reason for bill shock
Main reason for bill shock - text version
QB10a. What was the main reason for the ‘bill shock’ you experienced?
Base: Those who experienced ‘bill shock’, 2018 (n=211), fall 2016 (n=250)
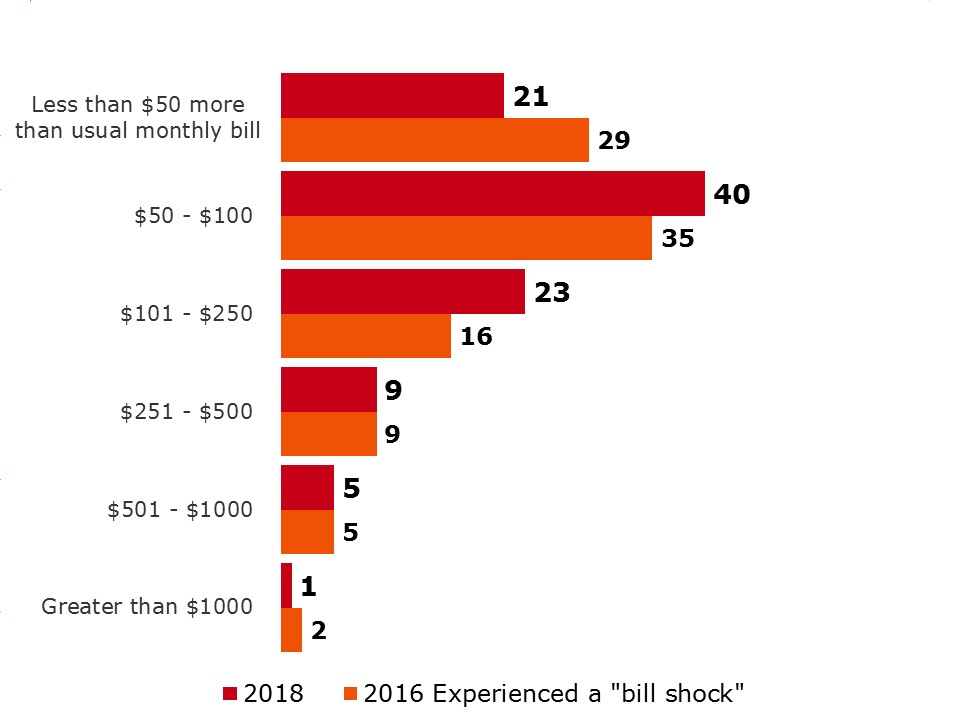
Amount
The amount of the unexpected charges varies from less than $50 to over $1,000 per billing cycle. Most of the unexpected charges (61%) however, are still $100 or less per month.
Exhibit 4.3.1.f. Amount of unexpected charges on bill among those who have experienced a “bill shock”
Amount of unexpected charges on bill among those who have experienced a “bill shock” - text version
Q10b. What was the amount of the unexpected charges on your bill?
Base: Respondents who have experienced a “bill shock”, 2018 (n=211), fall 2016 (n=285)
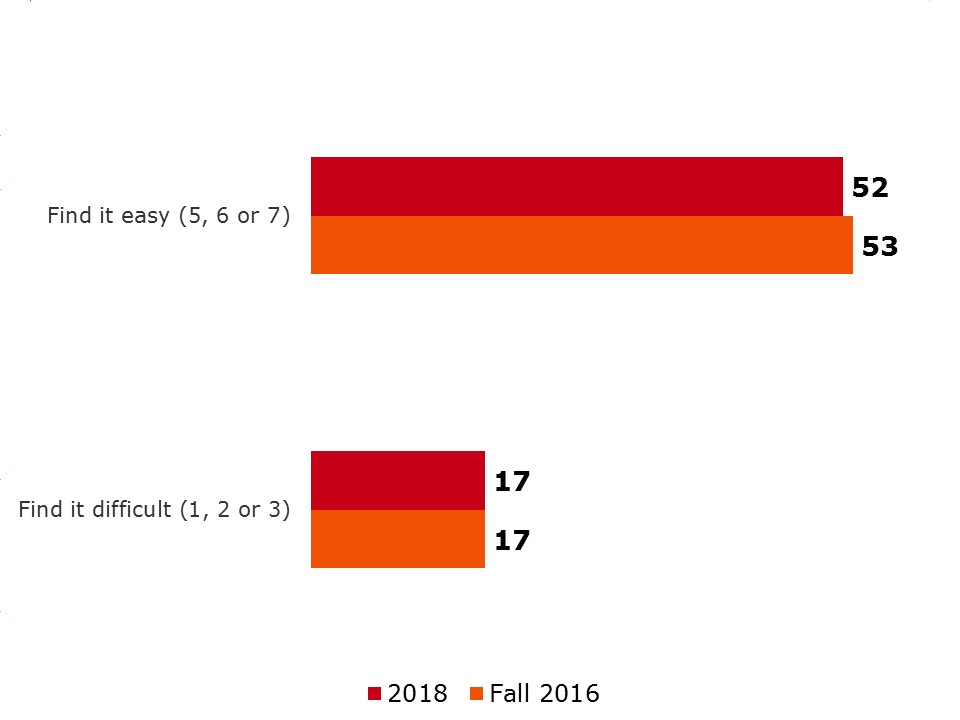
Many Canadians continue to find it challenging to manage roaming fees while travelling. Only half of Canadians (52%) find it easy (5, 6 or 7 on a scale of 1-7) which is on par with Fall 2016 findings (53%). Almost one in every five (17%) Canadians find it quite difficult (1, 2 or 3 on a scale of 1-7) to manage roaming fees.
Exhibit 4.3.2.a. Level of difficulty managing roaming charges when travelling
Level of difficulty managing roaming charges when travelling - text version
QB9. If you use your plan while traveling, you may be charged roaming fees.
How easy do you find it to manage your roaming charges when you are traveling? Please use a 7-point scale where 1 means extremely difficult and 7 means extremely easy.
Base: Respondents who own a cell phone, 2018 (n=1,111), fall 2016 (n=1,277)
Men find it easier to manage roaming charges than women, (56% vs. 48%) as do Canadians who earn $150k or more (68%) when compared to all other income groups and significantly more so compared to those earning under $40k (39%).
It also continues to be true that those with family plans also find it easier to manage roaming charges when compared to consumers with individual plans (58% vs. 50%).
Not unexpectedly and on par with 2016 findings, those who find it easy to manage data are also more likely to find it easy to manage roaming fees (61% vs. 43%) suggesting they are more savvy consumers.
Exhibit 4.3.2.b. Level of difficulty managing roaming charges when travelling by gender and plan
| Level of difficulty managing roaming charges when travelling | Total (A) |
Gender | Plan | ||
|---|---|---|---|---|---|
| Male (B) |
Female (C) |
Family (J) |
Individual (K) |
||
| Base=actual | (1,111) % |
(526) % |
(585) % |
(368) % |
(713) % |
| Find it easy (5, 6 or 7) | 52 | 56 C | 48 | 58 K | 50 |
| Find it difficult (1, 2 or 3) | 17 | 19 | 16 | 20 | 16 |
QB9. If you use your plan while traveling, you may be charged roaming fees. How easy do you find it to manage your roaming charges when you are traveling? Please use a 7-point scale where 1 means extremely difficult and 7 means extremely easy.
Note: Letters denote statistically significant difference. For example, if there is a B then the result is significantly higher than the corresponding result in column B.
Exhibit 4.3.2.d. Level of difficulty managing roaming charges when travelling by manage data and income
Level of difficulty managing roaming charges when travelling |
Total (A) |
Manage data | Income | |||||
|---|---|---|---|---|---|---|---|---|
| Easy (B) |
Difficult (C) |
<$40K (E) |
$40K- <$60K (F) |
$60K- <$100K (G) |
$100K- <$150K (H) |
$150K+ (I) |
||
| Base=actual | (1,111) % |
(610) % |
(98) % |
(199) % |
(168) % |
(261) % |
(163) % |
(141) % |
| Find it easy (5, 6 or 7) | 52 | 61 C | 43 | 39 | 59 E | 49 | 53 E | 68 EGH |
| Find it difficult (1, 2 or 3) | 17 | 15 | 42 B | 11 | 14 | 18 | 29 EF | 19 |
QB9. If you use your plan while traveling, you may be charged roaming fees. How easy do you find it to manage your roaming charges when you are traveling? Please use a 7-point scale where 1 means extremely difficult and 7 means extremely easy.
Note: Letters denote statistically significant difference. For example, if there is a B then the result is significantly higher than the corresponding result in column B.
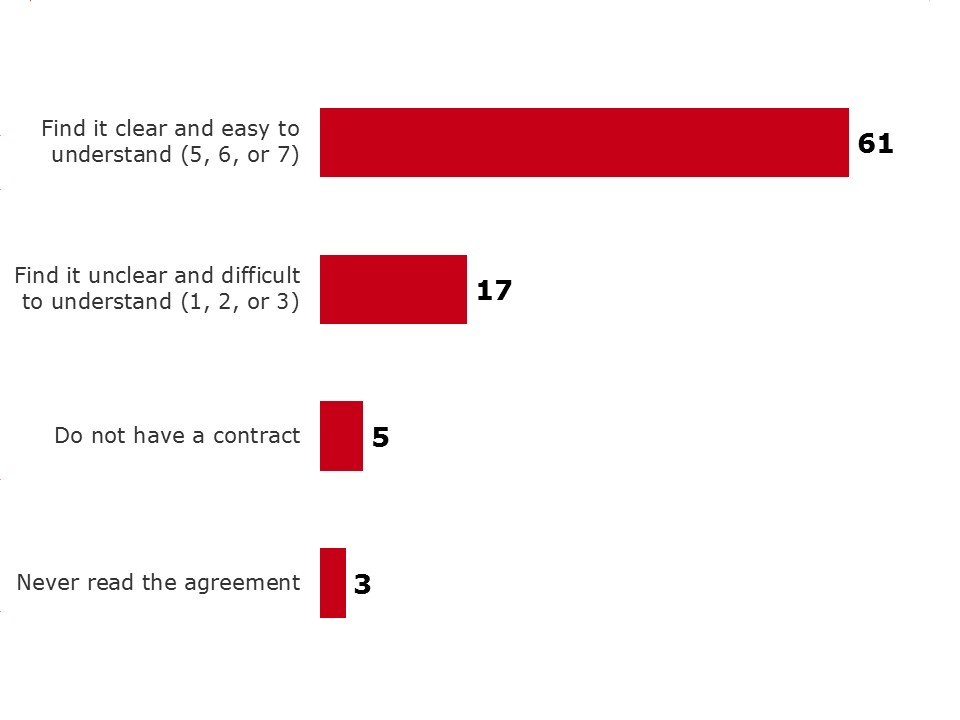
Almost one in three Canadians (29%) believes their wireless contract is extremely clear and easy to understand. In fact, almost two in three Canadians (61%) find it easy and clear (5, 6 or 7 on a scale of 1-7). This is especially true for those aged 18-34 when compared to those aged 35+ (74% vs. 55-56%). It is also true that Canadians with a university degree or higher find their contracts easier to understand when compared to those with a lower education level (55% vs. 66-67%).
Canadians living outside of B.C. find their contracts easier to understand than those who reside in B.C. (59%-66% vs. 44%). B.C.’s residents do not find their contracts to be unclear or difficult to understand but rather feel more neutral about them.
Exhibit 4.4.1.a. Level of ease of understanding wireless contract
Level of ease of understanding wireless contract - text version
WC10. Do you find your contract clear and easy to understand? Please use a 7-point scale where 1 means extremely unclear and difficult to understand and 7 means extremely clear and easy to understand.
Base: Total respondents who own a cell phone, 2018 (n=1,111)
In addition to the above, further factors influence the perception of whether or not a contract is clear and easy to understand. Canadians with unlimited data find their contracts to be less complex and easier to understand (77% vs. 59%). This might merely be a perception of a more understandable contract but the findings suggest there is room for improvement in this area. Not surprising, those who find data management easy also find their contracts easier to navigate (70% vs. 42%). Both suggesting data plays an important role when it comes to contracts.
Exhibit 4.4.1.b. Level of ease of understanding of wireless contract by age, education and data
Level of ease of understanding of wireless contract |
Total (A) |
Age | Education | Data | |||||
|---|---|---|---|---|---|---|---|---|---|
| 18-34 (D) |
35-54 (E) |
55+ (F) |
High school or less (P) |
College (Q) |
University or more (R) |
Unlimit-ed Data (D) |
Limited Data (E) |
||
| Base=actual | (1,111) % |
(141) % |
(359) % |
(594) % |
(278) % |
(314) % |
(501) % |
(122) % |
(651) % |
| Find it clear and easy to understand (5, 6 or 7) | 61 | 74 EF | 56 | 55 | 66 R | 67 R | 55 | 77 E | 59 |
| Find it unclear and difficult to understand (1, 2 or 3) | 17 | 11 | 22 D | 19 | 10 | 16 | 23 P | 11 | 21 D |
QWC10. Do you find your contract clear and easy to understand? Please use a 7-point scale where 1 means extremely unclear and difficult to understand and 7 means extremely clear and easy to understand.
Note: Letters denote statistically significant difference. For example, if there is a B then the result is significantly higher than the corresponding result in column B.
Exhibit 4.4.1.c. Level of ease of understanding of wireless contract by region and manage data
Level of ease of understanding of wireless contract |
Total (A) |
Region | Difficulty managing data | ||||||
|---|---|---|---|---|---|---|---|---|---|
| Atl (G) |
Que (H) |
Ont (I) |
Pra (J) |
BC (K) |
Terr (O) |
Easy (F) |
Difficult (G) |
||
| Base=actual | (1,111) % |
(102) % |
(224) % |
(301) % |
(310) % |
(126) % |
(48) % |
(610) % |
(98) % |
| Find it clear and easy to understand (5, 6, or 7) | 61 | 67 K | 65 K | 59 K | 66 K | 44 | 63 K | 70 G | 42 |
| Find it unclear and difficult to understand (1, 2, or 3) | 17 | 13 | 17 | 16 | 18 | 24 | 19 | 13 | 14 F |
QWC10. Do you find your contract clear and easy to understand? Please use a 7-point scale where 1 means extremely unclear and difficult to understand and 7 means extremely clear and easy to understand.
Note: Letters denote statistically significant difference. For example, if there is a B then the result is significantly higher
than the corresponding result in column B.
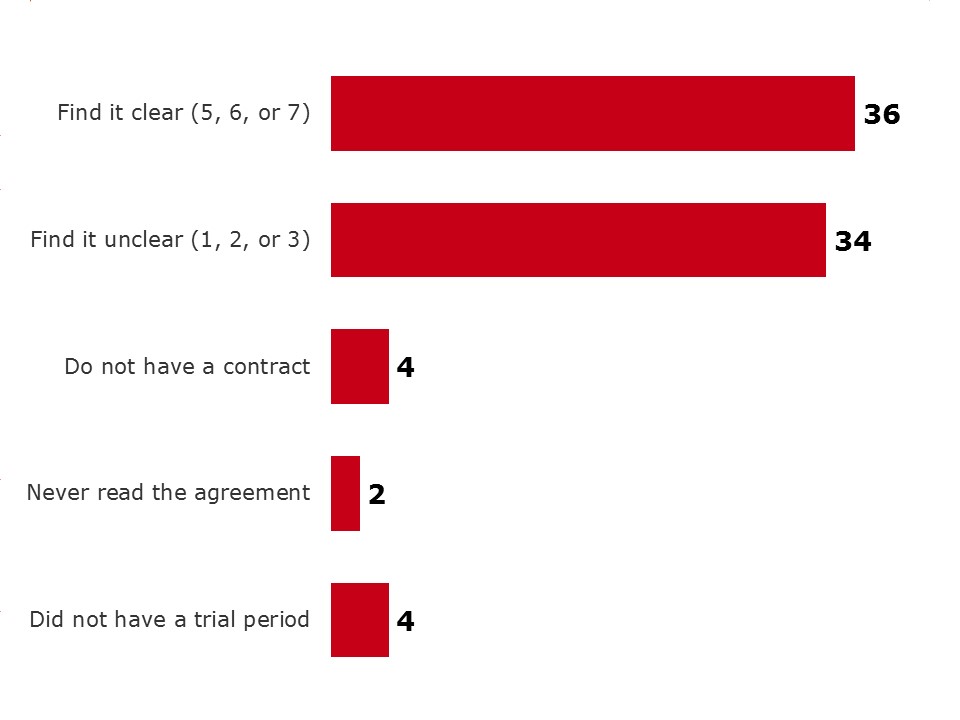
Since 2013, the Wireless Code has required service providers to include a trial period for new contracts that include an early cancellation fee. During the trial period, wireless contract holders can cancel their contract without penalty. This trial period must be a minimum of 15 days service and as of December 1st, 2017, it must permit the customer to use up to half the voice, text, and data usage amounts included in their monthly plan.
Canadians were asked how clear their explanation of the trial period was when they took out their wireless contract. Only a small number of Canadians found the explanation to be clear (36%: 5, 6 or 7 on a scale from 1-7). The remaining, found the explanation to be neither clear nor unclear (20%) or to be unclear (34%: 1, 2 or 3 on a scale from 1-7). A very small minority reported not receiving this trial period at all, which may be due to a contract not being subject to an early cancellation fee.
Exhibit 4.4.2.a. Ease of understanding explanation of the trial period
Ease of understanding explanation of the trial period - text version
WC8. The Code requires service providers to include a trial period for new contracts that include a device. During the trial period, you can cancel your contract without penalty. This trial period now has to be half of a month of service and include half the service included in your monthly plan. How clearly did your service provider explain the trial period to you?
Please use a 7-point scale where 1 means extremely unclear and 7 means extremely clear.
Base: Total respondents who own a cell phone, 2018 (n=1,111)
Interestingly, Canadians with a lower level of education tend to find the explanation of the trial period clear and easier to understand compared to those with a university degree (44% vs. 31% rated 5, 6 or 7 on a scale from 1-7). In fact, one in four Canadians with a university degree find the explanation to be extremely unclear (26%). In previous instances, Canadians with lower educations reported finding other aspects of their wireless contract more difficult and unclear which suggests that those with a lower education might think they understand the details of the trial period, but in fact, do not.
Results also suggest that the type of plan plays a role in how easy or difficult the trial period explanation is to understand. More specifically, those who have a family plan find the trial period explanation clearer than those with individual plans (42% vs. 33%) and those with unlimited data find it clearer compared to those with limited data (46% vs. 34%). Again, highlighting the important role of data when it comes to understanding contracts.
Exhibit 4.4.2.b. Ease of understanding explanation of the trial period by education, plan and data
| Ease of understanding explanation of the trial period | Total (A) |
Education | Plan | Data | ||||
|---|---|---|---|---|---|---|---|---|
| High school or less (P) |
College (Q) |
University or more (R) |
Family (J) |
Individual (K) |
Unlimited data (D) |
Limited data (E) |
||
| Base=actual | (1,111) % |
(278) % |
(314) % |
(501) % |
(368) % |
(713) % |
(122) % |
(651) % |
| Find it clear and easy to understand (5, 6 or 7) | 36 | 44 R | 38 | 31 | 42 K | 33 | 46 E | 34 |
| Find it unclear and difficult to understand (1, 2 or 3) | 34 | 26 | 33 | 38 P | 33 | 35 | 28 | 40 |
QWC8. The Code requires service providers to include a trial period for new contracts that include a device. During the trial period, you can cancel your contract without penalty. This trial period now has to be half of a month of service and include half the service included in your monthly plan. How clearly did your service provider explain the trial period to you? Please use a 7-point scale where 1 means extremely unclear and 7 means extremely clear.
Note: Letters denote statistically significant difference. For example, if there is a B then the result is significantly higher than the corresponding result in column B.
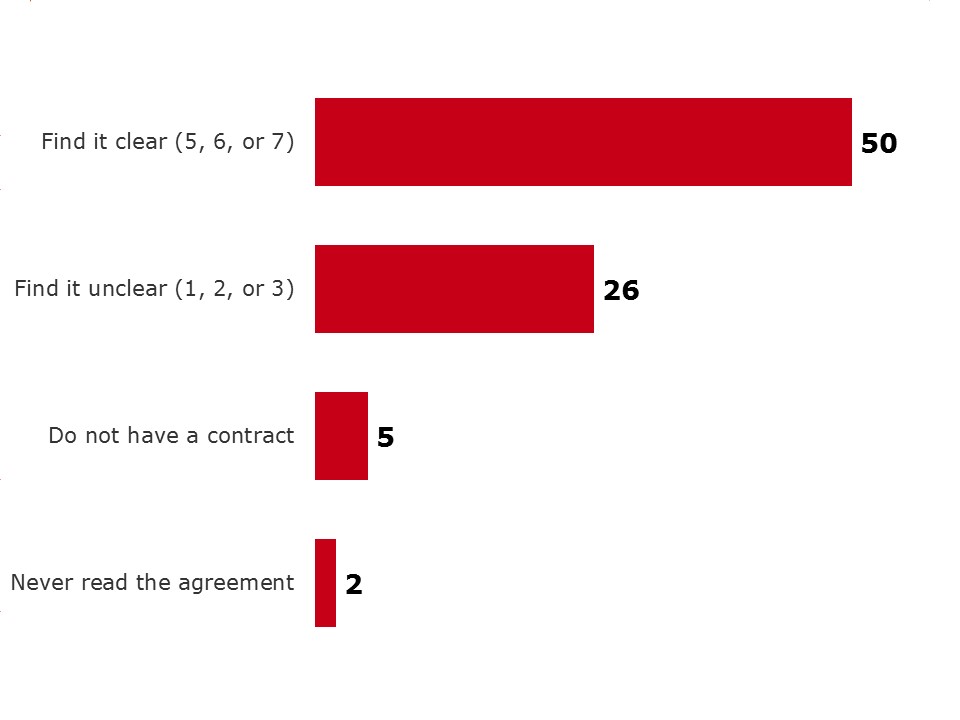
Most service providers require customers to pay a cancellation fee if they cancel their contracts before the agreed upon end date. This needs to be carefully explained to the consumer for them to be fully aware of the implications of early cancellation. While one in two Canadians who have wireless plans find the explanation to be clear, a concerning 26% report this explanation to be unclear, implying an insufficient explanation by some service providers (rated 1, 2 or 3 on a scale from 1-7). This, however, is an improvement compared to 2014, when 32% of Canadians reported their service provider’s explanation of the early cancellation fee to be unclear.
Exhibit 4.4.3.a. Clear explanation of early cancellation of contract
Clear explanation of early cancellation of contract - text version
WC9. When you signed your contract or accepted your service agreement, how clearly did your service provider explain any fees that would apply if you cancel your contract or agreement early? Please use a 7-point scale where 1 means extremely unclear and 7 means extremely clear.
Base: Total respondents who own a cell phone, 2018 (n=1,111)
Unclear explanation of cancellation fees (rated 1, 2 or 3 on a scale from 1-7) is more likely to be reported by men (30% vs. 23%), those with a university degree compared to those with only high school or less (32% vs. 18%), those who have made a complaint (39% vs. 24%) and those who find data management difficult (43% vs. 25%).
Regional skews are pertinent with the Territories reporting significantly higher levels (48%) of the explanation being unclear compared to all other regions (21-34%)
Exhibit 4.4.3.b. Clear explanation of early cancellation of contract by gender and region
| Clear explanation of early cancellation of contract | Total (A) |
Gender | Region | ||||||
|---|---|---|---|---|---|---|---|---|---|
| Male (B) |
Female (C) |
Atl (G) |
Que (H) |
Ont (I) |
Pra (J) |
BC (K) |
Terr (O) |
||
| Base=actual | (1,111) % |
(526) % |
(585) % |
(102) % |
(224) % |
(301) % |
(310) % |
(126) % |
(48) % |
| Find it clear (5, 6, or 7) | 50 | 50 | 50 | 57 KO | 55 KO | 49 | 53 KO | 39 | 32 |
| Find it unclear (1, 2 or 3) | 26 | 30 C | 23 | 21 | 24 | 25 | 26 | 34 | 48 GHIJ |
QWC9. When you signed your contract or accepted your service agreement, how clearly did your service provider explain any fees that would apply if you cancel your contract or agreement early? Please use a 7-point scale where 1 means extremely unclear and 7 means extremely clear.
Note: Letters denote statistically significant difference. For example, if there is a B then the result is significantly higher than the corresponding result in column B.
Exhibit 4.4.3.c. Clear explanation of early cancellation of contract by education, complaint, and data management
Clear explanation of early cancellation of contract |
Total (A) |
Education | Complaint | Difficulty managing data | ||||
|---|---|---|---|---|---|---|---|---|
| High school or less (P) |
College (Q) |
University or more (R) |
Made one (S) |
Did not make one (T) |
Easy (F) |
Difficult (G) |
||
| Base=actual | (1,111) % |
(278) % |
(314) % |
(501) % |
(183) % |
(925) % |
(610) % |
(98) % |
| Find it clear (5, 6, or 7) | 50 | 59 R | 51 | 45 | 32 | 54 S | 54 G | 39 |
| Find it unclear (1, 2 or 3) | 26 | 18 | 26 | 32 P | 39 T | 24 | 25 | 43 F |
QWC9. When you signed your contract or accepted your service agreement, how clearly did your service provider explain any fees that would apply if you cancel your contract or agreement early? Please use a 7-point scale where 1 means extremely unclear and 7 means extremely clear.
Note: Letters denote statistically significant difference. For example, if there is a B then the result is significantly higher than the corresponding result in column B.
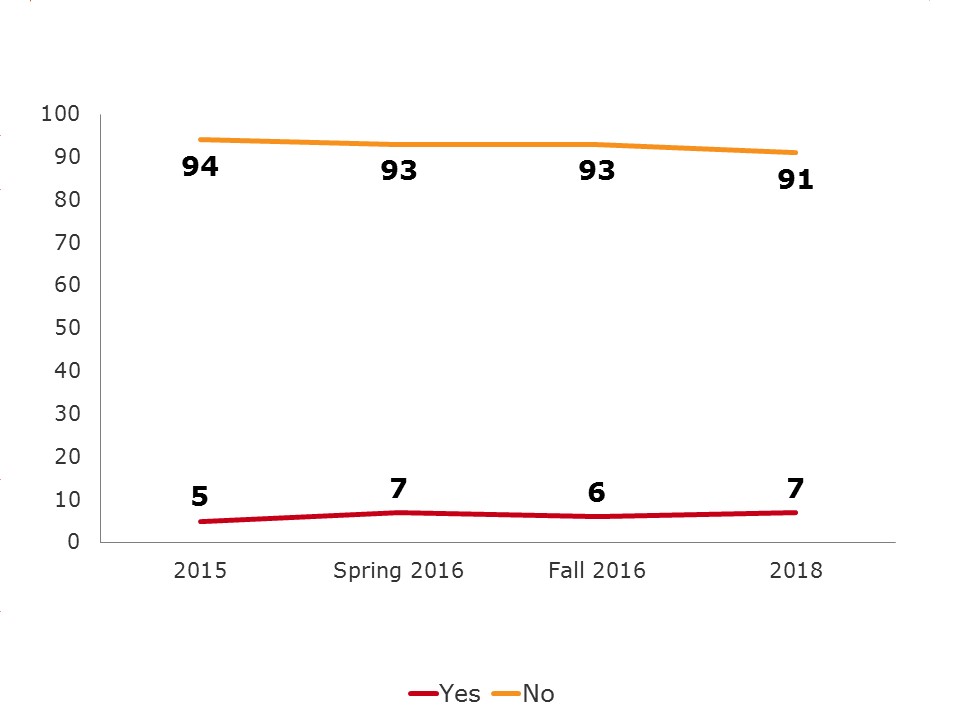
In only a small number of instances (12%) changes to wireless services were made without expressly making the consumer aware of the new terms and conditions. This tends to be the case for younger Canadians (18-34 and 35 to 54 year olds) (17% and 13% respectively) compared to older Canadians (7%). Households with an income of between $40k and $60k are less likely (5%) to believe they have experienced this compared to other income groups (12-16%).
Exhibit 4.5.1.a. Changes to contract without disclosure of changes in terms and conditions
Changes to contract without disclosure of changes in terms and conditions - text version
WC11. Have you ever become aware that your service provider changed your plan without expressly making you aware of how the terms and conditions had changed?
Base: Total respondents who own a cell phone, 2018 (n=1,111)
Changes to wireless services without expressly making the consumer aware of the new terms and conditions is reported more often by those who have made a complaint in the last 12 months (30% vs. 8%) and one can expect that some of these complaints might be related to the unexpected service changes.
There is also a higher incidence of tab contract users reporting unexpected changes (16% vs. 10%) and it is also more likely to have occurred among consumers who find data management difficult (27% vs. 8%).
Exhibit 4.5.1.b. Changes to contract without disclosure of changes in terms and conditions by Age and Income
| Changes to contract without disclosure | Total (A) |
Age | Income | ||||||
|---|---|---|---|---|---|---|---|---|---|
| 18-34 (D) |
35-54 (E) |
55+ (F) |
<$40K (E) |
$40K- <$60K (F) |
$60K- <$100K (G) |
$100K- <$150K (H) |
$150K+ (I) |
||
| Base=actual | (1,111) % |
(141) % |
(359) % |
(594) % |
(199) % |
(168) % |
(261) % |
(163) % |
(141) % |
| Yes | 12 | 17 F | 13 F | 7 | 16 F | 5 | 12 | 14 F | 15 F |
QWC11. Have you ever become aware that your service provider changed your plan without expressly making you aware of how the terms and conditions had changed?
Note: Letters denote statistically significant difference. For example, if there is a B then the result is significantly higher than the corresponding result in column B.
Exhibit 4.5.1.c. Changes to contract without disclosure of changes in terms and conditions by Complaint, Tab and Manage data
| Changes to contract without disclosure | Total (A) |
Lodged Complaint | Tab contracts | Manage data | |||
|---|---|---|---|---|---|---|---|
| Yes (S) |
No (T) |
Yes (B) |
No (C) |
Easy (F) |
Difficult (G) |
||
| Base=actual | (1,111) % |
(183) % |
(925) % |
(293) % |
(744) % |
(610) % |
(98) % |
| Yes | 12 | 30 T | 8 | 16 C | 10 | 8 | 27 F |
QWC11. Have you ever become aware that your service provider changed your plan without expressly making you aware of how the terms and conditions had changed?
Note: Letters denote statistically significant difference. For example, if there is a B then the result is significantly higher than the corresponding result in column B.
A relatively small number of Canadian cell phone users have switched service providers in the last two years (16%) with the main reason being a better deal (49%) and dissatisfaction with their service provided only mentioned by one in five switchers (19%). Most switchers found it easy to do so (79%) (rated 5, 6 or 7 on a scale from 1-7) and the minority (13%) who found it difficult (1, 2 or 3 on a scale from 1-7) reported technical issues to be the main reason for their struggle (49%).
Exhibit 4.5.2.a. Switching wireless service providers and reasons for it
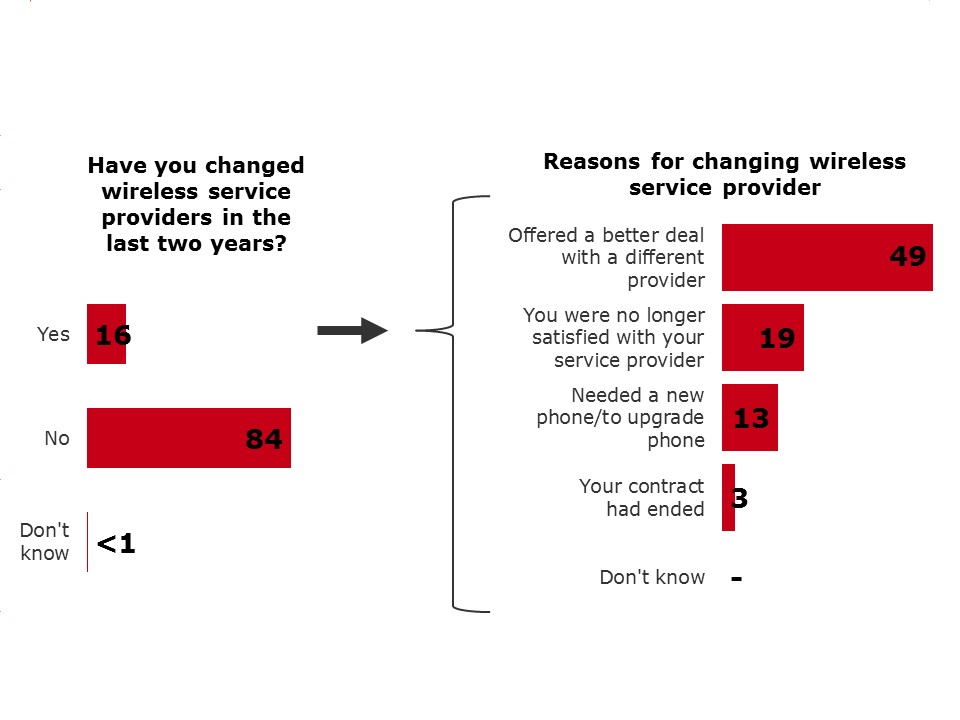
Switching wireless service providers and reasons for it - text version
WC16. Have you changed wireless service providers in the last two years?
Base: Total respondents who own a cell phone, 2018 (n=1,111)
WC12. Why did you change service provider?
Base: Total respondents who changed their service provider in P2Y, 2018 (n=152)
Exhibit 4.5.2.b. Ease of switching and reason for difficulty in switching providers
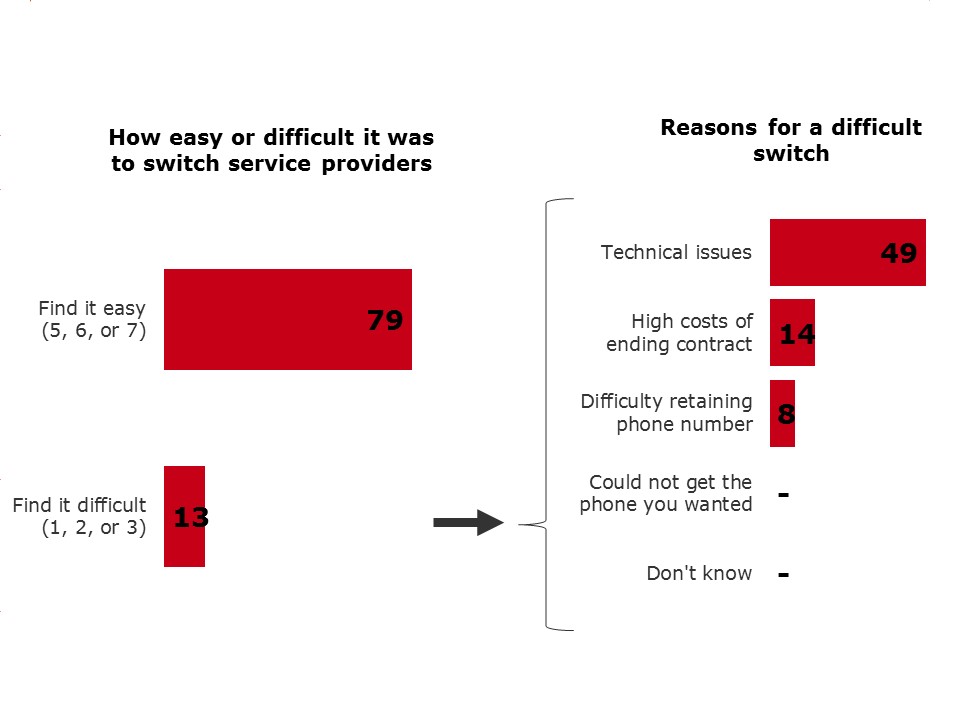
Ease of switching and reason for difficulty in switching providers - text version
WC13 How easy or difficult was it to switch service providers? Please use a 7-point scale where 1 means extremely difficult and 7 means extremely easy.
Base: Total respondents who changed their service provider in P2Y, 2018 (n=152)
WC14. Was there a reason why switching providers was difficult for you?
Base: Total respondents who find it difficult to switch, 2018 (n=19)
Switchers are more likely to be younger (18-54) (19% vs. 10%) and/or university graduates (19% vs. 12-14%). While there are no differences between regions, within the Prairies, those residing in Manitoba are more likely to switch than those living in Saskatchewan (21% vs. 6%)[4].
Exhibit 4.5.2.c. Switching wireless service providers by region and education
| Switching wireless service providers | Total (A) |
Region | Education | |||||||
|---|---|---|---|---|---|---|---|---|---|---|
| Atl (G) |
Que (H) |
Ont (I) |
Pra (J) |
BC (K) |
Terr (O) |
High school or less (P) |
College (Q) |
University or more (R) |
||
| Base=actual | (1,111) % |
(102) % |
(224) % |
(301) % |
(310) % |
(126) % |
(48) % |
(278) % |
(314) % |
(501) % |
| Yes | 16 | 19 | 16 | 18 L | 13 | 11 | 15 | 12 | 14 | 19 P |
WC16. Have you changed wireless service providers in the last two years?Base: Total respondents who own a cell phone, 2018 (n=1,111)
Note: Letters denote statistically significant difference. For example, if there is a B then the result is significantly higher than the corresponding result in column B.
Exhibit 4.5.2.d. Switching wireless service providers by age
| Switching wireless service providers | Total | Age | ||||
|---|---|---|---|---|---|---|
| 18-34 (D) |
35-54 (E) |
55+ (F) |
||||
| Base=actual | (1,111) % |
(141) % |
(359) % |
(594) % |
||
| Yes | 16 | 19 F | 19 F | 10 E | ||
WC16. Have you changed wireless service providers in the last two years?
Base: Total respondents who own a cell phone, 2018 (n=1,111) Note: Letters denote statistically significant difference. For example, if there is a B then the result is significantly higher than the corresponding result in column B
The rapid decline in incidence of Canadians making complaints about their wireless services stabilised in 2018. However, despite a slight, albeit insignificant increase in complaints between Fall 2016 and 2018 (1%) compared to 2014, eight per cent fewer Canadians have made complaints since 2014.
Exhibit 4.6.1.a. Wireless service complaint made in the past 12 months
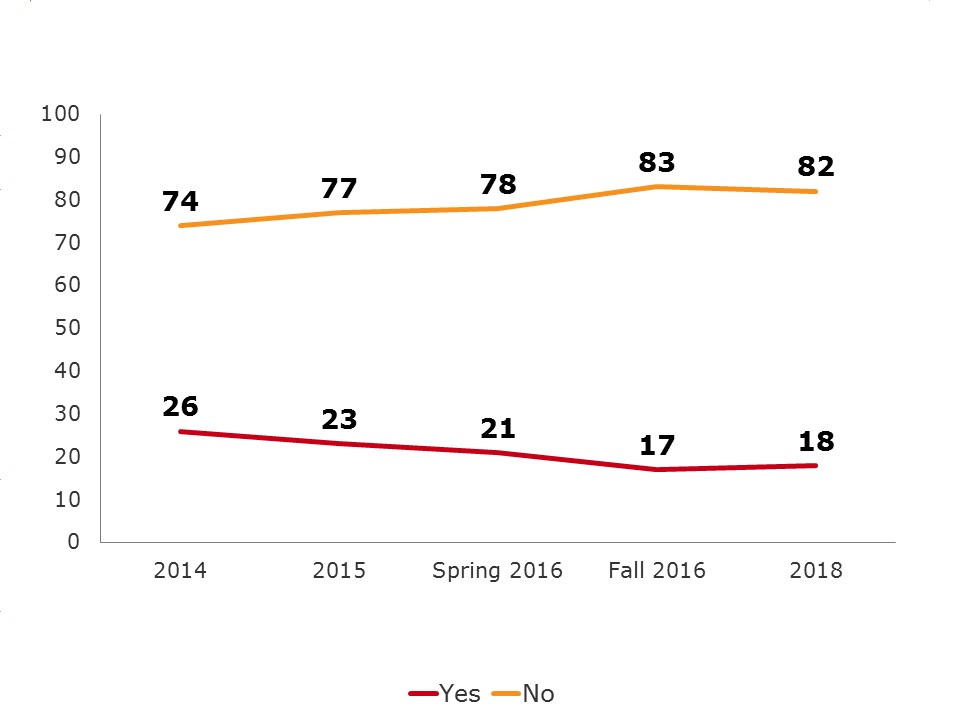
Wireless service complaint made in the past 12 months - text version
QB11a/QB11/QB4 Have you made a complaint about your wireless services in the past 12 months?
Base: Respondents who own a cell phone: 2018 (n=1,111), fall 2016 (n=1,277), total respondents, winter 2016 (n=925), 2015 (n=1,005),
2014 (n=1,016)
Quebeckers continue to be least likely to make complaints (8% vs 15-23%) compared to those in other regions of Canada. This is likely due to the provincial consumer protection legislation that Quebec has had in place since 2009 - Quebec’s Bill 60.
Canadians with higher educations (college or university) (21% each) are more likely to have complained to their service provider in the last 12 months, compared to those with a high school education or lower (10%). Similarly, English speaking Canadians are more likely to have complained compared to Francophones (19% vs. 9%) as did those with a family plan (23% vs. 16%).
Not unexpectedly, those who find managing data difficult are still more likely to make a complaint (43% vs. 16%).
Exhibit 4.6.1.b. Wireless service complaint made in the past 12 months by region, education
| Wireless service complaint made in P12M | Total (A) |
Region | Education | |||||||
|---|---|---|---|---|---|---|---|---|---|---|
| Atl (G) |
Que (H) |
Ont (I) |
Pra (J) |
BC (K) |
Terr (O) |
High school or less (P) |
College (Q) |
University or more (R) |
||
| Base=actual | (1,111) % |
(102) % |
(224) % |
(301) % |
(310) % |
(126) % |
(48) % |
(278) % |
(314) % |
(501) % |
| Yes | 18 | 16 | 8 | 22 H | 20 H | 23 H | 15 | 10 | 21 P | 21 P |
QB11a. Have you made a complaint about your wireless services in the past 12 months?
Note: Letters denote statistically significant difference. For example, if there is a B then the result is significantly higher than the corresponding result in column B.
Exhibit 4.6.1.c. Wireless service complaint made in the past 12 months by language, difficulty managing data and plan
| Wireless service complaint made in P12M | Total (A) |
Language | Manage data | Plan | ||||
|---|---|---|---|---|---|---|---|---|
| English (B) |
French (F) |
Other (G) |
Easy (F) |
Difficult (G) |
Family (J) |
Individual (K) |
||
| Base=actual | (1,111) % |
(741) % |
(219) % |
(144) % |
(610) % |
(98) % |
(211) % |
(888) % |
| Yes | 18 | 19 C | 9 | 24 C | 16 | 43 F | 23 K | 16 |
QB11a. Have you made a complaint about your wireless services in the past 12 months?
Note: Letters denote statistically significant difference. For example, if there is a B then the result is significantly higher than the corresponding result in column B.
Reason for Complaints
In addition to the decline in complaints, the actual reasons for the complaint are changing. When comparing the Fall of 2016 with the 2018 results, we see a significant decrease in three of the four primary reasons that Canadians complained about their wireless services: Incorrect charges on their bill (45% vs. 17%), inadequate quality of service (25% vs. 16%) and misleading information about the terms of contract (23% vs. 12%). The fourth reasons i.e. data charges also see a decline albeit not significant (32% vs. 29%) and continues to be the primary reason for complaints. This supports the notion that the Wireless Code is making a significant difference in the lives of wireless users with legislation working for consumers and again, highlights the importance of data in wireless contracts moving forward.
Exhibit 4.6.1.d. Reason for complaints
Reason for complaints - text version
QB11b. What was your complaint about?
Base: Respondents who made a complaint about the wireless services in the past 12 months, 2018 (n=183), Fall 2016 (n=203)
Complaint Issued to Service Provider
Consistent with earlier findings, more than 9 in 10 Canadians who make a complaint make the complaint to their service provider (97%)[5]. Five percent of these complaints are escalated to the CCTS, which is mandated to review complaints from customers who are unsatisfied with how their complaint was addressed by their service provider.
Exhibit 4.6.1.e. Complaints to wireless service provider
Complaints to wireless service provider - text version
WC7. Who did you complain to? Was it your service provider, the Commission for Complaints for Telecom-Television Services, also knowns as the CCTS, or both?
Base: Total respondents who made a complaint about the wireless services in the P12M, 2018 (n=183)
QB11c. Did you complain to your service provider?
Base: Those who made a complaint, Fall 2016 (n=203)
QB4a. Who did you complain to?
Base: Those who made a complaint winter 2016 (n=179), 2015 (n=222), 2014 (n=258)
Pre-paid or Post-paid
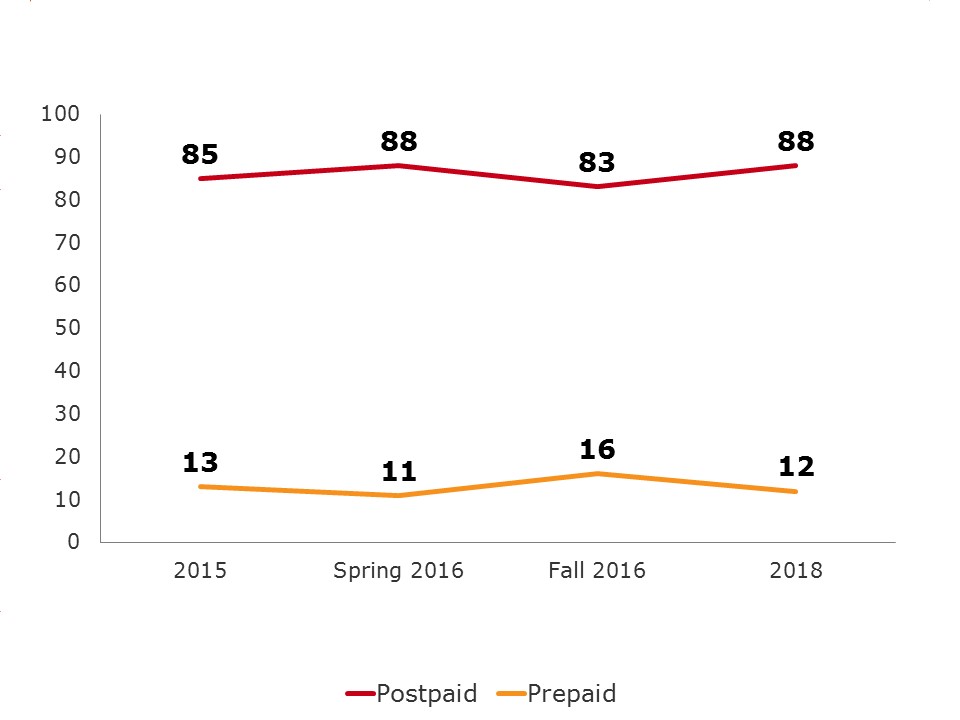
Most Canadians continue to purchase post-paid services in 2018 (88%), in fact, only 1 in 10 cell phone owners used prepaid or pay-as-you-go plans. A very small minority have both post-paid and pre-paid services (1%).
Exhibit 4.7.1.a. Type of service plan
Type of service plan - text version
QB1c. Is it a monthly plan, or a prepaid or pay-as-you-go plan?
Base: Respondents who own a cell phone, 2018 (n=1,111), fall 2016 (n=1,277), total respondents Spring 2016 (n=925), 2015 (n=1,005)
Where we saw gender and income skews in the Fall of 2016, that is no longer the case. We do however, find that older Canadians (55+) are more likely to choose pre-paid/pay-as-you-go (14% vs. 9-10%). In addition to that, wireless consumers who have made a complaint in the last 12 months are more likely to have a monthly or post-paid plan (93% vs. 85%).
Exhibit 4.7.1.b. Type of service plan by age and complaint
| Type of service plan | Total | Age | Lodged Complaint | |||
|---|---|---|---|---|---|---|
| 18-34 (D) |
35-54 (E) |
55+ (F) |
Yes (S) |
No (T) |
||
| Base=actual | (1,111) % |
(141) % |
(359) % |
(594) % |
(183) % |
(925) % |
| Monthly/postpaid | 87 | 90 | 89 F | 83 | 93 T | 85 |
| Prepaid/pay-as-you-go | 11 | 10 | 9 | 14 E | 6 | 12 |
QB1c. And, is it a monthly plan, or a prepaid or pay-as-you-go plan?
Note: Letters denote statistically significant difference. For example, if there is a B then the result is significantly higher than the corresponding result in column B.
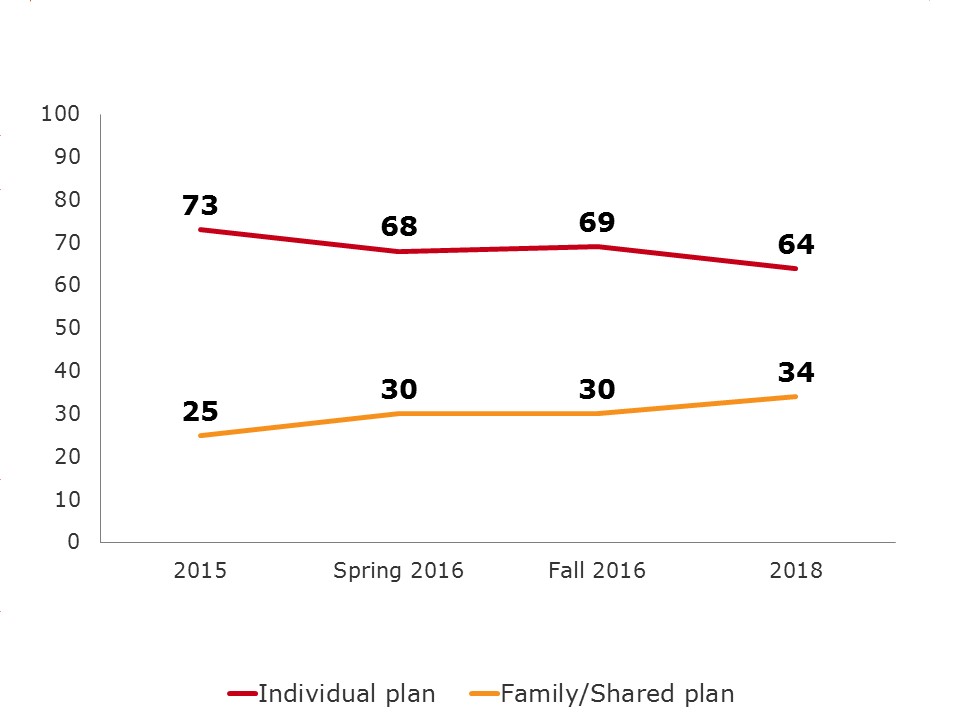
Individual or Family/Shared Plan
Canadians are increasingly taking advantage of family/shared plans. Since 2015, there has been a significant increase in the use of family/shared plans (up 9%) with the majority of these plans shared by 2 people (56% vs. 7-19%).
Exhibit 4.7.1.c. Individual or family/shared plan
Individual or family/shared plan - text version
QB1a. Is it an individual plan or a family or shared plan?
Base: Respondents who own a cell phone, 2018 (n=1,111), fall 2016 (n=1,277)
QB9a. About the contract or plan for your personal wireless device…Is it an individual plan or a family plan?
Base: Total Respondents winter 2016 (n=925), 2015 (n=1,005)
Exhibit 4.7.1.d. Number of family members sharing the plan
| Number of family members sharing the plan |
Total |
|---|---|
| Base=actual | (368) % |
| 2 | 56 |
| 3 | 19 |
| 4 | 17 |
| 5+ | 7 |
QWC2. How many family members are on your shared plan?
Where the Fall 2016 results showed a prevalence for family plans amongst middle aged Canadians as well as higher income families, it is not the case in 2018. All demographic groups now equally opt for family or shared plans. We do however find that those with family plans are more likely to have made a complaint in the last 12 months than not (43% vs. 32%). The reverse is also true, those who have made a compliant in the last 12 months are more likely to have a family plan compared to those who have not complained (23% vs. 16%).
Exhibit 4.7.1.e. Individual or family/shared plan by complaint
| Individual or family/shared plan | Total (A) |
Complaints | |
|---|---|---|---|
| Yes (S) |
No (T) |
||
| Base=actual | (1,111) % |
(183) % |
(925) % |
| Individual plan | 64 | 56 | 66 |
| Family/shared plan | 34 | 43 T | 32 |
QB1a. Is it an individual plan or a family or shared plan?
Note: Letters denote statistically significant difference. For example, if there is a B then the result is significantly higher than the corresponding result in column B.
Promotion through Employer or Association
Only a very small proportion of cell phone plans continue to be part of a promotion through an employer or association (7%). Those aged 35-54 are more likely to have a promotion through an employer or association compared to older Canadians (10% vs. 5%) which is probably due to more people in this age group being employed and thus having access to an employee purchase plan. Cell phone owners with a university degree or higher continue to be more likely to have these types of plans (11% vs. 4-5%) as is still the case for those with a higher household income i.e. $100k or more (12-17% vs. 2-6%).
Exhibit 4.4.1.f. Promotion through employer or association
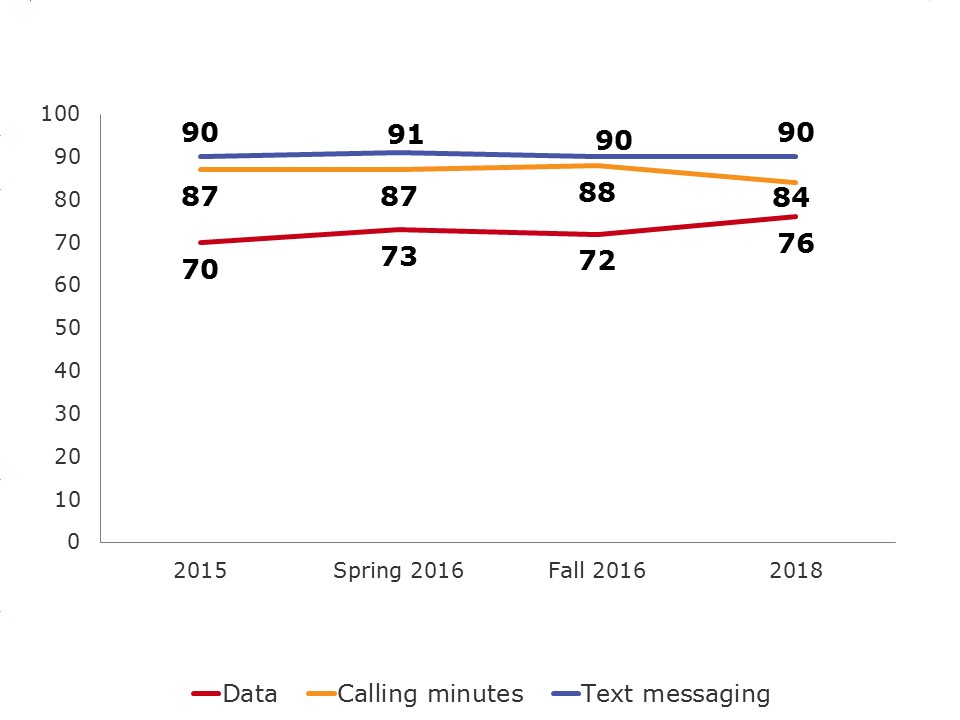
Promotion through employer or association - text version
QB1d. Is your plan part of a promotion through your employer or an association you belong to, sometimes also called an employee purchase plan?
Base: Respondents who own a cell phone, 2018 (n=1,111), fall 2016 (n=1,277)
QB9d. And finally, is your plan part of a promotion through your employer or an association you belong to, sometimes also called an employee purchase plan?
Base: Total Respondents winter 2016 (n=925), 2015 (n=1,005)
Exhibit 4.7.1.e. Promotion through employer or association by age and education
| Promotion through employer or association | Total (A) |
Age | Education | ||||
|---|---|---|---|---|---|---|---|
| 18-34 (D) |
35-54 (E) |
55+ (F) |
High school or less (P) |
College (Q) |
University or more (R) |
||
| Base=actual | (1,111) % |
(141) % |
(359) % |
(594) % |
(278) % |
(314) % |
(501) % |
| Yes | 7 | 8 | 10 F | 5 | 4 | 5 | 11 PQ |
| No | 91 | 92 | 89 | 93 | 95 R | 94 R | 88 |
QB1d. Is your plan part of a promotion through your employer or an association you belong to, sometimes also called an employee purchase plan?
Note: Letters denote statistically significant difference. For example, if there is a B then the result is significantly higher than the corresponding result in column B.
Exhibit 4.7.1.f. Promotion through employer or association by income
| Promotion through employer or association | Total (A) |
Income | ||||
|---|---|---|---|---|---|---|
| <$40K (E) |
$40K- <$60K (F) |
$60K- <$100K (G) |
$100K- <$150K (H) |
$150K+ (I) |
||
| Base=actual | (1,111) % |
(199) % |
(168) % |
(261) % |
(163) % |
(141) % |
| Yes | 7 | 2 | 3 | 6 | 12 EF | 17 EFG |
| No | 91 | 96 I | 97 HI | 93 I | 88 | 82 |
QB1d. Is your plan part of a promotion through your employer or an association you belong to, sometimes also called an employee purchase plan?
Note: Letters denote statistically significant difference. For example, if there is a B then the result is significantly higher than the corresponding result in column B.
Minutes, Texts and Data
The composition of service features on wireless plans has remained relatively stable. The majority of cell phone plans include text messaging (90%), calling minutes (84%), and data (76%).
Very little movement has been seen since 2015 regarding the composition of service features on wireless plans. Text messaging (90% vs. 90% in 2015), calling minutes (84% vs. 87% in 2015), and to a somewhat greater extent, data (76% vs. 70% in 2015), are all included in the majority of cell phone plans.
Exhibit 4.7.2.a. Service features
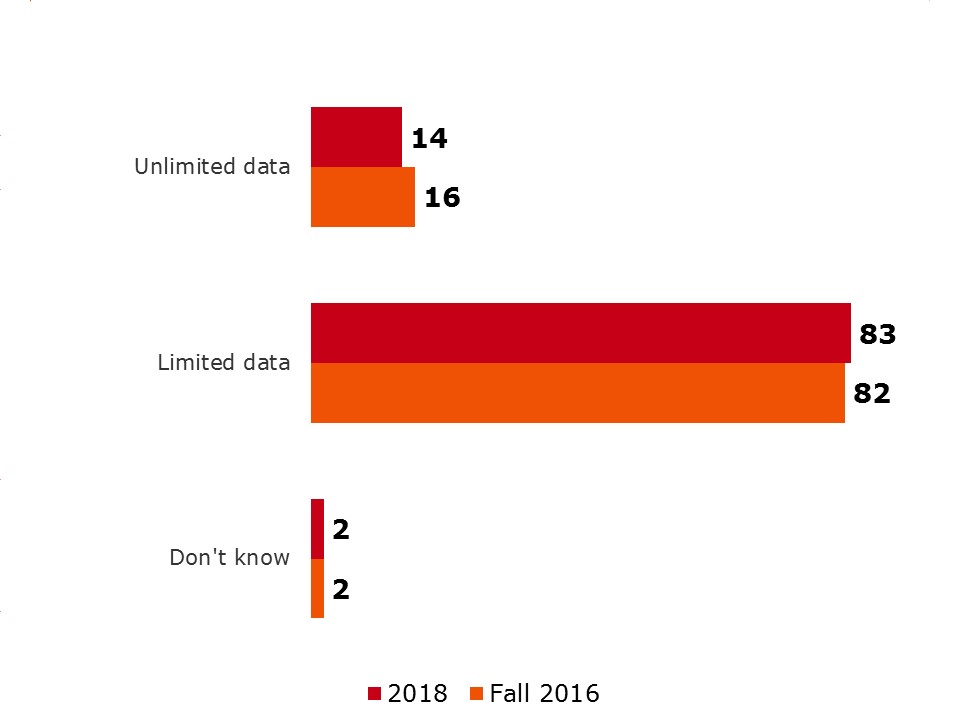
Service features - text version
QB2a. Which of the following are included in your wireless plan?
Base: Respondents who own a cell phone, 2018 (n=1,111), fall 2016 (n=1,277)
QB9c1. Are Calling minutes included as part of your plan?
QB9c2. Is Text messaging included as part of your plan?
QB9c3. Is Data included as part of your plan?
Base: Total Respondents winter 2016 (n=925), 2015 (n=1,005)
Not unexpectedly, younger Canadians (18-54) are more likely to have text (96% vs. 80%), calling minutes (85% vs. 80%) and data (83-87% vs. 60%) included in their wireless plan. Similarly, Canadians with a higher education are more likely to have all 3 features compared to those with high school or less (text: 93-94% vs. 82%; minutes: 84-87% vs. 78%; data: 78-81% vs. 65%).
Results also suggest that English speaking Canadians are more likely to have data services in their wireless plan (78% vs. 69%).Higher income households ($150k+) are also more likely than lower income households (under $100k) to have calling minutes (93% vs. 80-82%), text messages (97% vs. 81-89%) and data (95% vs. 61-73%). In fact, the likelihood of service inclusion for all 3 (text, minutes and data) increases with household income.
Family plans continue to be more likely than individual plans to have text and data (text 95% vs. 89%; data 92% vs. 68%) and monthly plans are more likely to have all 3 services compared to pre-paid plans (text: 93% vs. 70%; data: 82% vs. 27%; minutes:86% vs. 65%) while tab contracts are more likely to have both text messages and data included (97% vs. 89% and 88% vs. 71% respectively).
Exhibit 4.7.2.b. Service features by age, education and language
| Service features | Total (A) |
Age | Education | Language | ||||||
|---|---|---|---|---|---|---|---|---|---|---|
| 18-34 (D) |
35-54 (E) |
55+ (F) |
High school or less (P) |
College (Q) |
University or more (R) |
English (B) |
French (C) |
Other (D) |
||
| Base=actual | (1,111) % |
(141) % |
(359) % |
(594) % |
(278) % |
(314) % |
(501) % |
(741) % |
(219) % |
(144) % |
| ANY (NET) | 97 | 100 F | 99 F | 93 | 93 | 98 P | 99 P | 97 | 95 | 99 |
| Calling minutes | 84 | 88 F | 85 | 80 | 78 | 84 | 87 P | 86 | 80 | 82 |
| Text messages | 90 | 96 F | 96 F | 80 | 82 | 94 P | 93 P | 91 | 86 | 92 |
| Data | 76 | 83 F | 87 F | 60 | 65 | 78 P | 81 P | 78 C | 69 | 77 |
| No/Don’t know | 3 | - | 1 | 7 DE | 7 QR | 2 | 1 | 3 | 5 | 1 |
QB2a. Which of the following are included in your wireless plan?
Note: Letters denote statistically significant difference. For example, if there is a B then the result is significantly higher than the corresponding result in column B.
Exhibit 4.7.2.c. Service features by income and plan
| Service features | Total (A) |
Income | Plan | |||||
|---|---|---|---|---|---|---|---|---|
| <$40K (E) |
$40K- <$60K (F) |
$60K- <$100K (G) |
$100K- <$150K (H) |
$150K+ (I) |
Family (J) |
Individual(K) | ||
| Base=actual | (1,111) % |
(199) % |
(168) % |
(261) % |
(163) % |
(141) % |
(368) % |
(713) % |
| ANY (NET) | 97 | 92 | 97 | 99 E | 99 E | 99 E | 99 | 97 |
| Calling minutes | 84 | 80 | 82 | 86 | 90 | 93 EF | 86 | 83 |
| Text messages | 90 | 81 | 89 | 93 E | 96 E | 97 EF | 95 K | 89 |
| Data | 76 | 61 | 73 | 75 E | 92 EFG | 95 EFG | 92 K | 68 |
| No/Don’t know | 3 | 8 GHI | 3 | 1 | 1 | 1* | 1 | 3 |
QB2a. Which of the following are included in your wireless plan?
Note: Letters denote statistically significant difference. For example, if there is a B then the result is significantly higher than the corresponding result in column B.
Exhibit 4.7.2.d. Service features by wireless plans and tab contracts
| Service features | Total (A) |
Wireless plans | Tab Contracts | ||
|---|---|---|---|---|---|
| Family (J) |
Individual (K) |
Yes (B) |
No (C) |
||
| Base=actual | (1,111) % |
(384) % |
(715) % |
(293) % |
(744) % |
| ANY (NET) | 97 | 99 | 97 | 100 C | 96 |
| Calling minutes | 84 | 86 | 83 | 85 | 84 |
| Text messages | 90 | 95 K | 89 | 97 C | 89 |
| Data | 76 | 92 K | 68 | 88 C | 71 |
| No/Don’t know | 3 | 1 | 3 | 0 | 4 |
QB2a. Which of the following are included in your wireless plan?
Note: Letters denote statistically significant difference. For example, if there is a B then the result is significantly higher than the corresponding result in column B.
Limited or Unlimited Data
Most Canadians (83%) with data included in their wireless plan have limited amounts of data. This is most likely a function of market availability rather than consumer choice, especially given the relationship between unlimited data and improved perceptions related to clarity of contracts noted earlier in the report.
Exhibit 4.7.2.d. Plan includes limited or unlimited data
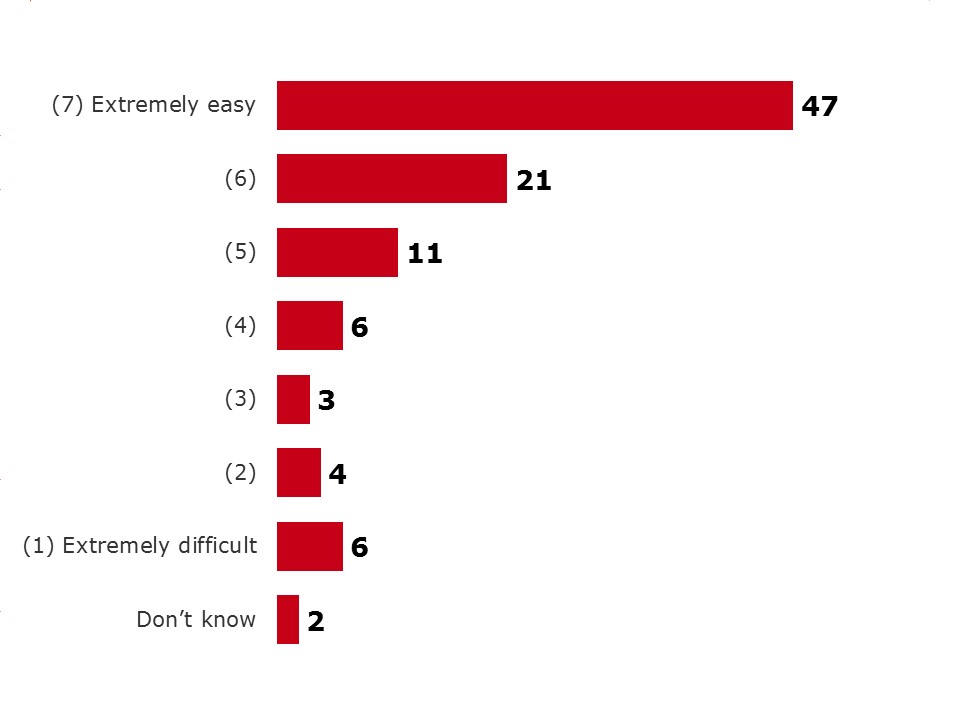
Plan includes limited or unlimited data - text version
QB4. Some wireless plans have unlimited data and some include limited data. When a plan includes limited data, you may have to pay data overage fees if you use more data in a month than is included in your plan.
Does your plan include unlimited data or limited data?
Base: Respondents who have data included in the wireless plan, 2018 (n=796), fall 2016 (n=831)
Middle aged Canadians (35-54) are more likely than older Canadians (55+) to have limited data (86% vs. 79%).
Exhibit 4.7.2.e. Plan includes limited or unlimited data by age
| Plan include limited or unlimited data | Total (A) |
Age | ||
|---|---|---|---|---|
| 18-34 (D) |
35-54 (E) |
55+ (F) |
||
| Base=actual | (796) % |
(120) % |
(313) % |
(353) % |
| Unlimited data | 14 | 15 | 13 | 16 |
| Limited data | 83 | 81 | 86 F | 79 |
QB4. Some wireless plans have unlimited data and some have limited data. When a plan includes limited data, you may have to pay data overage fees if you use more data in a month than is included in your plan. Does your plan include unlimited data or limited data?
Note: Letters denote statistically significant difference. For example, if there is a B then the result is significantly higher than the corresponding result in column B.
Tab Contract
One in three wireless plans include a tab balance (29%). Men are more likely to have a tab contract than women (34% vs. 24%) as are younger Canadians (18-54) (33-35% vs. 21%)[6].
Canadians residing in Quebec are also more likely to have a tab balance compared to those residing in the rest of Canada (40% vs. 24-26%). Within the Prairies, this is also the case for those residing in Alberta compared to Manitoba (35% vs. 14%).
Exhibit 4.7.3.a. Plan includes tab balance by gender and age
| Plan includes a tab balance |
Total (A) |
Gender | Age | |||
|---|---|---|---|---|---|---|
| Male (B) |
Female (C) |
18-34 (D) |
35-54 (E) |
55+ (F) |
||
| Base=actual | (1,111) % |
(526) % |
(585) % |
(141) % |
(359) % |
(594) % |
| Yes | 29 | 34 C | 24 | 35 F | 33 F | 21 |
| No | 65 | 62 | 68 | 60 | 62 | 70 E |
| Don’t know | 6 | 5 | 8 | 5 | 5 | 9 |
QWC3. And, does your plan include a tab balance?
Note: Letters denote statistically significant difference. For example, if there is a B then the result is significantly higher than the corresponding result in column B.
Exhibit 4.7.3.b. Plan includes tab balance by region
| Plan includes a tab balance |
Total (A) |
Region | |||||
|---|---|---|---|---|---|---|---|
| Atl (G) |
Que (H) |
Ont (I) |
Pra (J) |
BC (K) |
Terr (O) |
||
| Base=actual | (1,111) % |
(102) % |
(224) % |
(301) % |
(310) % |
(126) % |
(48) % |
| Yes | 29 | 27 | 40 IJ | 26 | 24 | 31 | 24 |
| No | 65 | 68 | 56 | 67 | 72 H | 62 | 68 |
| Don’t know | 6 | 6 | 4 | 8 | 4 | 7 | 8 |
QWC3. And, does your plan include a tab balance?
Note: Letters denote statistically significant difference. For example, if there is a B then the result is significantly higher than the corresponding result in column B.
Phone included or BYOD
Three out of five Canadian wireless plans include a phone that was sold at a reduced price (59%). This is particularly true for younger cell phone owners (18-54) (62-64% vs. 50%) and those residing in Quebec (69%), compared to Ontario, the Territories and B.C. (48-55%). Francophones are also more likely to have a discounted device compared to English speaking Canadians as well as those who speak another language (71% vs. 49-58%).
Exhibit 4.7.3.c. Phone included with contract
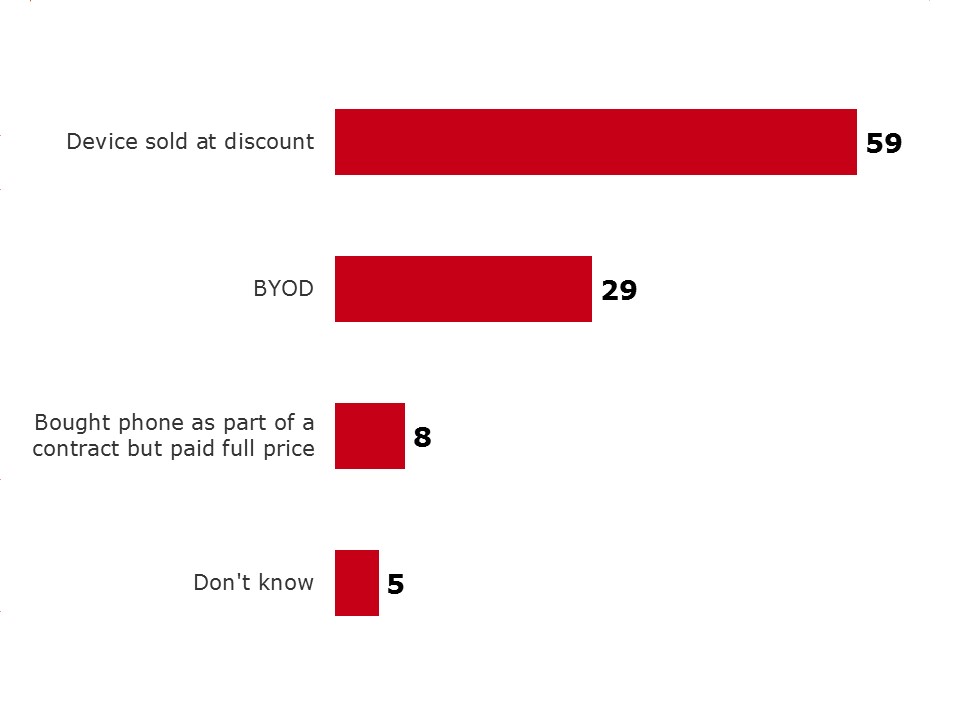
Phone included with contract - text version
WC4. And does your plan include a phone that was sold to you at a reduced price as part of your contract or did you bring your own device also known as a BYOD plan?
Base: Total respondents who own a cell phone, 2018 (n=1,111)
Family plans are more likely to have a discounted device as part of the plan (69% vs. 54%), as is the case with tab contracts (76% vs. 51%) and as can be expected, those with pre-paid plans are more likely to BYOD (58% vs. 24%).
Exhibit 4.7.3.d. Phone included with contract by age and region
| Phone included with contract |
Total (A) |
Age | Region | |||||||
|---|---|---|---|---|---|---|---|---|---|---|
| 18-34 (D) |
35-54 (E) |
55+ (F) |
Atl (G) |
Que (H) |
Ont (I) |
Pra (J) |
BC (K) |
Terr (O) |
||
| Base=actual | (1,111) % |
(141) % |
(359) % |
(594) % |
(102) % |
(224) % |
(301) % |
(310) % |
(126) % |
(48) % |
| Device sold at discount | 59 | 62 F | 64 F | 50 | 60 | 69 IKO | 55 | 59 | 51 | 48 |
| BYOD | 29 | 25 | 26 | 33 E | 25 | 27 | 31 | 23 | 32 | 39 J |
| Bought phone as part of a contract but paid full price | 8 | 8 | 7 | 9 | 10 H | 2 | 8 H | 11 H | 12 H | 8 |
| Don’t know | 5 | 5 | 2 | 8 E | 5 | 3 | 6 | 7 | 5 | 5 |
QWC4. And does your plan include a phone that was sold to you at a reduced price as part of your contract or did you bring your own device also known as a BYOD plan?
Note: Letters denote statistically significant difference. For example, if there is a B then the result is significantly higher than the corresponding result in column B.
Exhibit 4.7.3.e. Phone included with contract by language, plan, tab contracts
| Phone included with contract |
Total (A) |
Language | Plan | Tab contract | ||||
|---|---|---|---|---|---|---|---|---|
| English (B) |
French (C) |
Other (D) |
Family (J) |
Individual (K) |
Yes (B) |
No (C) |
||
| Base=actual | (1,111) % |
(741) % |
(219) % |
(144) % |
(368) % |
(713) % |
(293) % |
(744) % |
| Device sold at discount | 59 | 58 | 71 BD | 49 | 69 K | 54 | 76 C | 51 |
| BYOD | 29 | 27 | 23 | 37 C | 20 | 32 J | 12 | 36 B |
| Bought phone as part of a contract but paid full price | 8 | 9 C | 2 | 10 C | 7 | 8 | 7 | 8 |
| Don’t know | 5 | 6 | 4 | 4 | 4 | 5 | 5 | 5 |
QWC4. And does your plan include a phone that was sold to you at a reduced price as part of your contract or did you bring your own device also known as a BYOD plan?
Note: Letters denote statistically significant difference. For example, if there is a B then the result is significantly higher than the corresponding result in column B.
Exhibit 4.7.3.f. Phone included with contract by wireless plan and income
| Phone included with contract |
Total (A) |
Wireless plans | Income | |||||
|---|---|---|---|---|---|---|---|---|
| Post-paid (L) |
Pre-paid (M) |
<$40K (E) |
$40K- <$60K (F) |
$60K- <$100K (G) |
$100K- <$150K (H) |
$150K+ (I) |
||
| Base=actual | (1,111) % |
(953) % |
(128) % |
(199) % |
(168) % |
(261) % |
(163) % |
(141) % |
| Device sold at discount | 59 | 63 M | 31 | 52 | 59 | 57 | 69 E | 65 |
| BYOD | 29 | 24 | 58 L | 25 | 27 | 34 | 23 | 27 |
| Bought phone as part of a contract but paid full price | 8 | 8 | 4 | 12 | 7 | 7 | 5 | 6 |
| Don’t know | 5 | 5 | 7 | 10 GI | 6 | 2 | 3 | 2 |
QWC4. And does your plan include a phone that was sold to you at a reduced price as part of your contract or did you bring your own device also known as a BYOD plan?
Note: Letters denote statistically significant difference. For example, if there is a B then the result is significantly higher than the corresponding result in column B.
Unlocked Phone
The Wireless Code now includes rules that will ensure that customers will be provided with unlocked devices. Currently one in three Canadians still have a locked cell phone (32%) which is most likely due to contracts having been entered into before the changes to the Wireless Code were implemented in 2017. There is also a surprisingly large number of Canadians who do not know if they have a locked or unlocked phone (22%) suggesting some education around this issue may be required.
Exhibit 4.7.3.g. Unlocked phone
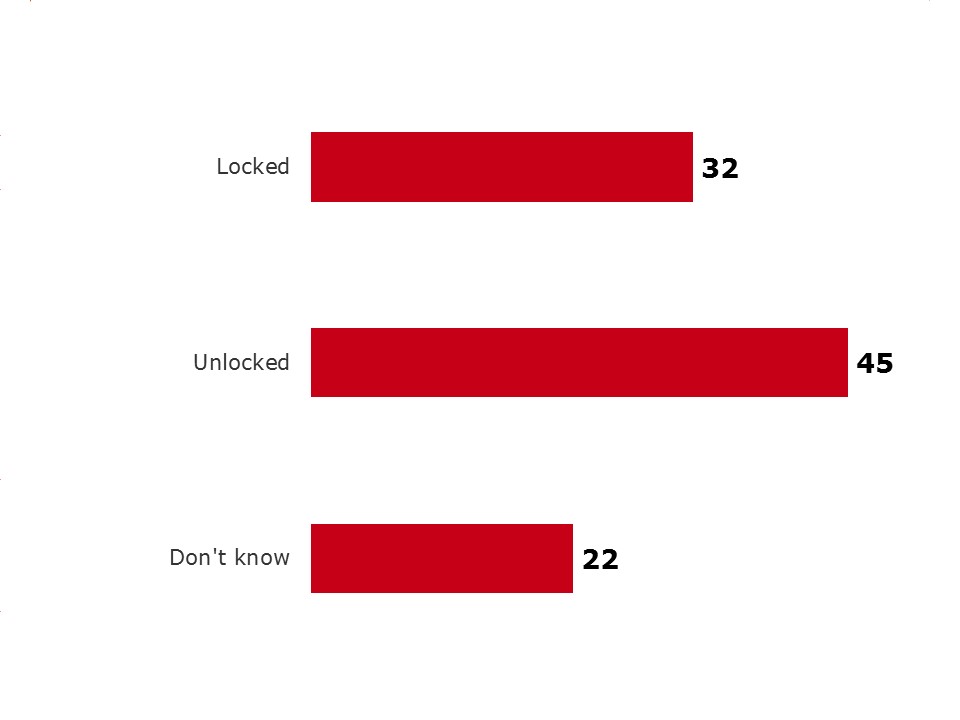
WC5. The Wireless Code now prevents service providers from charging a fee to unlock your phone and requires service providers to sell new phones unlocked. Is your phone locked or unlocked?
Base: Total respondents who own a cell phone, 2018 (n=1,111)
There are a number of demographics that seem to play a role in whether or not a person has a locked phone. More specifically, age and income. Locked phones are more prevalent among younger Canadians (18-54) (35-38% vs. 27%) and interestingly, high income earners ($100k+) are more likely to have locked phones than those with a household income of less than $40k (39-41% vs. 25%).
Canadians who opted for a wireless plan where the device is sold at discount are more likely to have a locked phone than an unlocked one (68% vs. 50%) and those who made use of BYOD are more likely to have an unlocked phone (37% vs. 19%).
The type of plan one has also seems to factor into whether or not one has a locked phone. Canadians with family plans are more likely to have a locked phone (39% vs. 29%) as are those with monthly wireless plans (39% vs. 14%) and employee purchase plans (47% vs. 32%).
Exhibit 4.7.3.h. Unlocked phone by age and income
| Unlocked phone | Age | Income | |||||||
|---|---|---|---|---|---|---|---|---|---|
| Total (A) |
18-34 (D) |
<$40K (E) |
<$40K (E) |
<$40K (E) |
$40K- <$60K (F) |
$60K- <$100K (G) |
$100K- <$150K (H) |
$150K+ (I) |
|
| Base=actual | (1,111) % |
(141) % |
(199) % |
(199) % |
(199) % |
(168) % |
(261) % |
(163) % |
(141) % |
| Locked | 32 | 38 F | 25 | 25 | 25 | 36 | 32 | 39 E | 41 E |
| Unlocked | 45 | 45 | 49 | 49 | 49 | 43 | 49 | 41 | 43 |
| Don’t know | 22 | 17 | 26 | 26 | 26 | 21 | 19 | 21 | 16 |
QWC5. The Wireless Code now prevents service providers from charging a fee to unlock your phone and requires service providers to sell new phones unlocked. Is your phone locked or unlocked?
Note: Letters denote statistically significant difference. For example, if there is a B then the result is significantly higher than the corresponding result in column B.
Exhibit 4.7.3.i. Unlocked phone by wireless plan, employee plan and plan
| Unlocked phone | Total (A) |
Wireless plans | Employee plan | Plan | |||
|---|---|---|---|---|---|---|---|
| Monthly (L) |
Pre-paid (M) |
Yes (N) |
No (O) |
Family (J) |
Individual (K) |
||
| Base=actual | (1,111) % |
(953) % |
(128) % |
(70) % |
(1,025) % |
(368) % |
(713) % |
| Locked | 32 | 35 M | 14 | 47 O | 32 | 39 K | 29 |
| Unlocked | 45 | 42 | 68 L | 32 | 47 | 43 | 47 |
| Don’t know | 22 | 23 | 18 | 21 | 22 | 18 | 24 |
QWC5. The Wireless Code now prevents service providers from charging a fee to unlock your phone and requires service providers to sell new phones unlocked. Is your phone locked or unlocked?
Note: Letters denote statistically significant difference. For example, if there is a B then the result is significantly higher than the corresponding result in column B.
In September 2017, a Television Service Provider (TVSP) Code came into effect establishing guidelines for television service providers. The TVSP Code ensures that television consumers are empowered to make informed decisions and that there is a more competitive wireless marketplace. Not surprisingly, since it was only introduced a few months ago, more than half of (56%) Canadians do not recall hearing or seeing anything about this code.
Exhibit 4.8.1.a. Recall of TV Service Provider Code
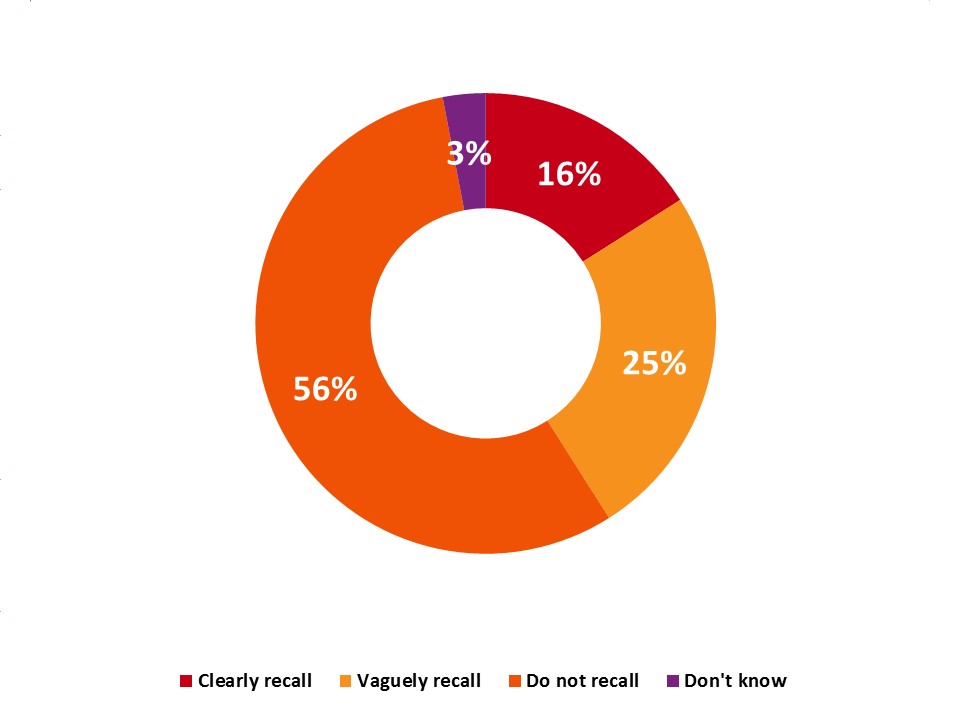
Recall of TV Service Provider Code - text version
TVSP1. In September 2017, a Television Service Provider Code came into effect establishing guidelines for television service providers. The Code ensures that television consumers are empowered to make informed decisions and that there is a more competitive wireless marketplace. To what extent, if any would you say you recall hearing or seeing anything about this Code? Would you say you clearly recall, vaguely recall or do not recall?
Base: Total respondents who subscribe to a TV service, 2018 (n=1,096)
Demographics play a role in recall of the TVSP Code. Canadians aged 18-34 are the least aware of the TVSP Code (67% vs. 52-53%) while those with a higher education (i.e. university degree or higher) are more likely to clearly recall hearing or seeing anything about the TVSP Code (20% vs. 12-15%). Canadians with a lower income (under $60k) are more likely to not recall hearing about the TVSP Code when compared to those who earn $150k or more (57-63% vs. 42%). Not surprising, the more informed a person is about the CRTC, the more likely they are to recall the TVSP Code (please refer to Exhibit 4.8.1.c).
Exhibit 4.8.1.b. Recall of TV Service Provider Code by age and education
| Level of ease of understanding of wireless contract | Total (A) |
Age | Education | ||||
|---|---|---|---|---|---|---|---|
| 18-34 (D) |
35-54 (E) |
55+ (F) |
High school or less (P) |
College (Q) |
University or more (R) |
||
| Base=actual | (1,096) % |
(94) % |
(313) % |
(673) % |
(323) % |
(292) % |
(465) % |
| Clearly recall | 16 | 6 | 18 D | 20 D | 12 | 15 | 20 P |
| Vaguely recall | 25 | 25 | 26 | 25 | 21 | 25 | 30 P |
| Do not recall | 56 | 67 EF | 53 | 52 | 64 R | 57 | 49 |
QTVSP1. In September 2017, a Television Service Provider Code came into effect establishing guidelines for television service providers. The Code ensures that television consumers are empowered to make informed decisions and that there is a more competitive wireless marketplace. To what extent, if any would you say you recall hearing or seeing anything about this Code? Would you say you clearly recall, vaguely recall or do not recall?
Note: Letters denote statistically significant difference. For example, if there is a B then the result is significantly higher than the corresponding result in column B.
Exhibit 4.8.1.c. Recall of TV Service Provider Code by income and CRTC role
| Level of ease of understanding of wireless contract |
Total (A) |
Income | Informed role of CRTC | |||||||
|---|---|---|---|---|---|---|---|---|---|---|
| <$40K (E) |
$40K- <$60K (F) |
$60K- <$100K (G) |
$100K- <$150K (H) |
$150K+ (I) |
Very well (K) |
Well (L) |
Not very well (M) |
Not (N) |
||
| Base=actual | (1,096) % |
(217) % |
(174) % |
(241) % |
(153) % |
(135) % |
(67) % |
(292) % |
(456) % |
(258) % |
| Clearly recall | 16 | 13 | 14 | 20 | 15 | 20 | 37 MN | 28 MN | 14 N | 5 |
| Vaguely recall | 25 | 20 | 25 | 21 | 32 E | 37 EG | 31 N | 30 N | 29 N | 16 |
| Do not recall | 56 | 63I | 57 I | 56 | 51 | 42 | 30 | 40 | 54 KL | 76 KLM |
QTVSP1. In September 2017, a Television Service Provider Code came into effect establishing guidelines for television service providers. The Code ensures that television consumers are empowered to make informed decisions and that there is a more competitive wireless marketplace. To what extent, if any would you say you recall hearing or seeing anything about this Code? Would you say you clearly recall, vaguely recall or do not recall?
Note: Letters denote statistically significant difference. For example, if there is a B then the result is significantly higher than the corresponding result in column B.
At an overall level, Canadians claim to find their TV contracts clear and easy to understand (57%) (rated 5, 6 or 7 on a scale from 1-7) with only a small portion (23%) (rated 1, 2 or 3 on a scale from 1-7) finding it difficult to understand.
Exhibit 4.8.2.a. Clarity of TV Contracts
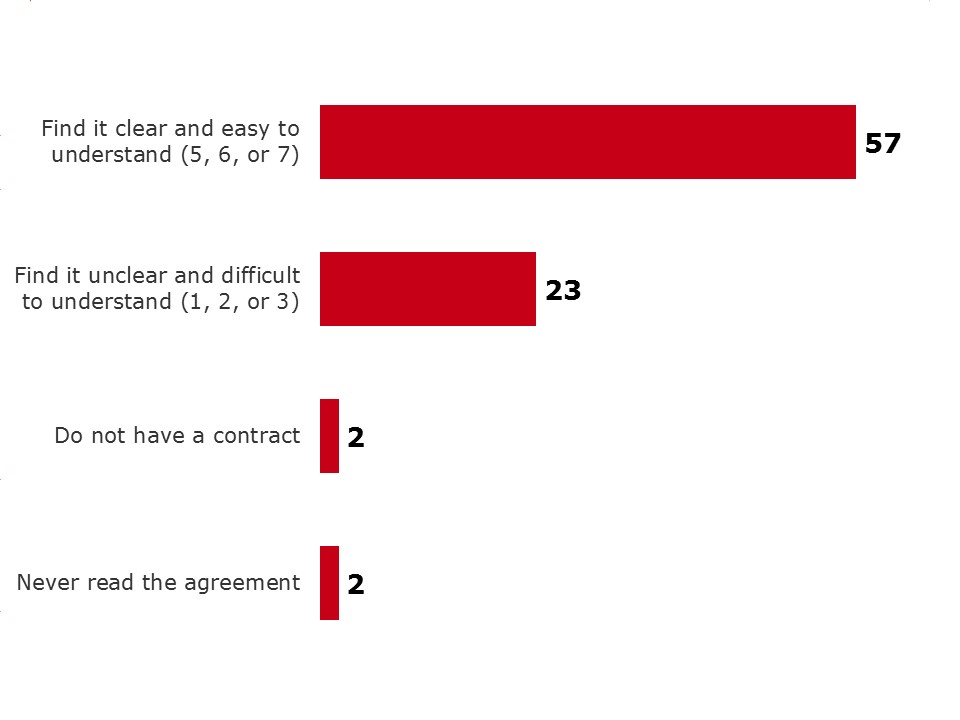
Clarity of TV Contracts - text version
TVSP2. To what extent do you find your TV contract clear and easy to understand? Please use a 7-point scale where 1 means extremely unclear and difficult to understand and 7 means extremely clear and easy to understand.
Base: Total respondents who subscribe to a TV service, 2018 (n=1,096)
As was the case with wireless contracts and the ease of understanding them, demographics play a role. Canadians with a lower education level (i.e. High school or less) find their contracts to be easier than those with a College or University education (67% vs. 52-54%). Again, one would ask a question about the perception of understanding versus truly understanding the content of the contract.
Those who reside in Quebec find their contracts easier to understand than those who reside in other regions (67% vs. 49-64%). Not surprising then, Francophones also find their contracts clearer than Anglophones (63% vs. 52%).
A positive result is that those who are very well informed of the role of the CRTC are more likely to report an easy to understand TV contract than those who are not informed of the CRTC’s role (71% vs. 51%). This implies that the well informed probably made use of the information provided by the CRTC which, in turn, resulted in their contracts being perceived as clearer and easier.
Exhibit 4.8.2.b. Clarity of TV Contracts by Region and Education
Clarity of TV contracts |
Total (A) |
Region | Education | |||||||
|---|---|---|---|---|---|---|---|---|---|---|
| Atl (G) |
Que (H) |
Ont (I) |
Pra (J) |
BC (K) |
Terr (O) |
High school or less (P) |
College (Q) |
University or more (R) |
||
| Base=actual | (1,096) % |
(97) % |
(256) % |
(274) % |
(310) % |
(130) % |
(29) % |
(323) % |
(292) % |
(465) % |
| Find it clear and easy to understand (5, 6, or 7) | 57 | 64 I | 67 IK | 49 | 57 | 50 | 55 | 67 QR | 52 | 54 |
| Find it unclear and difficult to understand (1, 2, or 3) |
23 | 19 | 20 | 26 | 23 | 28 | 17 | 15 | 27 P | 26 P |
QTVSP2. To what extent do you find your TV contract clear and easy to understand? Please use a 7-point scale where 1 means extremely unclear and difficult to understand and 7 means extremely clear and easy to understand.
Note: Letters denote statistically significant difference. For example, if there is a B then the result is significantly higher than the corresponding result in column B.
Exhibit 4.8.2.c. Clarity of TV Contracts by language and income
| Clarity of TV contracts | Total (A) |
Language | ||
|---|---|---|---|---|
| English (B) |
French (C) |
Other (D) |
||
| Base=actual | (1,096) % |
(712) % |
(248) % |
(129) % |
| Find it clear and easy to understand (5, 6, or 7) | 57 | 52 | 63 B | 62 |
| Find it unclear and difficult to understand (1, 2, or 3) | 23 | 24 | 23 | 22 |
QTVSP2. To what extent do you find your TV contract clear and easy to understand? Please use a 7-point scale where 1 means extremely unclear and difficult to understand and 7 means extremely clear and easy to understand.
Note: Letters denote statistically significant difference. For example, if there is a B then the result is significantly higher than the corresponding result in column B.
Exhibit 4.8.2.d. Clarity of TV Contracts by CRTC role
| Clarity of TV contracts | Total (A) |
Informed role of CRTC | |||
|---|---|---|---|---|---|
| Very well (K) | Well (L) |
Not very well (M) |
Not (N) |
||
| Base=actual | (1,096) % |
(67) % |
(292) % |
(456) % |
(258) % |
| Find it clear and easy to understand (5, 6, or 7) | 57 | 71 N | 61 | 55 | 51 |
| Find it unclear and difficult to understand (1, 2, or 3) | 23 | 16 | 21 | 23 | 26 |
QTVSP2. To what extent do you find your TV contract clear and easy to understand? Please use a 7-point scale where 1 means extremely unclear and difficult to understand and 7 means extremely clear and easy to understand.
Note: Letters denote statistically significant difference. For example, if there is a B then the result is significantly higher than the corresponding result in column B.
The TVSP Code requires television service providers to ensure that customers are aware of the availability, price and content of their entry-level service offering (i.e. basic service package). One in two TV service subscribers believe they were informed of this (54%) while one in three (33%) do not believe they were informed even though service providers were required to inform new and old clients, regardless of when their contracts were signed.
Exhibit 4.8.3.a. Awareness of Basic Service Package
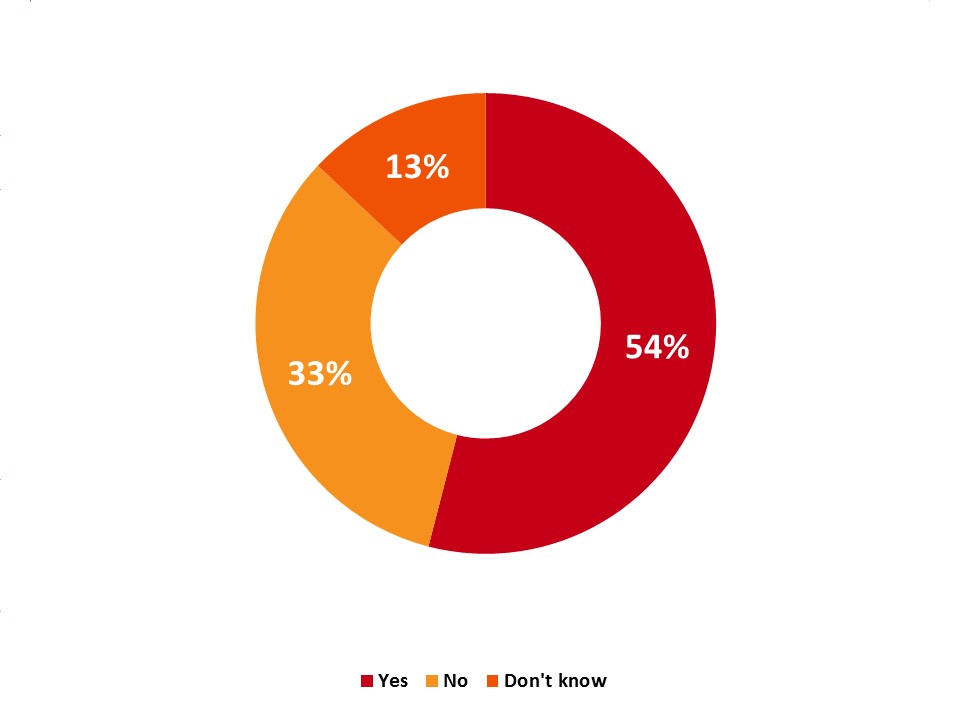
Awareness of Basic Service Package - text version
TVSP4. The TVSP Code requires television service providers to ensure that customers are aware of the availability, price and content of their entry-level service offering, also known as the basic service package. Has your service provider informed you about their entry-level offering? This may have been by email, on the phone or via your monthly billing?
Base: Base: Total respondents who subscribe to a TV service, 2018 (n=1,096)
Exhibit 4.8.3.b. Awareness of Basic Service Package by region
| Clarity of TV contracts | Total (A) |
Region | |||||
|---|---|---|---|---|---|---|---|
| Atl (G) |
Que (H) |
Ont (I) |
Pra (J) |
BC (K) |
Terr (O) |
||
| Base=actual | (1,096) % |
(97) % |
(256) % |
(274) % |
(310) % |
(130) % |
(29) % |
| Informed | 54 | 45 | 67 GIJKLMN | 51 | 49 | 48 | 59 |
| Not informed | 33 | 36 | 26 | 32 | 39 H | 38 H | 36 |
| Don’t know | 13 | 19 | 7 | 17 H | 12 | 14 | 5 |
TVSP4. The TVSP Code requires television service providers to ensure that customers are aware of the availability, price and content of their entry-level service offering, also known as the basic service package. Has your service provider informed you about their entry-level offering? This may have been by email, on the phone or via your monthly billing?
Base: Base: Total respondents who subscribe to a TV service, 2018 (n=1,096)
Note: Letters denote statistically significant difference. For example, if there is a B then the result is significantly higher
than the corresponding result in column B.
Exhibit 4.8.3.c. Awareness of Basic Service Package by language and role of CRTC
| Level of ease of understanding of wireless contract |
Total (A) |
Language | Informed role of CRTC | |||||
|---|---|---|---|---|---|---|---|---|
| English (B) |
French (C) |
Other (D) |
Very well (K) |
Well (L) |
Not very well (M) |
Not (N) |
||
| Base=actual | (1,096) % |
(712) % |
(248) % |
(129) % |
(67) % |
(292) % |
(456) % |
(258) % |
| Clearly recall | 16 | 47 | 67 B | 59 | 68 N | 66 MN | 53 | 43 |
| Vaguely recall | 25 | 37 C | 25 | 27 | 25 | 22 | 32 L | 44 KLM |
| Do not recall | 56 | 15 C | 8 | 13 | 8 | 12 | 15 | 12 |
TVSP4. The TVSP Code requires television service providers to ensure that customers are aware of the availability, price and content of their entry-level service offering, also known as the basic service package. Has your service provider informed you about their entry-level offering? This may have been by email, on the phone or via your monthly billing?
Base: Base: Total respondents who subscribe to a TV service, 2018 (n=1,096)
Note: Letters denote statistically significant difference. For example, if there is a B then the result is significantly higher
than the corresponding result in column B.
Quebecers are more likely to have been made aware of the basic service plan offering (67% vs. 45-59%) compared to other Canadians which corresponds with the higher incidence for Francophones being aware of the basic service package compared to Anglophones (67% vs. 47%).
Again, those who are well informed of the role of the CRTC are also more likely to report that their service providers informed them about their entry-level offering (66-68% vs 53-43%). This might well be due to a higher overall awareness of the CRTC regulations which leads to Canadians taking note of these requirements when dealing with service providers.
The TVSP Code requires television service providers to provide a customer with a timeframe for when a service call to a residence will begin, explain potential charges associated with the service call, and explain how they may cancel or reschedule the service call. This appears to be working quite well as only 14% of Canadians have experienced problems related to service calls.
Exhibit 4.8.4.a. Service Calls
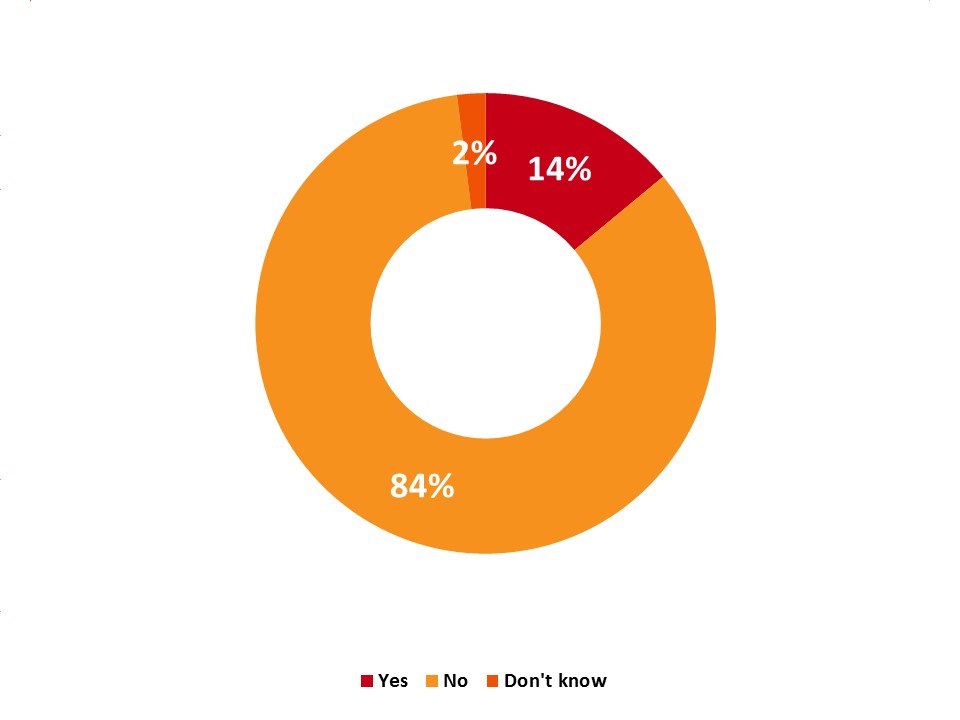
TVSP3. The TVSP Code requires television service providers to provide a customer with a timeframe for when a service call to a residence will begin, explain potential charges associated with the service call, and explain how you may cancel or reschedule the service call. Have you experienced problems related to service calls?
Base: Base: Total respondents who subscribe to a TV service, 2018 (n=1,096)
Service providers are not allowed to change the price of a TV channel or package of channels without informing their customers. This seems to be respected by most TV services providers as most TV subscribers report not having experienced uninformed price changes in the last 12 months (76%).
Exhibit 4.8.5.a. Changes in Price
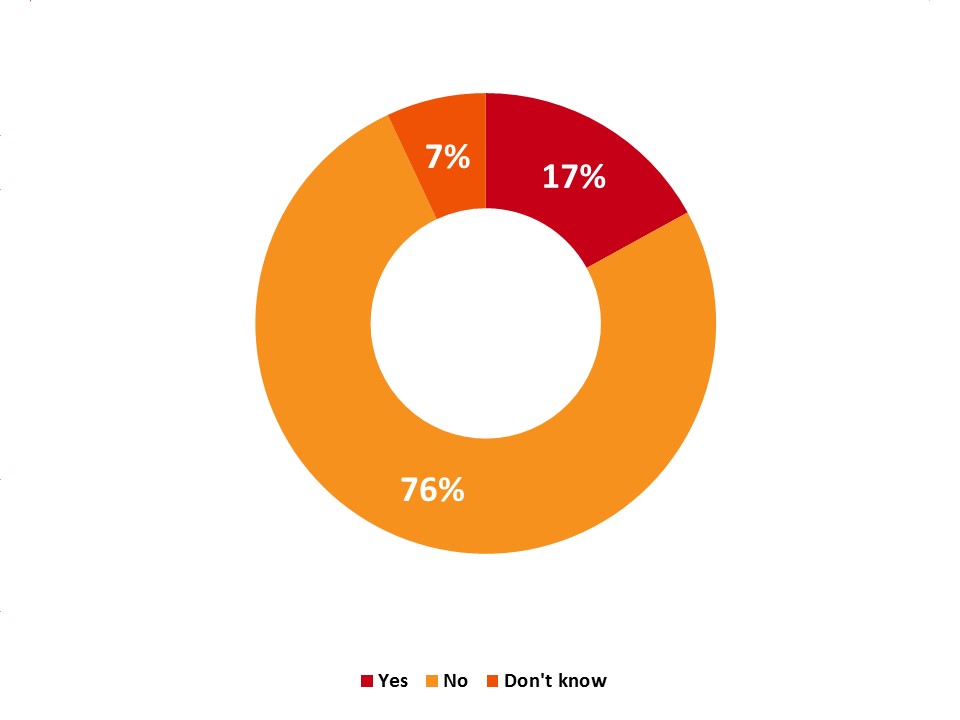
Changes in Price - text version
TVSP5. In the past twelve months, has your TV service provider changed the price of a TV channel or package of channels without informing you in advance?
Base: Base: Total respondents who subscribe to a TV service, 2018 (n=1,096)
Almost one in four (23%) TV subscribers have made a complaint about their TV services in the last 12 months. The nature of these complaints was not explored within the body of this research. Canadians residing in B.C. are most likely to have made a complaint with one in three (34%) reporting having done so. This is well above that reported by Canadians in other regions (15-25%).
Exhibit 4.8.6.a. Complaints
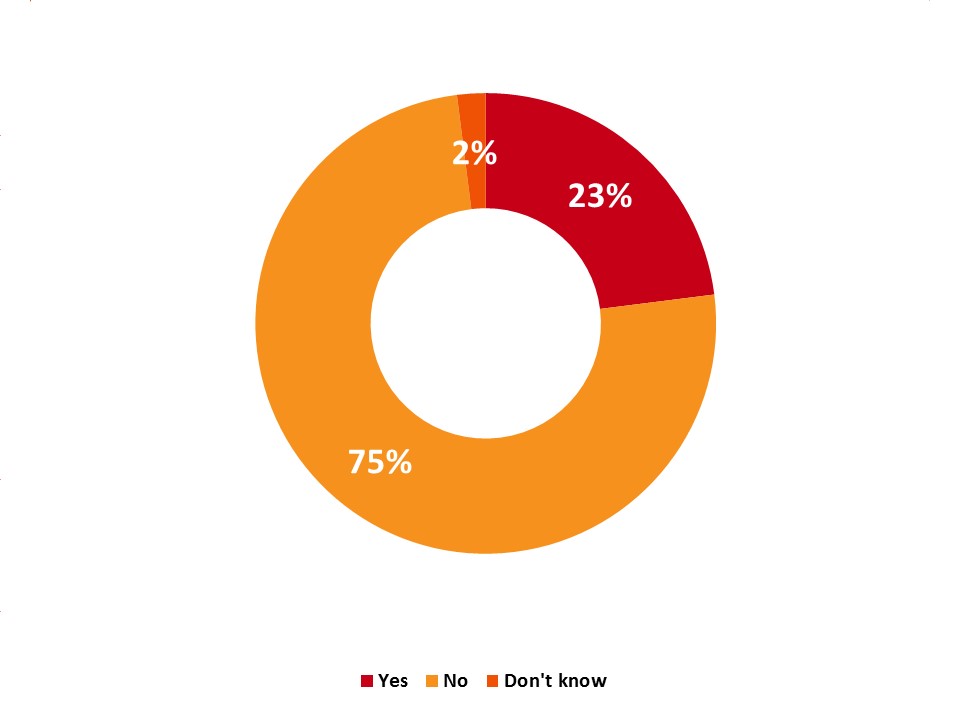
TVSP6. Have you made a complaint about your TV services within the last 12 months?
Base: Base: Total respondents who subscribe to a TV service, 2018 (n=1,096)
Exhibit 4.8.6.b. Complaints by Region
| Complaints about TV service |
Total (A) |
Region | |||||
|---|---|---|---|---|---|---|---|
| Atl (G) |
Que (H) |
Ont (I) |
Pra (J) |
BC (K) |
Terr (O) |
||
| Base=actual | (1,096) % |
(97) % |
(256) % |
(274) % |
(310) % |
(130) % |
(29) % |
| Yes | 23 | 25 | 19 | 25 | 21 | 34 HJ | 15 |
| No | 75 | 73 | 80 K | 72 | 77 K | 66 | 85 |
QTVS6. Have you made a complaint about your TV services within the last 12 months?
Note: Letters denote statistically significant difference. For example, if there is a B then the result is significantly higher than the corresponding result in column B.
Over the past five years, Canadians’ understanding of the mandate and role of the CRTC has declined. In 2014, 38 per cent of Canadians considered themselves informed about the mandate and role of the CRTC while in 2018 only 29 per cent consider themselves informed.
Men continue to be more likely to be well informed of the role of the CRTC (35% vs. 23%) which is also true for the older Canadians (35+) (32-35% vs. 17%).
Quebeckers and Francophones continue to be more likely to consider themselves informed about the mandate and role of the CRTC (35% vs. 23-29% and 38% vs. 20-29% respectively). University educated Canadians as well as high income earners ($150+) are also more likely to consider themselves informed (36% vs. 22-25% and 44% vs. 20-32%).
Exhibit 4.9.1.a. Level of informed with the mandate and role of the CRTC
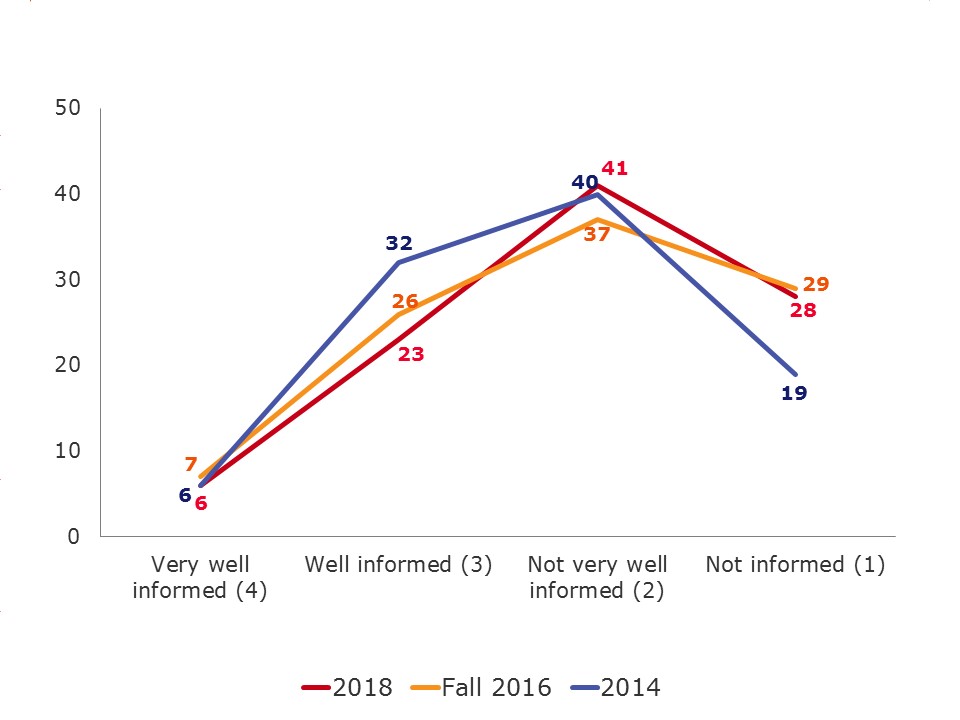
Level of informed with the mandate and role of the CRTC- text version
QC1. Overall, how informed are you about the mandate and role of the CRTC?
Base: Total respondents, 2018 (n=1,345), fall 2016 (n=1,483), 2014 (n=1,289)
Exhibit 4.9.1.b. Level of informed with the mandate and role of the CRTC by Gender and Age
| Level of informed with the mandate and role of the CRTC | Total (A) |
Gender | Age | |||
|---|---|---|---|---|---|---|
| Male (B) |
Female (C) |
18-34 (D) |
35-54 (E) |
55+ (F) |
||
| Base=actual | (1,345) % |
(638) % |
(707) % |
(152) % |
(409) % |
(766) % |
| Informed (4 and 3) |
29 | 35 C | 23 | 17 | 32 D | 35 D |
| Uninformed (2 and 1) |
69 | 64 | 74 B | 81 EF | 67 | 63 |
QC1 Overall, how informed are you about the mandate and role of the CRTC? (READ LIST)
Note: Letters denote statistically significant difference. For example, if there is a B then the result is significantly higher than the corresponding result in column B.
Exhibit 4.9.1.c. Level of informed with the mandate and role of the CRTC by Region and Education
| Level of informed with the mandate and role of the CRTC | Total (A) |
Region | Education | |||||||
|---|---|---|---|---|---|---|---|---|---|---|
| Atl (G) |
Que (H) |
Ont (I) |
Pra (J) |
BC (K) |
Terr (O) |
High school or less (P) |
College (Q) |
University or more (R) |
||
| Base=actual | (1,345) % |
(121) % |
(290) % |
(353) % |
(375) % |
(157) % |
(49) % |
(382) % |
(366) % |
(576) % |
| Informed (4 and 3) |
29 | 26 | 35 JL | 29 | 25 | 25 | 23 | 25 | 22 | 36 PQ |
| Uninformed (2 and 1) |
69 | 74 H | 61 | 69 | 75 H | 72 | 77 | 72 R | 76 R | 63 |
QC1 Overall, how informed are you about the mandate and role of the CRTC? (READ LIST)
Note: Letters denote statistically significant difference. For example, if there is a B then the result is significantly higher than the corresponding result in column B.
Exhibit 4.9.1.d. Level of informed with the mandate and role of the CRTC by Language and Income
| Level of informed with the mandate and role of the CRTC | Total (A) |
Language | Income | ||||||
|---|---|---|---|---|---|---|---|---|---|
| English (B) |
French (C) |
Other (D) |
<$40K (E) |
$40K- <$60K (F) |
$60K- <$100K (G) |
$100K- <$150K (H) |
$150K+ (I) |
||
| Base=actual | (1,345) % |
(876) % |
(285) % |
(175) % |
(286) % |
(210) % |
(296) % |
(183) % |
(154) % |
| Informed (4 and 3) |
29 | 29 | 38 BD | 20 | 23 | 20 | 32 F | 28 | 44 EFH |
| Uninformed (2 and 1) |
69 | 69 C | 59 | 78 C | 75 I | 77 I | 67 | 70I | 56 |
QC1 Overall, how informed are you about the mandate and role of the CRTC? (READ LIST)
Note: Letters denote statistically significant difference. For example, if there is a B then the result is significantly higher than the corresponding result in column B.
Overall, Canadians’ impressions of the CRTC continue to be more neutral in 2018 than they were in 2014. However, it is necessary to take into consideration that only one in three Canadians report to be well informed of the CRTC’s role which implies that two in three consumers’ impressions of the CRTC are based on very little to no knowledge. In fact, when looking at the opinions of those who consider themselves very well or well informed about the CRTC’s role, 50-55% are positive about the organisation. However, when delving even deeper, we see that the bulk of these ‘Well-informed’ Canadians (more than two in three) find the CRTC to be only ‘somewhat favourable’ as opposed to ‘very favourable’ (please note that these findings are only indicative due to small base sizes). This implies that there is still work to be done to not only inform the public of the CRTC and their role, but also potentially to address public perceptions.
Older Canadians (55+) continue to be more likely to have an opinion (favourable or unfavourable) about the CRTC than younger Canadians (refer to Exhibit 4.9.2.b). In addition, university graduates continue to be more favourable towards the CRTC (35% vs. 25-32%). English speaking Canadians feel less favourable about the CRTC (rated 1 or 2 on a 1-5 scale) compared to their Francophone counterparts (19% vs. 8%).
Exhibit 4.9.2.a. Impression of the CRTC
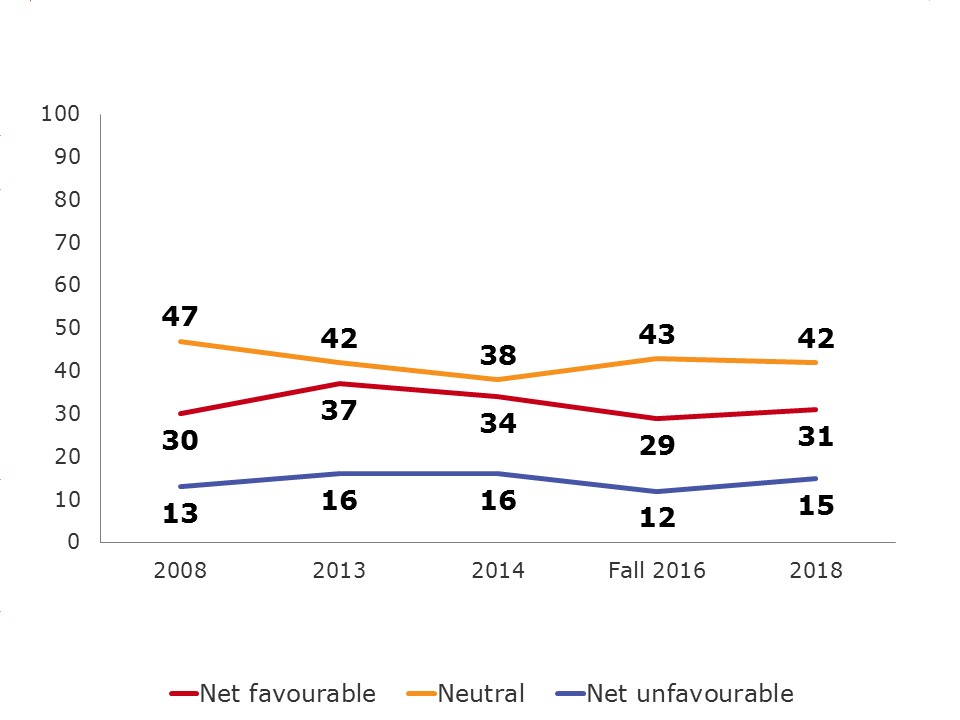
Impression of the CRTC - text version
QC2. What is your impression of the CRTC?
Base: Total respondents, 2018 (n=1,345), fall 2016 (n=1,483), 2014 (n=1,289)
Exhibit 4.9.2.b. Impression of the CRTC by Age, Education and Language
| Impression of the CRTC | Total (A) |
Age | Education | Language | ||||||
|---|---|---|---|---|---|---|---|---|---|---|
| 18-34 (D) |
35-54 (E) |
55+ (F) |
High school or less (P) |
College (Q) |
University or more (R) |
English (B) |
French (C) |
Other (D) |
||
| Base=actual | (1,345) % |
(152) % |
(409) % |
(766) % |
(382) % |
(366) % |
(576) % |
(876) % |
(285) % |
(175) % |
| Favourable (5 and 4) |
31 | 26 | 30 | 36 DE | 32 | 25 | 35 Q | 29 | 35 | 29 |
| Unfavourable (1 and 2) | 15 | 10 | 16 | 18 D | 17 | 14 | 15 | 19 C | 8 | 13 |
QC2. What is your impression of the CRTC? Would you say it is:
Note: Letters denote statistically significant difference. For example, if there is a B then the result is significantly higher than the corresponding result in column B.
Exhibit 4.9.2.c. Impression of the CRTC by Role of CRTC
| Impression of the CRTC | Total (A) |
Informed role of CRTC | |||
|---|---|---|---|---|---|
| Very well (K) | Well (L) |
Not very well (M) |
Not (N) |
||
| Base=actual | (1,345) % |
(86) % |
(338) % |
(553) % |
(343) % |
| Favourable (5 and 4) |
31 | 55 MN | 50 MN | 29 N | 13 |
| Unfavourable (1 and 2) | 15 | 15 | 13 | 17 | 15 |
QC2. What is your impression of the CRTC? Would you say it is:
Note: Letters denote statistically significant difference. For example, if there is a B then the result is significantly higher than the corresponding result in column B.
Over the past 2 years, most Canadians believe their impressions of the CRTC have remained the same (75%) while some have improved (9%) and others have declined (5%). Since 2008, perceptions tend to have improved (4% vs. 9%) however have fallen slightly since 2014 measures (11%).
Exhibit 4.9.2.d. Impression of the CRTC over time
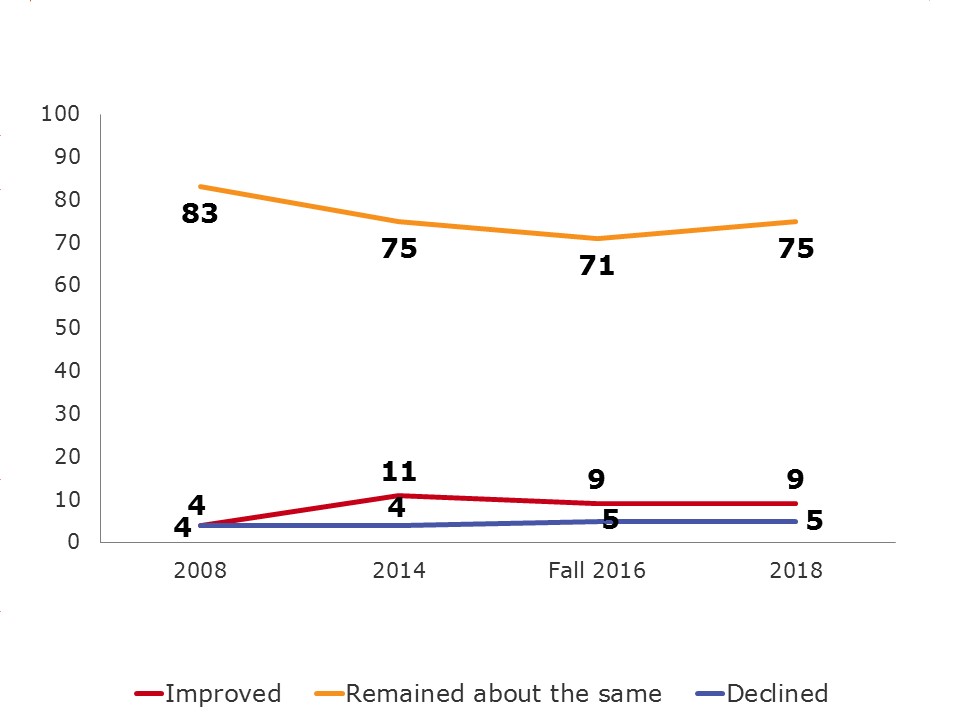
Impression of the CRTC over time - text version
QC3. Over the past year, would you say your impression of the CRTC has:
Base: Total respondents, 2018 (n=1,345), fall 2016 (n=1,483), 2014 (n=1,289)
Francophones’ and Anglophones’ opinions of the CRTC are less likely to have improved over the last year compared to other language speakers (5-9% vs. 16%). Quebeckers opinion are more likely to have stayed the same compared to Canadians residing outside of Quebec (78% vs. 68-77%).
Again, we see the positive impact of being informed – those who are well or very well informed of the role of the CRTC are more likely to have an improved opinion over the last twelve months (14-22% vs. 3-10%). This implies that the work done by the CRTC is valuable and serves the public. This suggests improvements to awareness of the role and mandate of the CRTC will improve Canadians perceptions overall.
Exhibit 4.9.2.e. Impression of the CRTC over time by Region and Language
| Impression of the CRTC over time | Total (A) |
Region | Language | |||||||
|---|---|---|---|---|---|---|---|---|---|---|
| Atl (G) |
Que (H) |
Ont (I) |
Pra (J) |
BC (K) |
Terr (O) |
English (B) |
French (C) |
Other (D) |
||
| Base=actual | (1,345) % |
(121) % |
(290) % |
(353) % |
(375) % |
(157) % |
(49) % |
(876) % |
(285) % |
(175) % |
| Improved | 9 | 6 | 7 | 10 | 9 | 12 | 13 | 9 | 5 | 16 BC |
| Declined | 5 | 5 | 2 | 7 | 6L | 7 | 7 | 6 | 3 | 6 |
| Remained about the same |
75 | 75 | 78 K | 74 | 77 | 68 | 68 | 76 D | 82 D | 63 |
| Don’t know | 10 | 14 | 12 | 9 | 8 | 13 | 13 | 8 | 10 | 16 B |
QC3. Over the past year, would you say your impression of the CRTC has: (READ LIST)
Note: Letters denote statistically significant difference. For example, if there is a B then the result is significantly higher than the corresponding result in column B.
Exhibit 4.9.2.f. Impression of the CRTC over time by Role of CRTC
| Impression of the CRTC | Total (A) |
Informed role of CRTC | |||
|---|---|---|---|---|---|
| Very well (K) | Well (L) |
Not very well (M) |
Not (N) |
||
| Base=actual | (1,345) % |
(86) % |
(338) % |
(553) % |
(343) % |
| Improved | 9 | 22 MN | 14 N | 10 N | 3 |
| Declined | 5 | 4 | 6 | 5 | 5 |
| Remained about the same | 75 | 72 | 78 N | 80 N | 69 |
| Don’t know | 10 | 2 | 2 | 5 | 23 KLM |
QC3. Over the past year, would you say your impression of the CRTC has: (READ LIST)
Note: Letters denote statistically significant difference. For example, if there is a B then the result is significantly higher than the corresponding result in column B.
A telephone survey was conducted among 1,345 Canadians aged 18 years and older; 1,152 with those who have their own wireless plan and 193 with those who do not have a wireless plan. Interviews were conducted using random landline telephone sampling sources. Included in this sample were Canadians that are under contract with TV service providers. Natural fall-out resulted in 1,034 respondents who subscribe to cable, satellite or IPTV TV services.
A pre-test consisting of 10 completed English interviews and 10 completed French interviews was completed before fielding the survey on January 25th, 2018.
The survey was in field from January 26th to February 8th, 2018. The sample for this study was a random telephone sample and as such the findings can be extrapolated to the Canadian population with a margin of error of +/-3 per cent, 19 times out of 20.
To allow for regional analyses, regional quotas were also set as follows:
Table 5.1.1.a: Survey Quotas
| Region | Wireless | Quota | Completions |
|---|---|---|---|
| Territories | With wireless | 50 | 48 |
| Without wireless | - | 1 | |
| British Columbia | With wireless | 125 | 126 |
| Without wireless | 30 | 31 | |
| Alberta | With wireless | 100 | 103 |
| Without wireless | 20 | 21 | |
| Manitoba | With wireless | 100 | 100 |
| Without wireless | 20 | 24 | |
| Saskatchewan | With wireless | 100 | 107 |
| Without wireless | 20 | 20 | |
| Ontario | With wireless | 300 | 301 |
| Without wireless | 50 | 52 | |
| Quebec | With wireless | 225 | 224 |
| Without wireless | 40 | 66 | |
| Atlantic | With wireless | 100 | 102 |
| Without wireless | 20 | 19 |
Survey data were weighted using the 2016 Census statistics with regard to region, age and gender. Further details about the methodology follow.
Questionnaire
This is a tracking survey and the overall objectives have not changed, although some questions were removed or added to the survey since the fall 2016 wave. CRTC provided TNS with both English and French versions of the survey. The survey took approximately 15 minutes to complete.
Survey Pretest
A pre-test was undertaken on January 25th, 2018 obtaining 10 English and 10 French completed interviews. The results were reviewed to ensure the survey was working as expected and that the questions were being interpreted as expected. Based on the results of the pre-test, minimal changes were required for the survey and as such the results of the 20 completes were included in the final data set.
Sample Design and Selection
A regionally stratified sample was drawn to achieve completions among Canadians who own their own cell phone and those who do not. The sample was regionally stratified to ensure regional quotas were met.
A landline sample was provided by an internal random number generator that randomizes the last four digits of the phone number based on known area code/exchange combinations. Landline respondents were screened to ensure they qualified for the study. The person answering the phone was selected for the study if they were 18 years of age or older. Regional quotas were assigned by those with and without personal wireless plans.
Survey Administration
The telephone survey was conducted using computer assisted telephone interviewing (CATI) technology. CATI ensures the interview flows as it should with pre-programmed skip patterns. It also controls responses to ensure appropriate ranges and data validity. Sample is imported directly into the survey to ensure accurate recording of sample variables such as region. The system also controls automated scheduling and call-backs to ensure all appointments are adhered to.
Surveys were conducted in English or French as chosen by the respondent. Interviewing was conducted by fully trained interviewers and supervisors. A minimum of five per cent of all interviews were independently monitored and validated in real time.
All participants were informed of the general purpose of the research, they were informed of the sponsor and the supplier and that all of their responses would be confidential. As well, the survey was registered with the MRIA Survey Registration System.
Margin of Errors
A sample of 1,345 drawn from the Canadian adult population would produce a margin of error of +/-3 per cent 19 times out of 20. Sub-groups have larger margins of error and are presented below.
Table 5.1.1.b: Margin of Error by Region, Gender, Age
| Target | Completes (Unweighted) |
Completes (Weighted) |
Margin of Error |
|---|---|---|---|
| Region | |||
| Atlantic | 121 | 92 | +/- 8.9 |
| Quebec | 290 | 314 | +/- 5.8 |
| Ontario | 353 | 515 | +/- 5.2 |
| Prairies | 375 | 237 | +/- 5.1 |
| British Columbia & Territories | 206 | 186 | +/- 6.8 |
| Gender | |||
| Male | 638 | 653 | +/- 3.9 |
| Female | 707 | 692 | +/- 3.7 |
| Age | |||
| 18-34 | 152 | 349 | +/- 8.0 |
| 35-54 | 409 | 452 | +/- 4.9 |
| 55 and over | 766 | 515 | +/- 3.5 |
Weighting
Data were weighted by region, age and gender using 2016 Census Data.
Table 5.1.1.c: 2011 Census Data by Region, Age, Gender
| Region | Age | Gender | Population (N) |
Population (%) |
|---|---|---|---|---|
| Atlantic | 18-34 | Male | 222,130 | 0.79 |
| Female | 223,220 | 0.79 | ||
| 35-54 | Male | 307,195 | 1.09 | |
| Female | 328,985 | 1.17 | ||
| 55+ | Male | 392,955 | 1.40 | |
| Female | 441,700 | 1.57 | ||
| Quebec | 18-34 | Male | 848,250 | 3.02 |
| Female | 842,360 | 3.00 | ||
| 35-54 | Male | 1,098,175 | 3.90 | |
| Female | 1,097,760 | 3.90 | ||
| 55+ | Male | 1,259,920 | 4.48 | |
| Female | 1,434,415 | 5.10 | ||
| Ontario | 18-34 | Male | 1,488,215 | 5.29 |
| Female | 1,483,160 | 5.27 | ||
| 35-54 | Male | 1,791,645 | 6.37 | |
| Female | 1,916,435 | 6.81 | ||
| 55+ | Male | 1,904,450 | 6.77 | |
| Female | 2,182,830 | 7.76 | ||
| Prairies | 18-34 | Male | 782,730 | 2.78 |
| Female | 762,790 | 2.71 | ||
| 35-54 | Male | 874,845 | 3.11 | |
| Female | 870,205 | 3.09 | ||
| 55+ | Male | 803,335 | 2.86 | |
| Female | 877,060 | 3.12 | ||
| BC & Territories | 18-34 | Male | 524,675 | 1.87 |
| Female | 517,040 | 1.84 | ||
| 35-54 | Male | 627,710 | 2.23 | |
| Female | 668,600 | 2.38 | ||
| 55+ | Male | 734,570 | 2.61 | |
| Female | 815,140 | 2.90 | ||
| Total | 28,122,500 | 100.00 |
Table 5.1.1.d: 2011 Census Data Language
| Language | Population (N) | Population (%) |
|---|---|---|
| English | 19821332 | 57.01 |
| French | 7303622 | 21.01 |
| Other | 7641957 | 21.98 |
| Total | 34766911 | 100.00 |
Response Rate
A total of 176,832 Canadian phone numbers were dialed, of which n=1,345 completed the survey. The overall response rate achieved for the telephone study was 1.71%. The following table outlines the sample disposition and response rate as per the MRIA guidelines.
Table 5.1.1.e: Response Rate Calculation
| Response Rate Calculation | Landline |
|---|---|
| Total Numbers Attempted | 176832 |
| Invalid | 76828 |
| NIS | 75018 |
| Fax/modem | 1782 |
| Business/non-residential | 28 |
| Unresolved (U) | 81897 |
| Busy | 2415 |
| No answer | 60233 |
| Answering machine | 19249 |
| Unresolved (IS) | 16392 |
| Language problem | 727 |
| Illness, incapable | |
| Selected respondent not available | 6831 |
| Household refusal | 8276 |
| Respondent refusal | |
| Qualified respondent break-off | 558 |
| In-scope - Responding units (R) | 1715 |
| Language disqualify | |
| No one 18+ | |
| Quota Full | 266 |
| Other disqualify - No Device not paid by employer (NWT/NU/YK only) | 12 |
| Other disqualify - Occupation | 88 |
| Completed interviews | 1349 |
| Response Rate = R/(U+IS+R) | 1.71% |
Non-response Bias
The response rate for this survey was 1.71%. In order to maximize response TNS undertakes the following:
Tabulated Data
Detailed tables are included under separate cover.
Background Information for the Interviewers
The Wireless Code came into effect in 2013 and was updated in 2017.
The TV Service Provider Code came into effect in 2017.
Section A: Introduction and Screening
Hello/Bonjour. My name is _______________ and I am calling from Kantar TNS on behalf of the Government of Canada. We are conducting a survey with Canadians to get their attitudes and opinions towards issues of importance to Canadians. Would you prefer that I continue in English or French? Préférez-vous continuer en français ou en anglais?
Your participation in this survey is voluntary. Please be assured that your responses are confidential and will not be reported individually nor attributed to you personally. The information will be used to develop communications related policy. The survey will take 15 minutes or less to complete.
| Yes | CONTINUE |
|---|---|
| No, other time | SCHEDULE CALLBACK |
| No/Refused | THANK AND TERMINATE |
[IF ASKED: Kantar TNS is a professional research company hired by the Government of Canada to conduct this survey]
[ASK ALL] A1b. Do you have your own cell phone, smartphone or other wireless device? In other words, a phone that is not paid for by your employer?
| YES | 1 |
|---|---|
| NO | 2 |
A1d. Does your household subscribe to a cable, satellite or IPTV TV service?
| Yes | 1 |
|---|---|
| No | 2 |
| DK/NR (VOLUNTEERED) | 9 |
A2. Are you or is any member of your household or immediate family employed in any of the following businesses? [READ LIST]
| Market Research | 1 [THANK AND TERMINATE] |
|---|---|
| Public or media relations or advertising | 2 [THANK AND TERMINATE] |
| Any media company such as print, radio, TV | 3 [THANK AND TERMINATE] |
| Media monitoring | 4 [THANK AND TERMINATE] |
| Any telecommunications company | 5 [THANK AND TERMINATE] |
| No | 6 [CONTINUE] |
Section: Wireless Code
[ASK ALL]
I. RECALL OF WIRELESS CODE
WC1. In 2013 a Wireless Code came into effect establishing guidelines for wireless service providers. The Code ensures that wireless consumers are empowered to make informed decisions and that there is a more competitive wireless marketplace. The Code was updated in 2017 to end unlocking fees and offer longer trial periods for new contracts. To what extent, if any would you say you recall hearing or seeing anything about this Code? Would you say you clearly recall, vaguely recall or do not recall?
| Clearly Recall | 1 |
|---|---|
| Vaguely Recall | 2 |
| Do not recall | 3 |
| DK | 99 |
PROGRAMMING INSTRUCTION:
IF NO AT A1B AND YES AT A1D SKIP TO SECTION TVSP Code
IF NO AT A1B AND NO AT A1D SKIP TO SECTION CRTC
II. TYPE OF WIRELESS CONTRACT
The next few questions are about your cell or wireless phone service contract or plan.
[Interviewer note: If say “I don’t have a plan/I have pay-as-you-go/month-to-month,” say: “this question is about your service agreement or plan, regardless of whether you have signed a contract for a specific time period, are month-to-month or use pre-paid cards.”]
INDIVIDUAL, FAMILY AND SHARED PLANS
B1a. Is it an individual plan or a family or shared plan?
[Interviewer note: If unsure about the difference, say “Do you pay only for one person (which is an individual plan) or do you share a plan with your family and pay together (which is a family plan)?”]
| Individual plan | 1 |
|---|---|
| Family/shared plan | 2 |
| [DO NOT READ] Other [SPECIFY] | 77 |
| DK (DO NOT READ) | 99 |
WC2. [ASK If answered “family members” to B1a]
How many family members are on your shared plan?
| 2 | 1 |
|---|---|
| 3 | 2 |
| 4 | 3 |
| 5+ | 4 |
| DK (DO NOT READ) | 99 |
MONTHLY, PREPAID, AND PAY-AS-YOU-GO PLANS
B1c. And, is it a monthly plan, or a prepaid or pay-as-you-go plan?
[Interviewer note: If unsure about the difference, say “If you pay your bill after you use your wireless service, its a monthly or post-paid plan. If you pay before you use your wireless service, its a prepaid or pay-as-you-go plan.“]
| Monthly/post-paid (paying after) | 1 |
|---|---|
| Prepaid/pay-as-you-go (paying before) | 2 |
| [DO NOT READ] Other [SPECIFY] | 77 |
| DK (DO NOT READ) | 99 |
CORPORATE CONTRACTS (EMPLOYEE PURCHASE PLANS)
B1d. Is your plan part of a promotion through your employer or an association you belong to, sometimes also called an employee purchase plan?
| Yes | 1 |
|---|---|
| No | 2 |
| DK (D NOT READ) | 99 |
TAB CONTRACTS
WC3. And, does your plan include a tab balance?
[If unsure about a tab balance, say “Tab balances are when you buy a phone at a reduced upfront cost and the leftover cost of the phone goes onto your account, creating a tab balance. Each month, a percentage of your monthly bill is used to pay down your tab.”]
| Yes | 1 |
|---|---|
| No | 2 |
| DK (DO NOT READ) | 99 |
III. SERVICES INCLUDED IN THE WIRELESS PLAN
(TEXT, VOICE, DATA)
DISPLAY: Now I would like to ask you a few questions about the services that are included in your wireless plan.
B2a. Which of the following are included in your wireless plan?
PROGRAMMING NOTE: PLEASE ALLOW YES NO AND DON’T KNOW AS OPTIONS
IV. DEVICES
PHONE INCLUDED WITH CONTRACT (TAB CONTRACTS AND OTHER DEVICE SUBSIDIES)
WC4. And does your plan include a phone that was sold to you at a reduced price as part of your contract or did you bring your own device also known as a BYOD plan?
[Interviewer note: If unsure about the meaning of BYOD, say “ BYOD is where you already own your mobile device and are simply purchasing the cellular service from a wireless company”]
| Device sold at discount | 1 |
|---|---|
| BYOD | 2 |
| DO NOT READ: Bought phone as part of a contract but paid full price | 3 |
| DK (DO NOT READ) | 99 |
UNLOCKED PHONES
WC5. The Wireless Code now prevents service providers from charging a fee to unlock your phone and requires service providers to sell new phones unlocked. Is your phone locked or unlocked?
[Interviewer note: If unsure about a locked phone say “A locked device is programmed to work only with a specific service provider’s network. Unlocking a device enables a customer to use it with other service providers and on other networks. A customer may find an unlocked device useful if they plan to: switch service providers and bring their device to the new provider or switch providers when travelling abroad.”]
| Locked | 1 |
|---|---|
| Unlocked | 2 |
| DK (DO NOT READ) | 99 |
V. DATA SERVICES
[ASK If answered “Data” to B2a]
Now I would like to ask you a few questions about the data services that are included in your wireless plan.
The Code was changed to gives families more control over data overages, and to stop providers from changing the amount of data included in your contract, unless you agree, during your contract term.
LIMITED AND UNLIMITED DATA PLANS
B4. Some wireless plans have unlimited data and some have limited data. When a plan includes limited data, you may have to pay data overage fees if you use more data in a month than is included in your plan.
Does your plan include unlimited data or limited data?
[Interviewer note: If unsure about the meaning of data, say “This is what you need to browse the Internet, access applications or your emails with your wireless device.”]
| Unlimited data | 1 |
|---|---|
| Limited data | 2 |
| No data | 3 |
| DK (DO NOT READ) | 99 |
HOW TO MANAGE DATA USE
PROGRAMMING NOTE: PLEASE ALLOW YES NO AND DONT KNOW AS OPTIONS
B5a. [ASK If answered “Limited” to B4] Which of the following activities, if any, do you use to manage or limit your data use? Select all that apply.
| Use tools to track your data use | 1 |
|---|---|
| Reduce your data use after you get a notification that you are nearing your limit | 2 |
| Use WIFI when available instead of data | 3 |
| Other (specify) | 4 |
| I do not limit my data use (DO NOT READ)* | 5 |
| DK (DO NOT READ) | 99 |
EASE OF MANAGING DATA
WC6. [ASK If answered “Data” to B2a and not code 3 (NO DATA) at B4]
How easy do you find it to manage the data used by yourself and/or your family each month?
Please use a 7-point scale where 1 means extremely difficult and 7 means extremely easy.
[Interviewer note: If unsure about the meaning of data, say “This is what you need to browse the Internet, access applications or your emails with your wireless device.”]
| 7 – Extremely easy | 07 |
|---|---|
| 6 | 06 |
| 5 | 05 |
| 4 | 04 |
| 3 | 03 |
| 2 | 02 |
| 1 – Extremely difficult | 01 |
| I DON’T USE MY DATA (DO NOT READ) | 09 |
| DK (DO NOT READ) | 99 |
DATA OVERAGE FEES
B8. [ASK If answered “Data” to B2a.] In the past 12 months, how often have you paid data overage fees?
READ LIST
[Interviewer note: If unsure about the meaning of data, say “This is what you need to browse the Internet, access applications or your emails with your wireless device.”]
| Never | 1 |
|---|---|
| 1-2 times | 2 |
| 3-6 times | 3 |
| 7-9 times | 4 |
| 10-12 times | 5 |
| DK- DO NOT READ | 99 |
VI. BILL SHOCK
B10. During the last year, have you experienced ‘bill shock, meaning a surprisingly high bill?
READ LIST
| Yes | 1 |
|---|---|
| No | 2 |
| DK DO NOT READ | 99 |
REASON FOR BILL SHOCK
B10a. [If answered “Yes” to B10] What was the main reason for the ‘bill shock you experienced?
DO NOT READ LIST – SELECT ALL THAT APPLY
INTERVIEWER NOTE: IF RESPONDENT SAYS ‘ROAMING/ROAMING FEES, CLARIFY WHETHER THIS WAS WITHIN CANADA OR IN ANOTHER COUNTRY
| Family/shared plans – difficulties managing use | 01 |
|---|---|
| International travel – roaming fees | 02 |
| Domestic travel – roaming fees | 03 |
| Data overage fees | 04 |
| Call minute overage fees | 05 |
| Long distance fees | 06 |
| Text overage fees | 07 |
| Billing issues/errors/mistakes | 08 |
| Unexpected set-up fee or service charge | 09 |
| Unexpected fees (Network access fee/911, etc.) | 10 |
| I was not given the plan/deal I was promised | 11 |
| Other (Specify) | 77 |
| DK (DO NOT READ) | 99 |
AMOUNT OF BILL SHOCK
B10b. [If answered “Yes” to B10] What was the amount of the unexpected charges on your bill?
READ LIST
| Less than $50 more than your usual monthly bill | 01 |
|---|---|
| $50 - $100 | 02 |
| $101 - $250 | 03 |
| $251 - $500 | 04 |
| $501 - $1000 | 05 |
| Greater than $1000 | 06 |
| Dont Know DO NOT READ | 99 |
ROAMING FEES WHILE TRAVELING
B9. If you use your plan while traveling, you may be charged roaming fees. How easy do you find it to manage your roaming charges when you are traveling?
Please use a 7-point scale where 1 means extremely difficult and 7 means extremely easy.
| 7 – Extremely easy | 07 |
|---|---|
| 6 | 06 |
| 5 | 05 |
| 4 | 04 |
| 3 | 03 |
| 2 | 02 |
| 1 – Extremely difficult | 01 |
| I dont travel with my phone (DO NOT READ) | 08 |
| DK (DO NOT READ) | 99 |
VII. COMPLAINTS
B11a. Have you made a complaint about your wireless services in the past 12 months?
| Yes | 1 |
|---|---|
| No | 2 |
| DK (DO NOT READ) | 99 |
SUBJECT OF COMPLAINTS
B11b. [ASK If answered “Yes” to B11a] What was your complaint about? READ LIST IF NEEDED CHOOSE ALL THAT APPLY
| Misleading information about the terms of your contract | 1 |
|---|---|
| Incorrect charge on your bill | 2 |
| Legitimacy or amount of early cancellation fee | 3 |
| Inadequate quality of service | 4 |
| Credit or refund not received | 5 |
| Data charges | 6 |
| Breach of contract | 7 |
| Change to contract without notice | 8 |
| 30 day cancellation policy | 9 |
| Unlocking phone | 10 |
| Credit reporting | 11 |
| Other [specify] | 77 |
| DK(Do not read) | 99 |
NOTES TO INTERVIEWER: PLEASE FAMILIARIZE YOURSELF WITH THE FOLLOWING BEFORE INTERVIEW READ IF REQUIRED
WHO DID YOU COMPLAIN TO?
WC7. [ASK If answered “Yes” to B11a] Who did you complain to? Was it your service provider, the Commission for Complaints for Telecom-Television Services, also knowns as the CCTS, or both?
| Service provider | 1 |
|---|---|
| CCTS | 2 |
| Both | 3 |
| DK (DO NOT READ) | 99 |
VIII. CLARITY AND EXPLAINATIONS
Now I would like to ask you a few questions about how clear and easy you find your wireless contract to understand.
EXPLAINATION OF TRIAL PERIOD
WC8. The Code requires service providers to include a trial period for new contracts that include a device. During the trial period, you can cancel your contract without penalty. This trial period now has to be half of a month of service and include half the service included in your monthly plan.
How clearly did your service provider explain the trial period to you?
Please use a 7-point scale where 1 means extremely unclear and 7 means extremely clear.
| 7 – Extremely clear | 07 |
|---|---|
| 6 | 06 |
| 5 | 05 |
| 4 | 04 |
| 3 | 03 |
| 2 | 02 |
| 1 – Extremely unclear | 01 |
| DO NOT READ: Do not have a contract | 08 |
| DO NOT READ: Never read the agreement | 09 |
| DO NOT READ: Did not have a trial period | 10 |
| DO NOT READ: Don’t Know | 99 |
EXPLAINATION OF CANCELLATION FEES
WC9. When you signed your contract or accepted your service agreement, how clearly did your service provider explain any fees that would apply if you cancel your contract or agreement early? Please use a 7-point scale where 1 means extremely unclear and 7 means extremely clear.
| 7 – Extremely clear | 07 |
|---|---|
| 6 | 06 |
| 5 | 05 |
| 4 | 04 |
| 3 | 03 |
| 2 | 02 |
| 1 – Extremely unclear | 01 |
| DO NOT READ: Do not have a contract | 08 |
| DO NOT READ: Never read the agreement | 09 |
| DO NOT READ: Don’t Know | 99 |
WC10. Do you find your contract clear and easy to understand? Please use a 7-point scale where 1 means extremely unclear and difficult to understand and 7 means extremely clear and easy to understand.
| 7 – Extremely clear and easy to understand | 07 |
|---|---|
| 6 | 06 |
| 5 | 05 |
| 4 | 04 |
| 3 | 03 |
| 2 | 02 |
| 1 – Extremely unclear and difficult to understand | 01 |
| DO NOT READ: Do not have a contract | 08 |
| DO NOT READ: Never read the agreement | 09 |
| DO NOT READ: Don’t Know | 99 |
IX. CHANGES
CHANGES TO YOUR CONTRACT
WC11. Have you ever become aware that your service provider changed your plan without expressly making you aware of how the terms and conditions had changed?
| Yes | 1 |
|---|---|
| No | 2 |
| DK | 99 |
[ASK ALL]
CHANGING SERVICE PROVIDERS
WC16. Have you changed wireless service providers in the last two years?
| Yes | 1 |
|---|---|
| No | 2 |
| DK | 99 |
REASONS FOR CHANGING SERVICE PROVIDER
WC12. [If answered “Yes” to WC16] Why did you change service provider? (DO NOT READ LIST - SELECT ALL THAT APPLY)
| Your contract had ended | 1 |
|---|---|
| You were no longer satisfied with your service provider | 2 |
| Offered a better deal with a different provider | 3 |
| Needed a new phone / to upgrade phone | 4 |
| Other [open ended] | 77 |
| DK | 99 |
EASE OF SWITCHING
WC13 [If answered “Yes” to WC16 ] How easy or difficult was it to switch service providers? Please use a 7-point scale where 1 means extremely difficult and 7 means extremely easy.
| 7 – Extremely easy | 07 |
|---|---|
| 6 | 06 |
| 5 | 05 |
| 4 | 04 |
| 3 | 03 |
| 2 | 02 |
| 1 – Extremely difficult | 01 |
| DO NOT READ: Don’t Know | 99 |
REASONS SWITCHING WAS DIFFICULT
WC14. [If answered 1,2 OR 3 at WC13] Was there a reason why switching providers was difficult for you? (DO NOT READ LIST – SELECT ALL THAT APPLY)
| Technical issues | 01 |
|---|---|
| Difficulty retaining phone number | 02 |
| High costs of ending contract | 03 |
| Could not get the phone you wanted | 04 |
| Other [open ended] | 77 |
| Don’t Know | 99 |
Section: TVSP Code
ASK TVSP CODE section if yes at A1d
The next few questions are about your TV service provider. By this we mean your cable, satellite or IPTV provider. Please do not include streaming services such as Netflix
INTERVIEWER INSTRUCTION: IF RESPONDENT INDICATES THEY DO NOT HAVE CABLE, SATELITE OR IPTV SERVICES SKIP THIS SECTION
TVSP1. In September 2017, a Television Service Provider Code came into effect establishing guidelines for television service providers. The Code ensures that television consumers are empowered to make informed decisions and that there is a more competitive wireless marketplace. To what extent, if any would you say you recall hearing or seeing anything about this Code? Would you say you clearly recall, vaguely recall or do not recall?
| Clearly Recall | 1 |
|---|---|
| Vaguely Recall | 2 |
| Do not recall | 3 |
| DK(DO NOT READ) | 99 |
TVSP2. To what extent do you find your TV contract clear and easy to understand? Please use a 7-point scale where 1 means extremely unclear and difficult to understand and 7 means extremely clear and easy to understand.
| 7 – Extremely clear and easy to understand | 07 |
|---|---|
| 6 | 06 |
| 5 | 05 |
| 4 | 04 |
| 3 | 03 |
| 2 | 02 |
| 1 – Extremely unclear and difficult to understand | 01 |
| DO NOT READ: Do not have a contract | 08 |
| DO NOT READ: Never read the agreement | 09 |
| DO NOT READ: Don’t Know | 99 |
TVSP3. The TVSP Code requires television service providers to provide a customer with a timeframe for when a service call to a residence will begin, explain potential charges associated with the service call, and explain how you may cancel or reschedule the service call. Have you experienced problems related to service calls?
| Yes | 1 |
|---|---|
| No | 2 |
| DK | 99 |
TVSP4. The TVSP Code requires television service providers to ensure that customers are aware of the availability, price and content of their entry-level service offering, also known as the basic service package. Has your service provider informed you about their entry-level offering? This may have been by email, on the phone or via your monthly billing?
| Yes | 1 |
|---|---|
| No | 2 |
| DK | 99 |
TVSP5. In the past twelve months, has your TV service provider changed the price of a TV channel or package of channels without informing you in advance?
| Yes | 1 |
|---|---|
| No | 2 |
| DK | 99 |
TVSP6. Have you made a complaint about your TV services within the last 12 months?
| Yes | 1 |
|---|---|
| No | 2 |
| DK | 99 |
Section CRTC: CRTC ASK ALL
The Canadian Radio-television and Telecommunications Commission or CRTC is an independent agency of government, responsible for regulating Canada's broadcasting and telecommunications systems.
C1. Overall, how informed are you about the mandate and role of the CRTC? (READ LIST)
| Very well informed | 1 |
|---|---|
| Well informed | 2 |
| Not very well informed | 3 |
| Not informed | 4 |
| DK (do not read) | 99 |
C2. What is your impression of the CRTC? Would you say it is: (READ LIST)
[Repeat CRTC definition, if necessary: The Canadian Radio-television and Telecommunications Commission or CRTC is an independent agency of government, responsible for regulating Canada's broadcasting and telecommunications systems.
| Very favourable | 1 |
|---|---|
| Somewhat favourable | 2 |
| Neutral | 3 |
| Somewhat unfavourable | 4 |
| Very unfavourable | 5 |
| DK (Do not read) | 99 |
C3. Over the past year, would you say your impression of the CRTC has: (READ LIST)
[Repeat CRTC definition, if necessary: The Canadian Radio-television and Telecommunications Commission or CRTC is an independent agency of government, responsible for regulating Canada's broadcasting and telecommunications systems].
| Improved | 1 |
|---|---|
| Declined | 2 |
| Remained about the same | 3 |
| DK (Do not read) | 99 |
Section: Demographics
Thank you, now we have a few questions for classifications purposes. Please be assured that your responses will remain confidential.
D1. Record gender [DO NOT ASK]
| Male | 1 |
|---|---|
| Female | 2 |
D2. Can you tell me, in what year were you born?
_____________[RECORD YEAR TO CALCULATE AGE] DK/refused D3 [IF D2 = DK/refused] For classification purposes, could you tell me whether your age is: [READ LIST]
| between 18 and 34 | 1 |
|---|---|
| between 35 and 49 | 2 |
| between 50 and 54 | 3 |
| Between 55 and 64 | 4 |
| 65 or older | 5 |
| REFUSED (DO NOT READ) |
[ASK ALL]
D3. Can you please confirm that you live in [PROVINCE FROM SAMPLE]? [IF NECESSARY, INTERVIEWER SAYS:] This information will be used for classification purposes only.
| Yes | 1 |
|---|---|
| No | 2 |
D4. [IF D3=2(No)] In which province or territory do you live? [READ LIST]
| Alberta | 1 |
|---|---|
| British Columbia | 2 |
| Manitoba | 3 |
| New Brunswick | 4 |
| Newfoundland | 5 |
| Nova Scotia | 6 |
| Ontario | 7 |
| Prince Edward Island | 8 |
| Quebec | 9 |
| Saskatchewan | 10 |
| Yukon | 11 |
| Nunavut | 12 |
| Northwest Territories | 13 |
D5. What is the highest level of formal education that you have completed? [READ IF NECESSARY - CODE ONE ONLY]
| Grade 8 or less | 1 |
|---|---|
| Some high school | 2 |
| High School diploma or equivalent | 3 |
| Registered Apprenticeship or other trades certificate or diploma | 4 |
| College, CEGEP or other non-university certificate or diploma | 5 |
| University certificate or diploma below bachelors level | 6 |
| Bachelors degree | 7 |
| Post graduate degree above bachelors level | 8 |
| [DO NOT READ] Prefer not to answer | 99 |
D6. What is your mother tongue, that is, the language you first learned at home?
(DO NOT READ)
[CODE ONE ONLY]
| English | 1 |
|---|---|
| French | 2 |
| Other (SPECIFY____________) | 8 |
| DK/NR (VOLUNTEERED) | 99 |
D7. Which of the following categories best describes your total household income? That is, the total income of all persons in your household combined, before taxes? [READ - CODE ONE ONLY]
| Under $20,000 | 1 |
|---|---|
| $20,000 to just under $40,000 | 2 |
| $40,000 to just under $60,000 | 3 |
| $60,000 to just under $80,000 | 5 |
| $80,000 to just under $100,000 | 6 |
| $100,000 to just under $150,000 | 7 |
| $150,000 and above | 8 |
| [DO NOT READ] Refused | 99 |
D8. Which of the following categories best describes your current employment status? Are you…? [READ - CODE ONE ONLY]
| Working full-time (35 or more hours per week) | 1 |
|---|---|
| Working part-time (less than 35 hours per week) | 2 |
| Self-employed | 3 |
| Unemployed, but looking for work | 4 |
| A student attending school full-time | 5 |
| Retired | 6 |
| Not in the workforce (Full-time homemaker or unemployed but not looking for work | 7 |
| Other employment status | 8 |
| [DO NOT READ] Refused | 99 |
Those are all the questions I have for you today. Thank you.
SONDAGE DE 2018 SUR LE CODE SUR LES SERVICES SANS FIL ET LE CODE DES FOURNISSEURS DE SERVICES DE TÉLÉVISION
Information complémentaire pour les sondeurs
Le Code sur les services sans fil est entré en vigueur en 2013 et a été mis à jour en 2017.
Le Code des fournisseurs de services de télévision est entré en vigueur en 2017.
Partie A: Introduction et examen préalable
Bonjour. Je suis _______________, de TNS, et j’appelle au nom du gouvernement du Canada. Nous réalisons un sondage auprès des Canadiens pour connaître leurs attitudes et leurs opinions relatives à des questions d’importance pour les Canadiens. Préférez-vous continuer en français ou en anglais? Would you prefer to continue in English or French?
Votre participation au sondage est volontaire. Soyez assuré que vos réponses seront traitées en toute confidentialité et ne seront utilisées que de façon regroupée et anonyme. Les renseignements serviront à élaborer une politique relative aux communications. Le sondage durera tout au plus 15 minutes.
| Oui | CONTINUER |
|---|---|
| Non – pas maintenant | PRÉVOIR UN RAPPEL |
| Non – refus | REMERCIER LA PERSONNE ET TERMINER L’ENTRETIEN |
[SI L’INTERLOCUTEUR LE DEMANDE : TNS est une firme de recherche professionnelle retenue par le gouvernement du Canada pour effectuer le sondage.]
[DEMANDER À TOUS] A1b. Avez-vous votre propre téléphone cellulaire, téléphone intelligent ou autre appareil sans fil? C’est-à-dire, un téléphone qui n’est pas payé par votre employeur?
| OUI | 1 |
|---|---|
| NON | 2 |
A1d. Votre ménage est-il abonné à un service de télévision par câble, par satellite ou par protocole Internet?
| Oui | 1 |
|---|---|
| Non | 2 |
| Ne sait pas ou pas de réponse | 9 |
A2. Est-ce que vous ou un membre de votre ménage ou de votre famille immédiate travaillez dans l’un des domaines suivants? [LIRE LA LISTE]
| Étude de marché | 1 [REMERCIER LA PERSONNE ET TERMINER L’ENTRETIEN] |
|---|---|
| Relations publiques ou avec les médias, ou publicité | 2 [REMERCIER LA PERSONNE ET TERMINER L’ENTRETIEN] |
| Entreprise médiatique (impression, radio, télévision) | 3 [REMERCIER LA PERSONNE ET TERMINER L’ENTRETIEN] |
| Surveillance des médias | 4 [REMERCIER LA PERSONNE ET TERMINER L’ENTRETIEN] |
| Entreprise de télécommunications | 5 [REMERCIER LA PERSONNE ET TERMINER L’ENTRETIEN] |
| Non | 6 [POURSUIVRE] |
INSTRUCTION DE PROGRAMMATION :
SI LA RÉPONSE EST « NON » POUR LA QUESTION A1B ET « OUI » POUR LA QUESTION A1D, PASSER À LA PARTIE SUR LE CODE DES FOURNISSEURS DE SERVICES DE TÉLÉVISION.
SI LA RÉPONSE EST « NON » AUX QUESTIONS A1B ET A1D, PASSER À LA SECTION SUR LE CRTC.
Partie: Code sur les services sans fil
[DEMANDER À TOUS]
I. RAPPEL SUR LE CODE SUR LES SERVICES SANS FIL
CSSF1. Le Code sur les services sans fil est entré en vigueur en décembre 2013 et a établi des lignes directrices à l’intention des fournisseurs de services. Le Code aide les consommateurs à prendre des décisions éclairées et à assurer un marché des services sans fil concurrentiel. On a mis le Code à jour en 2017 pour mettre fin aux frais de déverrouillage et pour allonger les périodes d’essai des nouveaux contrats. Dans quelle mesure vous souvenez-vous avoir entendu ou vu quoi que ce soit au sujet du Code? Diriez-vous que vous vous en souvenez clairement, que vous vous en souvenez vaguement ou que vous ne vous en souvenez pas?
| S’en rappelle clairement | 1 |
|---|---|
| S’en rappelle vaguement | 2 |
| Ne s’en rappelle pas | 3 |
| Ne sait pas | 99 |
II. TYPES DE CONTRATS DE SERVICES SANS FIL
Les prochaines questions portent sur votre contrat ou forfait de service cellulaire ou sans fil.
[Remarque à l’intention du sondeur : Si on répond « Je n’ai pas de forfait, je paie à la carte, à l’utilisation ou de mois en mois », répondre : « La question porte sur l’entente ou le forfait de service sans égard au fait que vous ayez ou non signé un contrat pour une période fixe ou que vous utilisez un service mensuel ou des cartes prépayées. »]
FORFAITS INDIVIDUELS, FAMILIAUX ET PARTAGÉS
B1a. S’agit-il d’un forfait individuel ou d’un forfait familial ou partagé?
[Remarque à l’intention du sondeur : En cas de doute quant à la différence, préciser « Payez-vous pour une seule personne (forfait individuel) ou partagez-vous un forfait payé conjointement avec votre famille (forfait familial)? »]
| Forfait individuel | 1 |
|---|---|
| Forfait familial ou partagé | 2 |
| [NE PAS LIRE] Autre [PRÉCISER] | 77 |
| Ne sait pas [NE PAS LIRE] | 99 |
CSSF2. [DEMANDER si répondu « Membres de la famille » à la question B1b]
Combien de membres de votre famille partagent-ils votre forfait?
| 2 | 1 |
|---|---|
| 3 | 2 |
| 4 | 3 |
| 5 et plus | 4 |
| Ne sait pas [NE PAS LIRE] | 99 |
FORFAITS MENSUELS, PRÉPAYÉS ET À LA CARTE
B1c. Et s’agit-il d’un forfait mensuel ou d’un forfait prépayé ou à la carte?
[Remarque à l’intention du sondeur : Si la personne n’est pas certaine, dire « Si vous payez la facture après avoir utilisé votre service sans fil, il s’agit d’un forfait mensuel ou postpayé. Si vous payez avant d’utiliser votre service sans fil, il s’agit d’un forfait prépayé ou à la carte. »]
| Mensuel ou postpayé (payé après) | 1 |
|---|---|
| Prépayé ou à la carte (payé à l’avance) | 2 |
| [NE PAS LIRE] Autre [PRÉCISER] | 77 |
| Ne sait pas [NE PAS LIRE] | 99 |
CONTRATS D’ENTREPRISE (PROGRAMMES D’ACHAT DES EMPLOYÉS)
B1d. Votre forfait est-il offert dans le cadre d’une promotion de votre employeur ou d’une association dont vous êtes membre, ce qu’on désigne souvent sous le nom de programme d’achat des employés?
| Oui | 1 |
|---|---|
| Non | 2 |
| Ne sait pas [NE PAS LIRE] | 99 |
CONTRATS DE TYPE « BALANCE »
CSSF3. Et votre contrat est-il associé à une balance?
[Si la personne n’est pas certaine au sujet d’une balance, dire « Lorsque vous achetez un téléphone à un prix initial réduit et que le reste du coût est porté à votre compte, il s’agit d’une balance, qu’on appelle “tab” en anglais. Chaque mois, une partie du montant facturé sert à payer cette balance. »]
| Oui | 1 |
|---|---|
| Non | 2 |
| Ne sait pas [NE PAS LIRE] | 99 |
III. SERVICES COMPRIS DANS LE FORFAIT SANS FIL
(MESSAGES TEXTE, TRANSMISSION DE LA VOIX ET DONNÉES)
AFFICHAGE : Je voudrais maintenant vous poser quelques questions au sujet des services offerts dans le cadre de votre forfait de services sans fil.
B2a. Lesquelles des fonctions suivantes sont comprises dans votre forfait de services sans fil?
d. Minutes d’appel [Remarque à l’intention du sondeur : Si la personne ne comprend pas, dire « C’est ce qui vous permet de faire ou de recevoir des appels téléphoniques. »]
e. Messages textes [Remarque à l’intention du sondeur : Si la personne ne comprend pas, dire « Cela peut comprendre les messages texte et les messages multimédia, comme les photos ou vidéos envoyées par texto. »]
f. Données [Remarque à l’intention du sondeur : Si la personne ne comprend pas le concept des données, dire « C’est ce qui vous permet de naviguer sur Internet, d’accéder à des applications ou de lire vos courriels sur votre appareil sans fil. »]
REMARQUE LIÉE À LA PROGRAMMATION : PERMETTRE LES RÉPONSES « OUI », « NON » ET « NE SAIT PAS ».
IV. APPAREILS
TÉLÉPHONE COMPRIS DANS LE CONTRAT (CONTRATS DE TYPE « BALANCE » ET AUTRES SUBVENTIONS À L’ACHAT D’APPAREILS)
CSSF4. Et votre forfait comprend-il un téléphone qui vous a été vendu à un prix réduit dans le cadre de votre contrat ou avez-vous fourni votre propre appareil, aussi appelé forfait « Apportez votre propre appareil »?
[Remarque à l’intention du sondeur : Si la personne n’est pas certaine de ce qu’est un forfait « Apportez votre propre appareil », dites «Il s’agit d’un forfait pour lequel vous possédez déjà un appareil mobile et achetez simplement un service cellulaire d’une entreprise de télécommunications sans fil »]
| Appareil vendu au rabais | 1 |
|---|---|
| Apportez votre propre appareil | 2 |
| NE LISEZ PAS : A acheté le téléphone dans le cadre d’un contrat mais a payé le plein prix | 3 |
| Ne sait pas [NE PAS LIRE] | 99 |
APPAREILS DÉVERROUILLÉS
CSSF5. Le Code sur les services sans fil empêche désormais les fournisseurs de services de vous imposer des frais pour le déverrouillage des appareils et exige des fournisseurs qu’ils vendent les nouveaux téléphones déverrouillés. Votre téléphone est-il verrouillé ou déverrouillé?
[Remarque à l’intention du sondeur : Si la personne n’est pas certaine de ce qu’est un téléphone verrouillé, dire « Un appareil verrouillé est configuré de telle sorte qu’il ne fonctionne que sur le réseau d’un fournisseur précis. Le déverrouillage de l’appareil permet au client de l’utiliser avec d’autres fournisseurs et sur d’autres réseaux. Les appareils déverrouillés sont utiles lorsque le client prévoit changer de fournisseur et continuer d’utiliser le même appareil ou s’il pense utiliser un nouveau fournisseur lors d’un voyage à l’étranger. »]
| Verrouillé | 11 |
|---|---|
| Déverrouillé | 2 |
| Ne sait pas [NE PAS LIRE] | 99 |
V. SERVICES DE DONNÉES
[DEMANDER si répondu « Données » à la question B2a]
Je voudrais maintenant vous poser quelques questions au sujet des services de données offerts dans le cadre de votre forfait de services sans fil.
Le Code a été modifié afin que les familles puissent exercer un contrôle accru sur l’utilisation excédentaire de données et afin d’empêcher les fournisseurs de modifier la quantité de données comprises dans votre contrat durant l’entente, sauf si vous y consentez.
FORFAITS DONNÉES LIMITÉES OU ILLIMITÉES
B4. Certains forfaits de services sans fil offrent une utilisation illimitée de données, d’autres, une utilisation limitée. Lorsqu’un forfait comprend une limite de données, vous pouvez avoir à payer des frais d’utilisation excédentaire si vous utilisez plus de données dans un mois que ce que prévoit votre forfait.
Votre forfait comprend-il une utilisation illimitée ou limitée de données?
[Remarque à l’intention du sondeur : Si la personne ne comprend pas le concept des données, dire « C’est ce qui vous permet de naviguer sur Internet, d’accéder à des applications ou de lire vos courriels sur votre appareil sans fil. »]
| Données illimitées | 1 |
|---|---|
| Données limitées | 2 |
| Pas de données | 3 |
| Ne sait pas [NE PAS LIRE] | 99 |
GESTION DE L’UTILISATION DE DONNÉES
REMARQUE LIÉE À LA PROGRAMMATION : PERMETTRE LES RÉPONSES « OUI », « NON » ET « NE SAIT PAS ».
B5a. [DEMANDER si répondu « Limitées » à la question B4] Lesquelles des méthodes suivantes utilisez-vous pour gérer ou limiter votre utilisation de données? Choisissez toutes les réponses qui s’appliquent.
| Utilisation d’outils pour surveiller votre utilisation de données | 1 |
|---|---|
| Réduction de l’utilisation de données après avoir reçu un avis que vous approchez la limite | 2 |
| Utilisation du Wi-Fi dans la mesure du possible | 3 |
| Autre (préciser) | 4 |
| Je ne limite pas mon utilisation de données (NE LISEZ PAS)* | 5 |
| Ne sait pas [NE PAS LIRE] | 99 |
FACILITÉ À GÉRER L’UTILISATION DE DONNÉES
CSSF6. [DEMANDER si répondu « Données » à la question B2a ET pas le code 3(Pas de données) à B4] Est-il facile pour vous de gérer votre utilisation de données ou celle de votre famille chaque mois?
Veuillez utiliser une échelle à sept points, 1 étant très difficile et 7 étant très facile.
[Remarque à l’intention du sondeur : Si la personne ne comprend pas le concept des données, dire « C’est ce qui vous permet de naviguer sur Internet, d’accéder à des applications ou de lire vos courriels sur votre appareil sans fil. »]
| 7 – Très facile | 07 |
|---|---|
| 6 | 06 |
| 5 | 05 |
| 4 | 04 |
| 3 | 03 |
| 2 | 02 |
| 1 – Très difficile | 01 |
| Je n’utilise pas mes données (NE PAS LIRE) | 09 |
| Ne sait pas [NE PAS LIRE] | 99 |
FRAIS D’UTILISATION EXCÉDENTAIRE DE DONNÉES
B8. [DEMANDER si répondu « Données » à la question B2a] Au cours des 12 derniers mois, à quelle fréquence avez-vous payé des frais d’utilisation excédentaire de données?
LIRE LA LISTE
[Remarque à l’intention du sondeur : Si la personne ne comprend pas le concept des données, dire « C’est ce qui vous permet de naviguer sur Internet, d’accéder à des applications ou de lire vos courriels sur votre appareil sans fil. »]
| Jamais | 1 |
|---|---|
| 1 ou 2 fois | 2 |
| 3 à 6 fois | 3 |
| 7 à 9 fois | 4 |
| 10 à 12 fois | 5 |
| Ne sait pas [NE PAS LIRE] | 99 |
VI FACTURES-SURPRISES
B10. Au cours de la dernière année, avez-vous reçu une facture-surprise, c’est-à-dire une facture étonnamment élevée?
LIRE LA LISTE
| Oui | 1 |
|---|---|
| Non | 2 |
| Ne sait pas [NE PAS LIRE] | 99 |
RAISON DE LA FACTURE-SURPRISE
B10a. [Si répondu « Oui » à la question B10] Quelle était la principale raison des frais élevés de la facture-surprise que vous avez reçue?
NE PAS LIRE LA LISTE. SÉLECTIONNER TOUTES LES RÉPONSES QUI S’APPLIQUENT.
REMARQUE À L’INTENTION DU SONDEUR : SI LE RÉPONDANT INDIQUE LES FRAIS D’ITINÉRANCE, DÉTERMINER S’IL S’AGIT D’ITINÉRANCE AU CANADA OU À L’ÉTRANGER.
| Forfait familial ou partagé – Difficile de gérer l’utilisation | 01 |
|---|---|
| Voyages à l’étranger – Frais d’itinérance | 02 |
| Voyages au Canada – Frais d’itinérance | 03 |
| Frais d’utilisation excédentaire de données | 04 |
| Frais de dépassement des minutes d’appel | 05 |
| Frais d’interurbain | 06 |
| Frais d’utilisation excédentaire de messages texte | 07 |
| Problèmes ou erreurs de facturation | 08 |
| Frais de configuration ou de service non prévus | 09 |
| Autres frais non prévus (frais d’accès au réseau, service 911, etc.) | 10 |
| Le forfait ou contrat obtenu n’est pas celui qui a été promis | 11 |
| Autre (préciser) | 77 |
| Ne sait pas [NE PAS LIRE] | 99 |
MONTANT DE LA FACTURE-SURPRISE
B10b. [Si répondu « Oui » à la question B10] Quel était le montant des frais non prévus sur votre facture?
LIRE LA LISTE
| Moins de 50 $ de plus que la facture mensuelle habituelle | 01 |
|---|---|
| 50 $ à 100 $ | 02 |
| 101 $ à 250 $ | 03 |
| 251 $ à 500 $ | 04 |
| 501 $ à 1 000 $ | 05 |
| Plus de 1 000 $ | 06 |
| Ne sait pas [NE PAS LIRE] | 99 |
FRAIS D’ITINÉRANCE EN VOYAGE
B9. Si vous utilisez votre forfait lorsque vous voyagez, vous pourriez avoir à payer des frais d’itinérance. Est-il facile pour vous de gérer vos frais d’itinérance lorsque vous voyagez?
Veuillez utiliser une échelle à sept points, dans laquelle 1 signifie très difficile et 7 signifie très facile.
| 7 – Très facile | 07 |
|---|---|
| 6 | 06 |
| 5 | 05 |
| 4 | 04 |
| 3 | 03 |
| 2 | 02 |
| 1 – Très difficile | 01 |
| Je ne voyage pas avec mon téléphone [NE PAS LIRE] | 08 |
| Ne sait pas [NE PAS LIRE] | 99 |
VII. PLAINTES
B11a. Au cours des 12 derniers mois, avez-vous porté plainte au sujet de vos services sans fil?
| Oui | 1 |
|---|---|
| Non | 2 |
| Ne sait pas [NE PAS LIRE] | 99 |
SUJET DES PLAINTES
B11b. [DEMANDER si répondu « Oui » à la question B11a] Quel était le sujet de votre plainte? LIRE LA LISTE AU BESOIN, SÉLECTIONNER TOUTE RÉPONSE PERTINENTE
| Information trompeuse au sujet des modalités du contrat | 1 |
|---|---|
| Frais facturés à tort | 2 |
| Légitimité ou montant des frais de résiliation anticipée | 3 |
| Services inadéquats | 4 |
| Crédit ou remboursement non reçu | 5 |
| Frais d’utilisation de données | 6 |
| Rupture de contrat | 7 |
| Modification du contrat sans préavis | 8 |
| Politique d’annulation de 30 jours | 9 |
| Déverrouillage du téléphone | 10 |
| Rapport de solvabilité | 11 |
| Autre (préciser) | 77 |
| Ne sait pas [NE PAS LIRE] | 99 |
REMARQUES À L’INTENTION DU SONDEUR : PRENDRE CONNAISSANCE DE CE QUI SUIT AVANT LE SONDAGE. LIRE AU BESOIN.
AUPRÈS DE QUI AVEZ-VOUS DÉPOSÉ VOTRE PLAINTE?
CSSF7. [DEMANDER si répondu « Oui » à la question B11a] Auprès de qui avez-vous déposé votre plainte? Était-ce auprès de votre fournisseur de services, du Commissaire aux plaintes relatives aux services de télécommunications (le CPRST) ou des deux?
| Fournisseur de services | 1 |
|---|---|
| CPRST | 2 |
| Les deux | 3 |
| Ne sait pas [NE PAS LIRE] | 99 |
VIII. CLARTÉ ET EXPLICATIONS
Je voudrais maintenant vous poser quelques questions au sujet de la clarté et de la facilité à comprendre votre contrat de service sans-fil.
EXPLICATIONS AU SUJET DE LA PÉRIODE D’ESSAI
CSSF8. Le Code exige des fournisseurs de service qu’ils fournissent une période d’essai pour les nouveaux contrats qui comprennent un appareil. Pendant la période d’essai, vous pouvez résilier votre contrat sans pénalité. La période d’essai doit être de la moitié d’un mois de service et comprendre la moitié des services compris dans votre forfait mensuel.
Avec quelle clarté votre fournisseur de services vous a-t-il expliqué la période d’essai?
Veuillez utiliser une échelle à sept points dans laquelle 1 signifie pas clair du tout et 7 signifie très clair.
| 7 – Très clair | 07 |
|---|---|
| 6 | 06 |
| 5 | 05 |
| 4 | 04 |
| 3 | 03 |
| 2 | 02 |
| 1 – Pas clair du tout | 01 |
| NE PAS LIRE : N’a pas de contrat | 08 |
| NE PAS LIRE : N’a jamais lu l’entente | 09 |
| NE PAS LIRE : N’a pas eu de période d’essai | 10 |
| NE PAS LIRE : Ne sait pas | 99 |
EXPLICATIONS DES FRAIS DE RÉSILIATION
CSSF9. Lorsque vous avez signé votre contrat ou accepté votre entente de service, le fournisseur de services a-t-il expliqué clairement les frais qui s’appliquent si vous annulez prématurément le contrat ou l’entente? Veuillez utiliser une échelle à sept points dans laquelle 1 signifie pas clair du tout et 7 signifie très clair.
| 7 – Très clair | 07 |
|---|---|
| 6 | 06 |
| 5 | 05 |
| 4 | 04 |
| 3 | 03 |
| 2 | 02 |
| 1 – Pas clair du tout | 01 |
| NE PAS LIRE : N’a pas de contrat | 08 |
| NE PAS LIRE : N’a jamais lu l’entente | 09 |
| NE PAS LIRE : Ne sait pas | 99 |
WC10. Trouvez-vous que votre contrat est clair et facile à comprendre? Veuillez utiliser une échelle à sept points dans laquelle 1 signifie pas clair du tout et difficile à comprendre et 7 signifie très clair et facile à comprendre.
| 7 – Très clair et facile à comprendre | 07 |
|---|---|
| 6 | 06 |
| 5 | 05 |
| 4 | 04 |
| 3 | 03 |
| 2 | 02 |
| 1 – Pas clair du tout et difficile à comprendre | 01 |
| NE PAS LIRE : N’a pas de contrat | 08 |
| NE PAS LIRE : N’a jamais lu l’entente | 09 |
| NE PAS LIRE : Ne sait pas | 99 |
IX. MODIFICATIONS
MODIFICATIONS AU CONTRAT
CSSF11. Vous êtes-vous déjà aperçu que votre fournisseur de service a modifié votre forfait sans vous aviser directement des modifications apportées aux modalités?
| Oui | 1 |
|---|---|
| Non | 2 |
| Ne sait pas | 99 |
[DEMANDER À TOUS]
CHANGEMENT DE FOURNISSEURS DE SERVICES
CSSF16. Avez-vous changé de fournisseur de services sans fil au cours des deux dernières années?
| Oui | 1 |
|---|---|
| Non | 2 |
| Ne sait pas | 99 |
RAISONS MOTIVANT LE CHANGEMENT DE FOURNISSEURS DE SERVICES
CSSF12. [Si répondu « Oui » à la question CSSF16] Pourquoi avez-vous changé de fournisseur de services? [NE PAS LIRE LA LISTE. SÉLECTIONNER TOUTES LES RÉPONSES QUI S’APPLIQUENT.]
| Fin du contrat | 1 |
|---|---|
| Non satisfait du fournisseur de services | 2 |
| Un autre fournisseur a présenté une meilleure offre | 3 |
| Besoin de remplacer le téléphone | 4 |
| Autre [réponse libre] | 77 |
| Ne sait pas | 99 |
FACILITÉ DU CHANGEMENT
CSSF13. [Si répondu « Oui » à la question CSSF16] A-t-il été facile de changer de fournisseur de services? Veuillez utiliser une échelle à sept points dans laquelle 1 signifie très difficile et 7 signifie très facile.
| 7 – Très facile | 07 |
|---|---|
| 6 | 06 |
| 5 | 05 |
| 4 | 04 |
| 3 | 03 |
| 2 | 02 |
| 1 – Très difficile | 01 |
| NE PAS LIRE : Ne sait pas | 99 |
RAISONS POUR LESQUELLES LE CHANGEMENT A ÉTÉ DIFFICILE
CSSF14. [Si répondu 1, 2 ou 3 à la question CSSF13] Pourquoi vous a-t-il été difficile de changer de fournisseur de services? [NE PAS LIRE LA LISTE. SÉLECTIONNER TOUTES LES RÉPONSES QUI S’APPLIQUENT.]
| Problèmes techniques | 01 |
|---|---|
| Problème pour garder le numéro de téléphone | 02 |
| Coût de résiliation de contrat élevé | 03 |
| Ne pouvait obtenir le téléphone voulu | 04 |
| Autre [réponse libre] | 77 |
| Ne sait pas | 99 |
Partie: Code des fournisseurs de services de television
Les questions suivantes portent sur votre fournisseur de services de télévision. J’entends par là votre fournisseur de télévision par câble, satellite ou protocole Internet. Veuillez ne pas y inclure les services de lecture en continu comme Netflix.
INSTRUCTION À L’INTENTION DU SONDEUR : SI LE RÉPONDANT INDIQUE QU’IL N’A PAS DE SERVICES DE TÉLÉVISION PAR CÂBLE, SATELLITE OU PROTOCOLE INTERNET, PASSER À LA SECTION SUIVANTE.
FST1. Le Code des fournisseurs de services de télévision est entré en vigueur en 2017 et a établi des lignes directrices à l’intention des fournisseurs de services de télévision. Le Code aide les consommateurs à prendre des décisions éclairées et garantit un marché des services de télévision concurrentiel. Dans quelle mesure vous souvenez-vous avoir entendu ou vu quoi que ce soit au sujet du Code? Diriez-vous que vous vous en souvenez clairement, que vous vous en souvenez vaguement ou que vous ne vous en souvenez pas?
| S’en rappelle clairement | 1 |
|---|---|
| S’en rappelle vaguement | 2 |
| Ne s’en rappelle pas | 3 |
| Ne sait pas [NE PAS LIRE] | 99 |
FST2. Dans quelle mesure trouvez-vous que votre contrat de télévision est clair et facile à comprendre? Veuillez utiliser une échelle à sept points dans laquelle 1 signifie pas clair du tout et difficile à comprendre et 7 signifie très clair et facile à comprendre.
| 7 – Très clair et facile à comprendre | 07 |
|---|---|
| 6 | 06 |
| 5 | 05 |
| 4 | 04 |
| 3 | 03 |
| 2 | 02 |
| 1 – Pas clair du tout et difficile à comprendre | 01 |
| NE PAS LIRE : N’a pas de contrat | 08 |
| NE PAS LIRE : N’a jamais lu l’entente | 09 |
| NE PAS LIRE : Ne sait pas | 99 |
FST3. Le Code des fournisseurs de services de télévision exige des fournisseurs qu’ils donnent aux clients une plage horaire pour le début d’un appel de service à domicile, qu’ils expliquent les frais éventuellement associés à l’appel de service et qu’ils indiquent comment annuler ou déplacer l’appel. Avez-vous éprouvé des problèmes liés à des appels de service?
| Oui | 2 |
|---|---|
| Non | 1 |
| Ne sait pas | 99 |
FST4. Le Code des fournisseurs de services de télévision exige des fournisseurs qu’ils veillent à ce que les clients connaissent la disponibilité, le prix et le contenu de l’offre de service d’entrée de gamme, qu’on appelle aussi forfait de base. Votre fournisseur de services vous a-t-il informé de son offre d’entrée de gamme? Il peut l’avoir fait par courriel, au téléphone ou au moyen de votre facture mensuelle.
| Oui | 2 |
|---|---|
| Non | 1 |
| Ne sait pas | 99 |
FST5. Au cours des 12 derniers mois, votre fournisseur de services de télévision a-t-il modifié le prix d’une chaîne ou d’un ensemble de chaînes sans vous en aviser?
| Oui | 2 |
|---|---|
| Non | 1 |
| Ne sait pas | 99 |
FST6. Au cours des 12 derniers mois, avez-vous porté plainte au sujet de vos services de télévision?
| Oui | 2 |
|---|---|
| Non | 1 |
| Ne sait pas | 99 |
Partie sur le CRTC: CRTC, DEMANDER À TOUS
Le Conseil de la radiodiffusion et des télécommunications canadiennes, ou CRTC, est un organisme indépendant du gouvernement chargé de réglementer les systèmes de radiodiffusion et de télécommunications du Canada.
C1. Dans l’ensemble, êtes-vous bien informé au sujet du mandat et du rôle du CRTC? [LIRE LA LISTE]
| Très bien informé | 1 |
|---|---|
| Bien informé | 2 |
| Peu informé | 3 |
| Pas informé | 4 |
| Ne sait pas [ne pas lire] | 99 |
C2. Quelle est votre impression du CRTC? Est-elle : (LIRE LA LISTE)
[Répéter la définition du CRTC, au besoin
Le Conseil de la radiodiffusion et des télécommunications canadiennes, ou CRTC, est un organisme indépendant du gouvernement chargé de réglementer les systèmes de radiodiffusion et de télécommunications du Canada.]
| Très favorable | 1 |
|---|---|
| Quelque peu favorable | 2 |
| Neutre | 3 |
| Quelque peu défavorable | 4 |
| Très défavorable | 5 |
| Ne sait pas [ne pas lire] | 99 |
C3. Au cours de la dernière année, est-ce que votre opinion du CRTC : (LIRE LA LISTE)
[Répéter la définition du CRTC, si nécessaire
Le Conseil de la radiodiffusion et des télécommunications canadiennes, ou CRTC, est un organisme indépendant du gouvernement chargé de réglementer les systèmes de radiodiffusion et de télécommunications du Canada.
]
| S’est améliorée | 1 |
|---|---|
| A diminué | 2 |
| N’a à peu près pas changé | 3 |
| Ne sait pas [ne pas lire] | 99 |
Partie: Données démographiques
Merci. Nous avons maintenant quelques questions aux fins de classement. Soyez assuré que vos réponses demeureront confidentielles.
D1. Consigner le sexe de l’interlocuteur [NE PAS LE DEMANDER]
| Homme | 1 |
|---|---|
| Femme | 2 |
D2. Pouvez-vous m’indiquer votre année de naissance?
_____________ [CONSIGNER L’ANNÉE POUR CALCULER L’ÂGE] Ne sait pas ou refus D3 [Si la réponse à la question D2 est « Ne sait pas ou refus »] À des fins de classement, pourriez-vous me dire si vous avez : [LIRE LA LISTE]
| Entre 18 et 34 ans | 1 |
|---|---|
| Entre 35 et 49 ans | 2 |
| Entre 50 et 54 ans | 3 |
| Entre 55 et 64 ans | 4 |
| 65 ans ou plus | 5 |
| REFUSE [NE PAS LIRE] |
[DEMANDER À TOUS]
D3. Pouvez-vous confirmer que vous habitez en/au/aux/à [À PARTIR DE LA LISTE]? [AU BESOIN, DIRE Ce renseignement sera utilisé uniquement aux fins de classement.]
| Oui | 1 |
|---|---|
| Non | 2 |
D4. [Si répondu 2 (non) à la question D3] Dans quelle province ou quel territoire habitez-vous? [LIRE LA LISTE]
| Alberta | 1 |
|---|---|
| Colombie-Britannique | 2 |
| Manitoba | 3 |
| Nouveau-Brunswick | 4 |
| Terre-Neuve-et-Labrador | 5 |
| Nouvelle-Écosse | 6 |
| Ontario | 7 |
| Île-du-Prince-Édouard | 8 |
| Québec | 9 |
| Saskatchewan | 10 |
| Yukon | 11 |
| Nunavut | 12 |
| Territoires du Nord-Ouest | 13 |
D5. Quel niveau de scolarité avez-vous atteint? [LIRE LA LISTE AU BESOIN – N’INSCRIRE QU’UNE RÉPONSE]
| École primaire | 1 |
|---|---|
| École secondaire | 2 |
| Diplôme d’études secondaires ou l’équivalent | 3 |
| Certificat ou diplôme d’apprenti inscrit ou d’une école de métiers | 4 |
| Certificat ou diplôme d’un collège, d’un cégep ou d’un autre établissement non universitaire | 5 |
| Certificat ou diplôme universitaire inférieur au baccalauréat | 6 |
| Baccalauréat | 7 |
| Diplôme d’études supérieures supérieur au baccalauréat | 8 |
| [NE PAS LIRE] Préfère ne pas répondre | 99 |
D6. Quelle est votre langue maternelle (c’est-à-dire la première langue que vous avez apprise à la maison)?
(NE LISEZ PAS) INSCRIRE UNE SEULE RÉPONSE]
| Français | 1 |
|---|---|
| Anglais | 2 |
| Autre [PRÉCISER ____________] | 8 |
| Ne sait pas ou pas de réponse | 99 |
D7. Dans quelle catégorie se situe le revenu total de votre ménage? C’est-à-dire le total des revenus avant impôts de toutes les personnes habitant avec vous? [LIRE LA LISTE – N’INSCRIRE QU’UNE RÉPONSE]
| Moins de 20 000 $ | 1 |
|---|---|
| De 20 000 $ à moins de 40 000 $ | 2 |
| De 40 000 $ à moins de 60 000 $ | 3 |
| De 60 000 $ à moins de 80 000 $ | 5 |
| De 80 000 $ à moins de 100 000 $ | 6 |
| De 100 000 $ à moins de 150 000 $ | 7 |
| 150 000 $ et plus | 8 |
| [NE PAS LIRE] Refus | 99 |
D8. Laquelle des catégories suivantes décrit le mieux votre emploi actuel? Êtes-vous […]? [LIRE LA LISTE – N’INSCRIRE QU’UNE RÉPONSE]
| Employé(e) à temps plein (35 heures ou plus par semaine) | 1 |
|---|---|
| Employé à temps partiel (moins de 35 heures par semaine) | 2 |
| Travailleur/travailleuse autonome | 3 |
| Sans emploi, mais à la recherche d’un emploi | 4 |
| Étudiant ou étudiante à temps plein | 5 |
| À la retraite | 6 |
| À l’extérieur du marché du travail (personne au foyer à temps plein ou sans emploi et non à la recherche d’emploi) | 7 |
| Autre situation d’emploi | 8 |
| [NE PAS LIRE] Refus | 99 |
Voilà qui conclut le sondage. Je vous remercie.
[1] Please note that all note that not all service providers had fully implemented the December 2017 changes to the Wireless Code at the time of survey and as such, the results may under-represent the full impact of the December 2017 changes.
[2] Please note that all note that not all service providers had fully implemented the December 2017 changes to the Wireless Code at the time of survey and as such, the results may under-represent the full impact of the December 2017 changes.
[3] As of December 1, 2017, only the account holder or an authorized user can consent to data overages beyond the $50 Wireless Code cap. The CRTC made this change to address difficulties family plan customers were having with data overages. However, Rogers and Telus were granted extensions in making these changes, which may have resulted in some Rogers and Telus family plan customers continuing to experience difficulties managing their data at the time this survey was completed.
[4] Note this result may be due to the recent purchase of Manitoba MTS by Bell.
[5] Note: Question wording changed in Fall 2016.
[6] Note: question changed and results are not comparable to previous years.