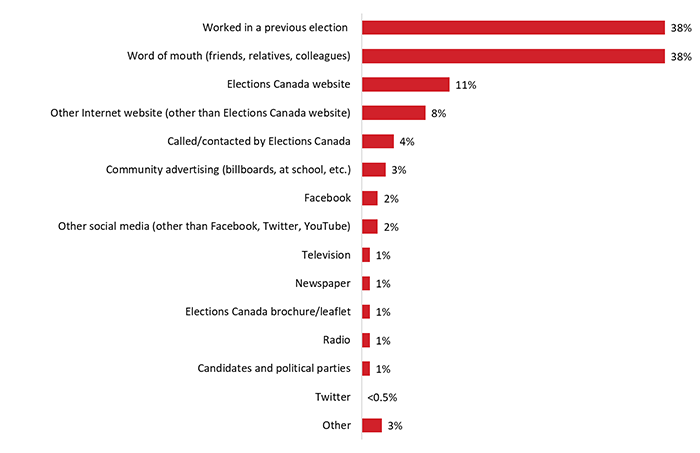
Figure 1: Awareness of Opportunity to Work in the Federal Election
Text version of graph "Figure 1: Awareness of Opportunity to Work in the Federal Election"
This section presents insights on how election officers became aware of the job opportunity and discusses findings pertaining to the experiences of recruitment and assistant recruitment officers.2
Election officers were most likely to have become aware of the opportunity to work at the 2019 federal election because they worked in a previous election (38%) or through word of mouth from friends, relatives or colleagues (38%). Fewer became aware of the opportunity to work in the federal election through Elections Canada's website (11%) or through non-Elections Canada websites (8%). The full range of responses is depicted below in Figure 1.
Text version of graph "Figure 1: Awareness of Opportunity to Work in the Federal Election"
Election officers from Saskatchewan (46%) were more likely than those from Ontario (38%), British Columbia (36%), Alberta (36%) and Manitoba (32%) to have heard of the opportunity to work in the federal election through word of mouth. Awareness of the opportunity to work in the federal election by working in a previous election was higher in Quebec (45%) and Manitoba (45%).
Recruitment and assistant recruitment officers (23%) and central poll supervisors (25%) were less likely than officers working in other positions to have learned of the opportunity to work in the federal election through word of mouth. Recruitment and assistant recruitment officers (63%), followed by central poll supervisors (55%), were more likely to have become aware of the opportunity because they worked in a previous election.
Those working at polling stations in First Nations communities (60%) were more likely than election officers working at regular polling stations (37%), student campuses (39%) and seniors' residences or long-term care facilities (41%) to have learned of the opportunity through word of mouth. They were also less likely to have become aware of the opportunity by working in a previous election (21% compared to 38% of officers working at a regular polling station, 40% working at a student campus poll and 41% working at seniors' residences or long-term care facilities).
The likelihood of becoming aware of the opportunity through word of mouth was highest among 16 to 24 year olds (61%) and lowest among those aged 75 and older (20%). Conversely, the likelihood of having learned of the opportunity by working in a previous election generally increased with age, from 10% of 16 to 24 year olds to 61% of those aged 75 and older.
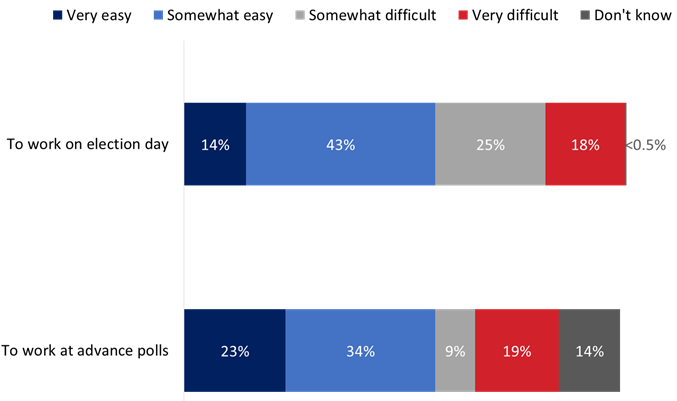
Fifty-seven percent (57%) of recruitment officers and assistant recruitment officers found it easy to recruit individuals to work at the polls on election day and at advance polls. Recruitment officers and assistant recruitment officers were also more likely to say that it was difficult recruiting staff to work at polling stations on election day (43%) than to work at advance polls (28%).
Q9. Was the process of recruiting individuals to work at advance polls very easy, somewhat easy, somewhat difficult or very difficult? Base: n=101; recruitment officers and assistant recruitment officers only.
Q10. Was the process of recruiting individuals to work at polling stations on election day very easy, somewhat easy, somewhat difficult or very difficult? Base: n=101; recruitment officers and assistant recruitment officers only.
Text version of graph "Figure 2: Ease of Recruiting Individuals to Work at the Polls"
Half (50%) of the recruitment officers and assistant recruitment officers surveyed said the reason individuals gave for no longer being interested in working as a poll worker was scheduling conflicts—that is, working at the polls conflicted with a day job or school.
Other reasons included the number of hours required, which was more than some applicants expected (30%), issues with compensation (22%), loss of interest or lack of availability (22%), and age or health-related issues (15%).
Smaller proportions mentioned other reasons: not understanding the commitment or responsibility (8%) or that the applicant had been looking for positions in one or more electoral districts (2%).

Text version of graph "Figure 3: Reasons for Disinterest in Working at a Polling Station"
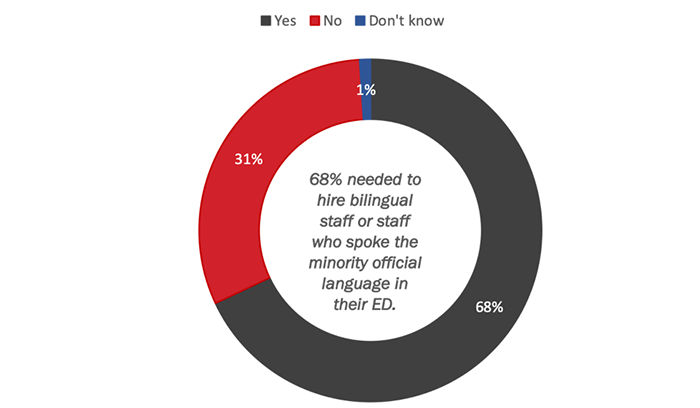
About two-thirds (68%) of the recruitment officers and assistant recruitment officers surveyed needed to hire poll staff who were bilingual or who spoke the minority language in their electoral district. Thirty-one percent (31%) did not need to hire such poll staff, while one percent did not know or could not recall.
Text version of graph "Figure 4: Need to Hire Bilingual Poll Staff"
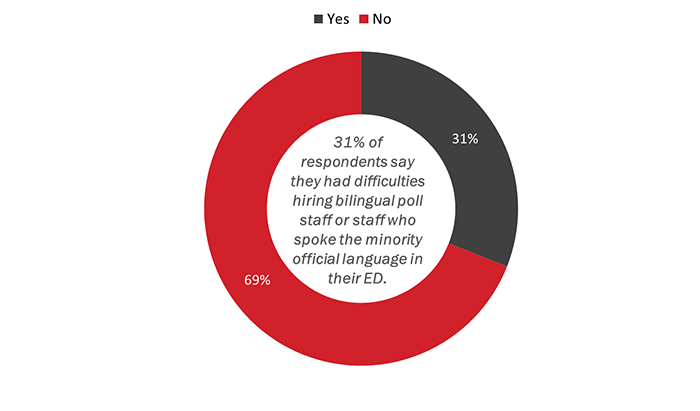
Three in 10 (31%) recruitment officers and assistant recruitment officers who needed to hire bilingual poll staff or staff who spoke the minority official language in their riding (n=70) had difficulties doing so. The majority (69%) did not experience any difficulties.
Text version of graph "Figure 5: Difficulty Hiring Bilingual Poll Staff"
Of the recruitment and assistant recruitment officers who experienced difficulties hiring bilingual poll staff or staff who spoke the minority official language in their riding (n=15),3 the majority were unable to find competent and/or interested individuals who spoke the second official language. Other difficulties mentioned include the fact that they found individuals who were interested and available, but not eligible, and that they did not have enough time to hire bilingual poll staff or staff who spoke the minority official language in their riding.
More than half (56%) of the recruitment and assistance recruitment officers surveyed received lists of names of individuals available to work at the polls from candidates. The rest—44%—did not receive any such lists from candidates.
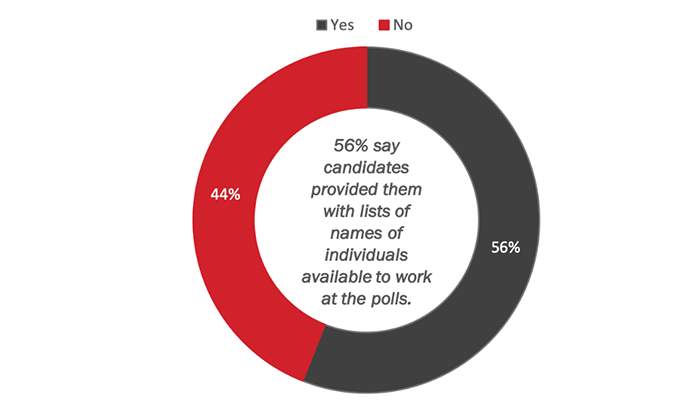
Text version of graph "Figure 6: Lists of Names Provided by Candidates"
Those who received lists of names of individuals available to work at the polls from candidates (n=68) were asked about the completeness of these lists. Three-quarters (75%) reported that the lists did not contain enough suitable individuals. Significantly fewer (19%) said the lists contained a sufficient number of individuals to fill positions in their electoral district. Few (5%) found that the lists they received contained more than enough suitable individuals to work at the polls.
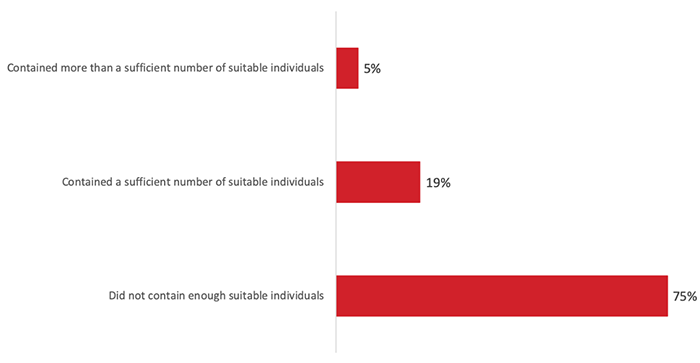
Text version of graph "Figure 7: Suitability of the Lists of Names Provided by Candidates"
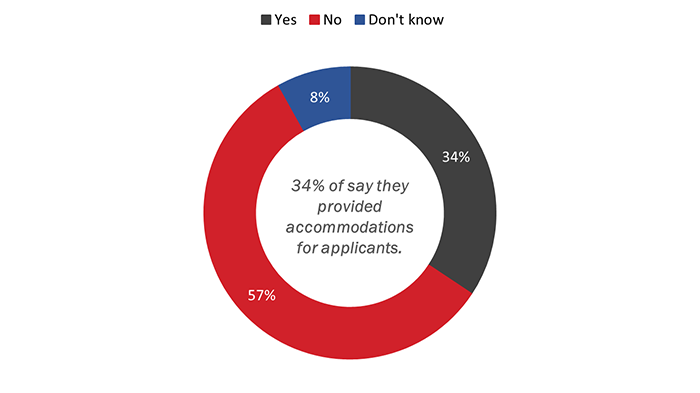
Approximately one-third (34%) of recruitment officers and assistant recruitment officers provided accommodations for an applicant experiencing mental or physical barriers to be able to participate in the interview or the training. More than half (57%) did not and 8% did not know or could not recall whether accommodations were provided for any applicants.
Among the recruitment and assistant recruitment officers who needed to provide special accommodations for applicants (n=374), most provided accommodations to overcome physical barriers. Very few provided other types of accommodations.
Approximately six in 10 (59%) recruitment and assistant recruitment officers were not satisfied with the Recruitment Management System (RMS), including 45% who were not at all satisfied. Just over one in ten (12%) were very satisfied, while 29% were somewhat satisfied with the RMS.
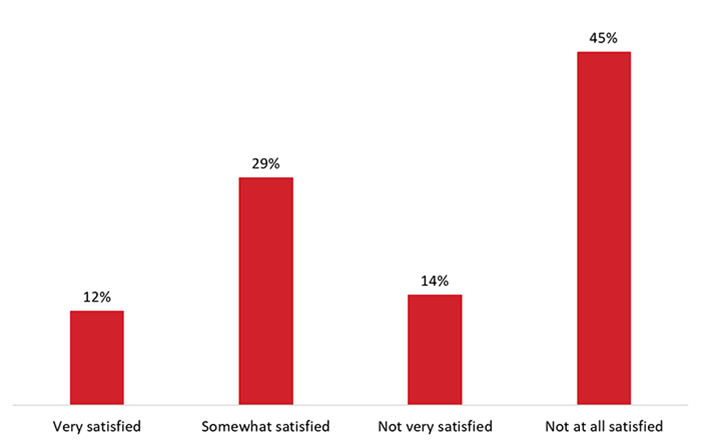
Text version of graph "Figure 9: Level of Satisfaction with the Recruitment Management System"
More than half (59%) of those not satisfied with the RMS (n=60) attributed their dissatisfaction to the system's limited functionality. Other reasons frequently cited were the RMS' lack of ease of use and navigation (26%), its lack of efficiency and duplication (25%), and its speed/performance (25%). Approximately one in five said the RMS lacks accuracy of information (20%) and that the system is not reliable or crashed (19%). The full range of responses is depicted below in Figure 10.
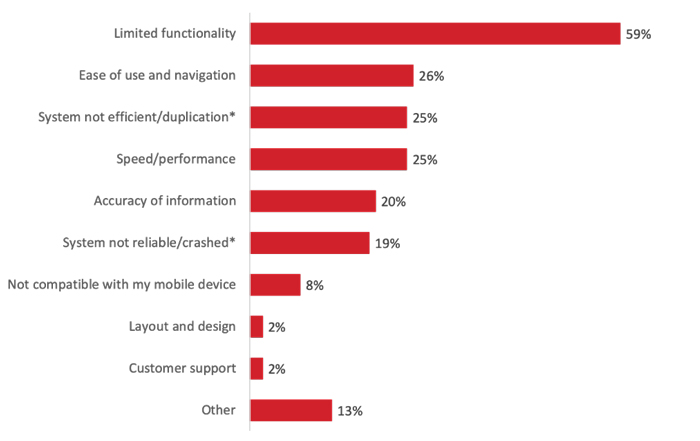
Text version of graph "Figure 10: Reasons for Dissatisfaction with RMS"
Just over half (56%) of the recruitment officers and assistant recruitment officers surveyed used the services of community relations officers to fill positions at the polls in their electoral district. In contrast, approximately one-quarter (24%) used regional media advisors to fill positions.
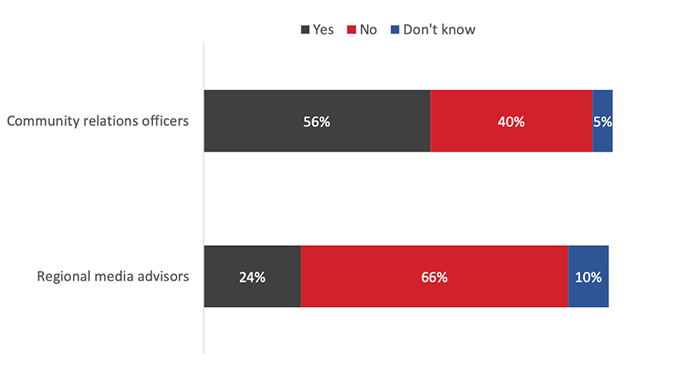
Text version of graph "Figure 11: Use of Services to Fill Positions at the Polls"
Most of those who used regional media advisors or community relations officers to fill positions in their electoral district were somewhat or very satisfied with the service they received from these individuals.5
Seven in 10 (72%) recruitment and assistant recruitment officers said that they did not use the Field Support Network (FSN). Approximately one in five (19%) reported that they did use the FSN, while 9% did not know or could not recall. Most of the officers who used the FSN (n=27)6 were somewhat or very satisfied with the network.
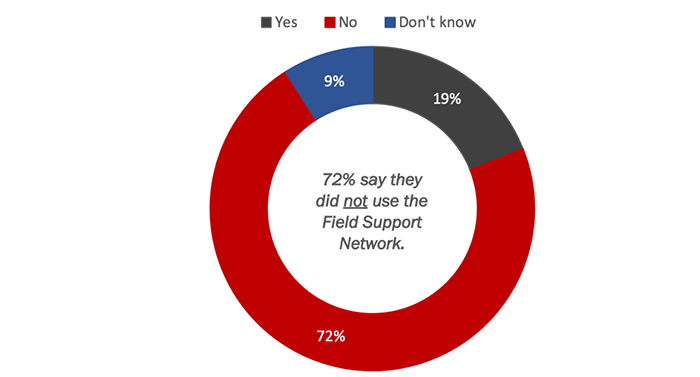
Text version of graph "Figure 12: Use of the Field Support Network"
This section provides information about some characteristics of the election officers who participated in the survey.
Forty-two percent (42%) of election officers had no previous experience working as an election officer in a federal or provincial election. In contrast, 27% said they previously worked in a federal or provincial election, 23% in only a provincial election, and 8% in only a federal election.
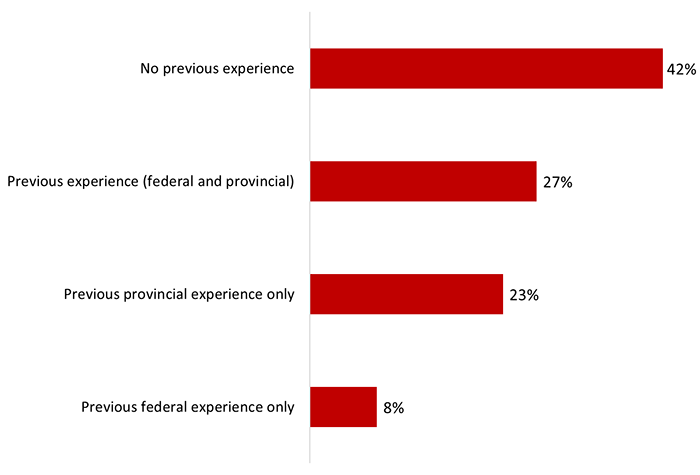
Text version of graph "Figure 13: Previous Experience as an Election Officer"
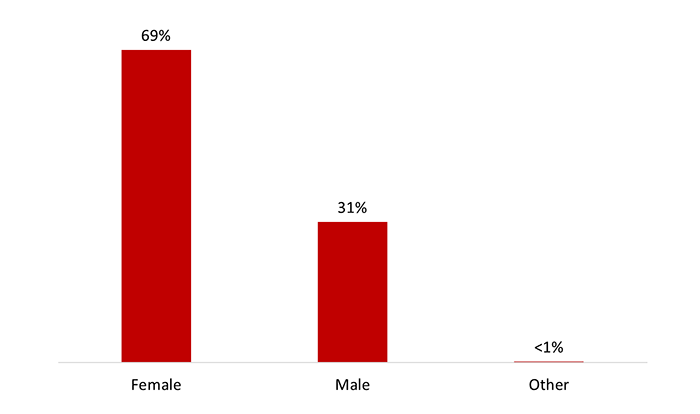
The majority of election officers identify as female (69%), while approximately one-third (31%) are male.
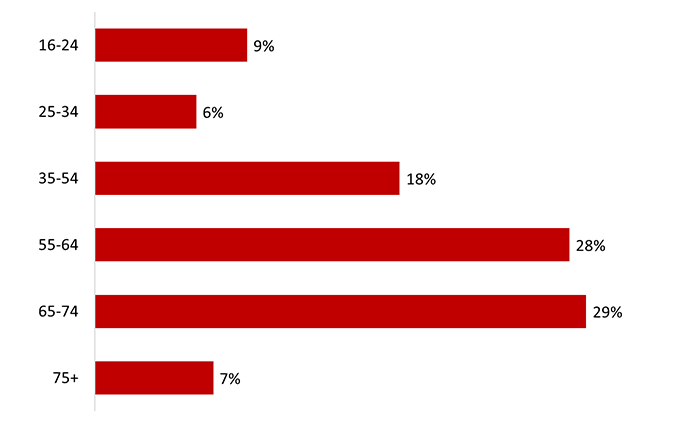
Fifty-seven percent (57%) of election officers fall between the ages of 55 and 74 (28% are between 55 and 64, while 29% are 65 to 74). One-third (33%) are under 55 years of age and few are aged 75 or older (7%).
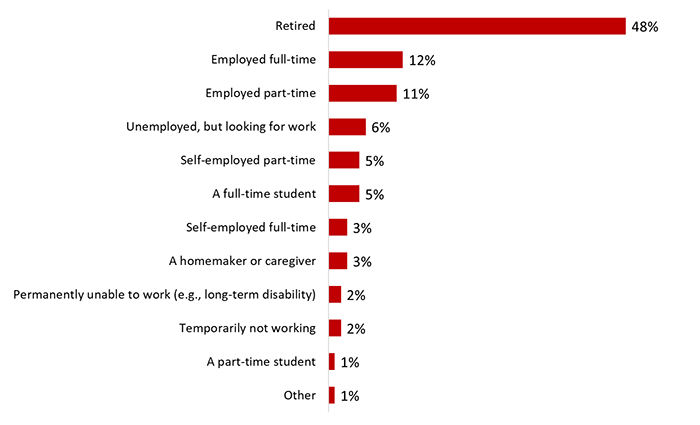
Approximately half (48%) the election officers surveyed said they are retired. Following this, 12% are employed full-time, and 11% are employed part-time.
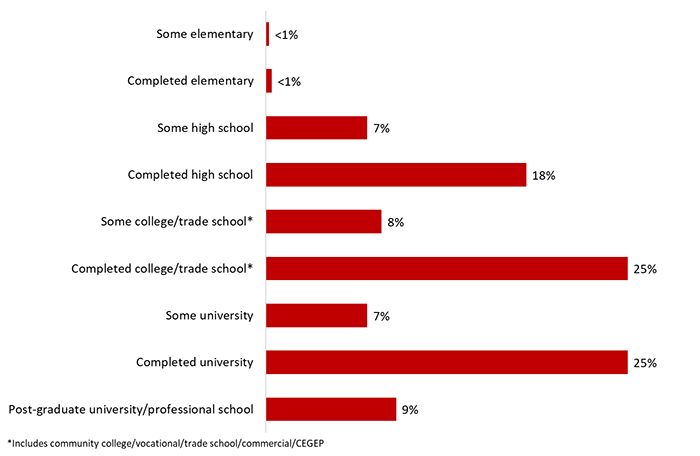
Many election officers have completed post-secondary studies: 25% completed college, 25% university, and 9% completed a post-graduate university degree. Fifteen percent (15%) have completed some post-secondary studies, while 18% have completed high school and 7% have not completed high school.
Text version of graph "Figure 17: Highest Level of Education Reached"
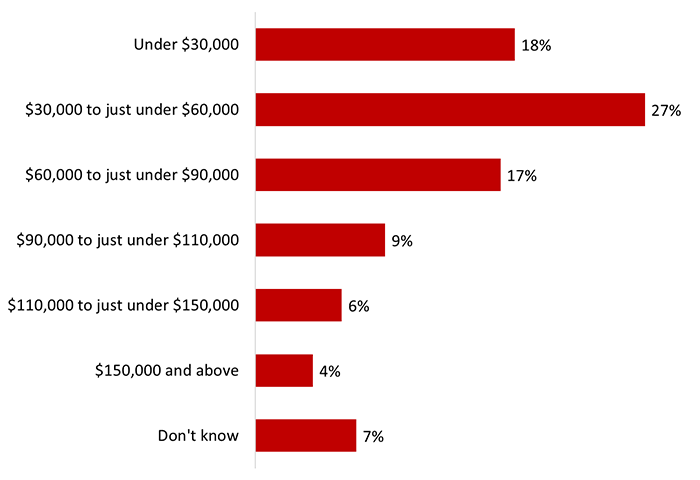
Forty-five percent (45%) of election officers reported household incomes of under $60,000 a year, including 27% with annual incomes between $30,000 and $59,999. A little over one-third (36%) of officers reported annual household incomes of $60,000 or more.
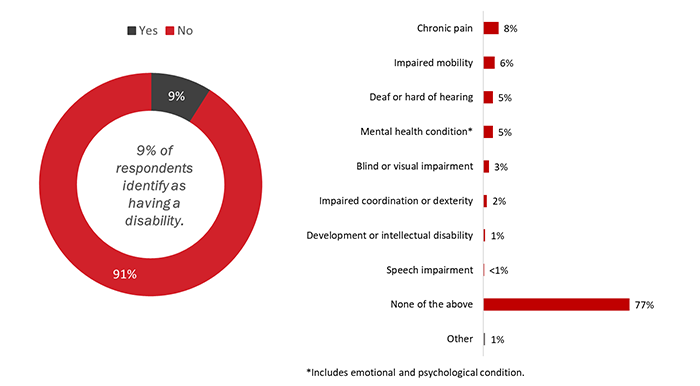
A split sample was used to test question wording. When asked whether they identify as having a disability, 9% of election officers in the first sample said they do not. When the second sample was, instead, asked whether they experience a number of conditions, 23% identified at least one of the conditions. The full range of conditions can be found in Figure 19.
Q78. Do you identify as having a disability? Base: n=2,129; SPLIT SAMPLE all respondents [DK/NR: <1%].
Q79. Would you please indicate whether you have any of the following conditions? Base: 2,129 Split Sample all respondents. [DK/NR: <1%].
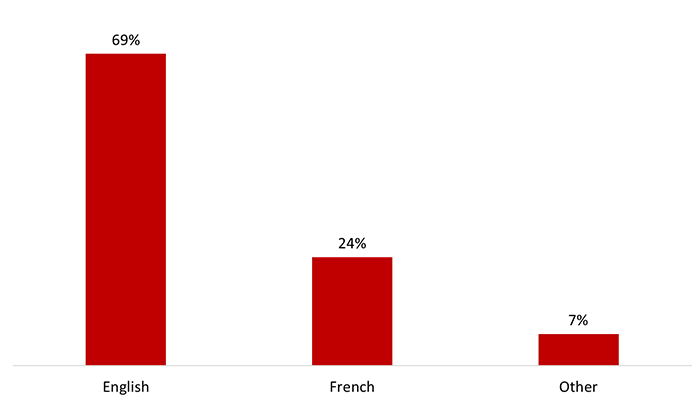
A majority of election officers (69%) speak English most often at home. Approximately one-quarter (24%) speak French, while 7% speak a language other than English or French.
Four in five election officers (81%) were born in Canada, while an additional 3% were born a Canadian citizen, but outside of the country. Eighteen percent (18%) were born outside of Canada.
When asked about their ethnic or cultural background, more than three-quarters (77%) characterized themselves as white or Caucasian. The full range of backgrounds can be found in Figure 21.
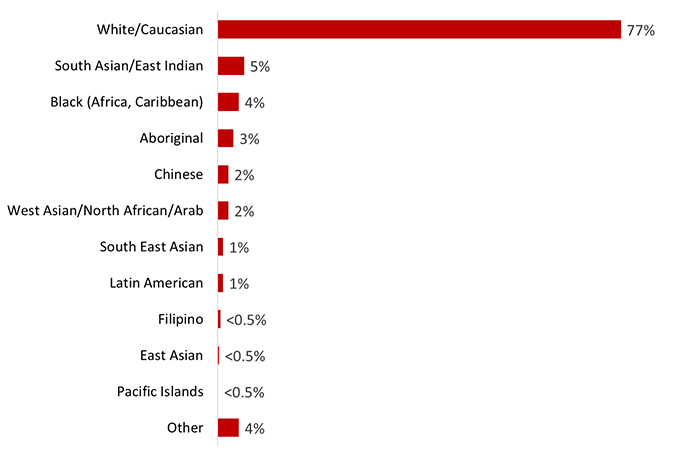
Text version of graph "Figure 21: Ethnic and Cultural Background"
This section discusses poll workers' satisfaction with the training they received, as well as their perceived level of preparedness to undertake their tasks during the federal election following their training.
More than eight in 10 poll workers (83%) were somewhat or very satisfied with the training session. Over the last decade, satisfaction with the training remains virtually unchanged: 86% in 2008, 83% in 2011 and 84% in 2015.
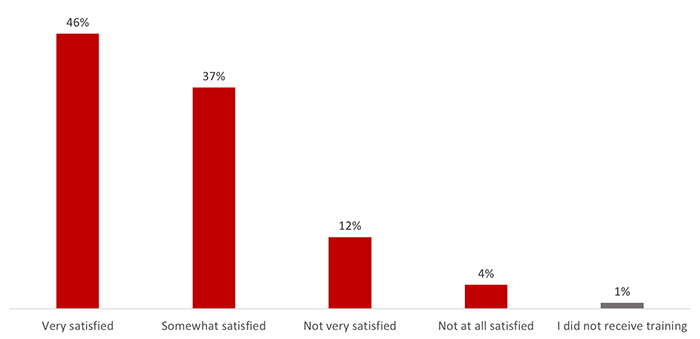
Text version of graph "Figure 22: Level of Satisfaction with Training"
Poll workers in Manitoba (90%) and Alberta (88%) were more likely than those in other regions of the country to be somewhat or very satisfied with the training session (80% of poll workers in the Atlantic region, 81% in British Columbia, 82% in Quebec and Saskatchewan, and 83% in Ontario).
Information officers (87%) were more likely to be somewhat or very satisfied with the training they received than central poll supervisors (78%), registration officers (82%) and deputy returning officers (83%).
When it comes to the type of poll, poll workers who worked on election day at a regular poll (85%) or at a mobile poll (83%) were more likely to be satisfied with the training session than officers who worked at an advance poll (75%).
Poll workers between the ages of 16 and 24 (90%) were the most likely to report being satisfied with the training session. Together with 35 to 54 year olds (52%) and those aged 75 and older (51%), 16 to 24 year olds (56%) also were more likely to be very satisfied with the training they received.
Poll workers not satisfied with the training session (n=677) were asked to identify which aspects of the training they were not satisfied with. Approximately one-third each pointed to the quality of training (34%) and to their perception that the training session did not provide enough information (32%). Other aspects of the training with which poll workers were not satisfied included the staff/trainers (29%), the clarity of the information (25%), the length of the training session (it was too short) (23%), and practical/hands-on aspect of the training (there was not enough) (16%). The full range of responses is depicted below in Figure 23.

Text version of graph "Figure 23: Unsatisfactory Aspects of Training"
There are no noteworthy subgroup differences to report.
Almost nine in 10 (88%) poll workers who worked at least one of their scheduled shifts said the training they received prepared them somewhat or very well to undertake their tasks during the last federal election. At 88%,7 the overall level of preparedness of poll workers has decreased from the high of 96% reported in 2015 (89% in 2011). Of note, the decline from 2015 to 2019 is particularly acute in the proportion of poll workers who said they were very well prepared to undertake their tasks, which dropped from 63% in 2015 to 39% in 2019.
Poll workers who were absent for all their scheduled shifts were asked how well prepared they felt following their training. More than eight in 10 (83%) said they felt prepared, with 41% saying they were very well prepared. Sixteen percent (16%) said they did not feel prepared to undertake their tasks following training, with 4% among them saying they were not well prepared at all.
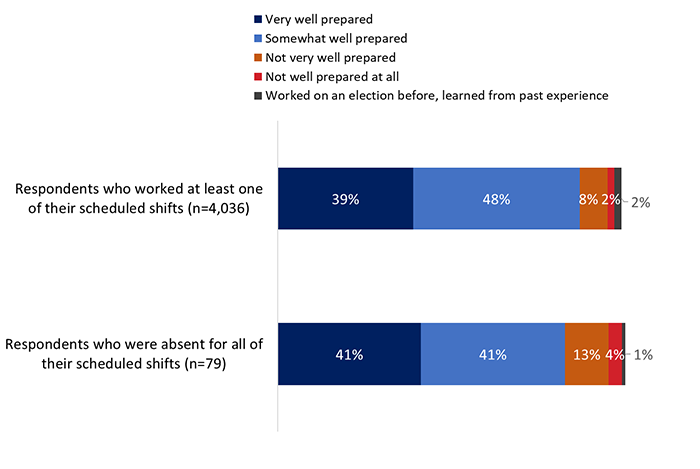
Text version of graph "Figure 24: Perceived Level of Preparedness Following Training"
Among the poll workers who were present for at least one of their scheduled shifts, those in Ontario (89%) were more likely than their counterparts in the Atlantic provinces (84%) to feel somewhat or very prepared. Information officers were significantly more likely to feel prepared than those working in other positions (94% say they were somewhat or very well prepared compared to 86% of registration officers, 87% of poll clerks and deputy returning officers, and 88% of central poll supervisors). There were no significant differences in level of preparedness by type of poll.
This section presents findings related to poll workers' experiences working at their polling station.
Nine in 10 (90%) expressed satisfaction with the way the last federal election went, including 53% who were very satisfied. In 2019, the level of satisfaction with the way the last federal election went is identical to 2015, when 90% of poll workers also expressed satisfaction. Overall satisfaction, however, remains slightly lower than the 93% reported in 2011.
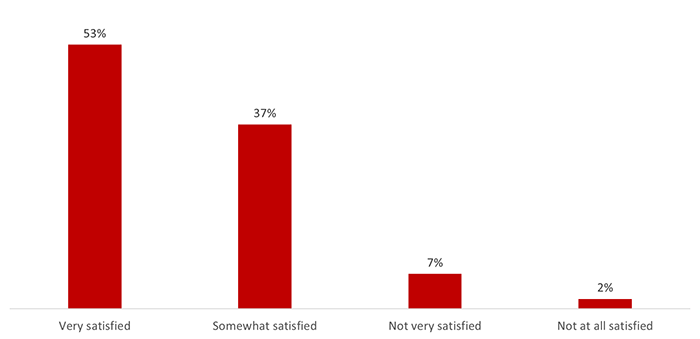
Text version of graph "Figure 25: Overall Satisfaction with Federal Election"
Compared to Quebec (87%), higher proportions of poll workers in the Atlantic provinces (93%) and Saskatchewan (93%) reported being satisfied with the way the last federal election went. Satisfaction is higher and stronger among information officers than among deputy returning officers; specifically, 93% of information officers said they were satisfied, including 66% who were very satisfied with the way the last federal election went. In contrast, 89% of deputy returning officers were satisfied, including 51% who were very satisfied overall. Satisfaction levels did not differ in any significant way by type of poll.
Poll workers between the ages of 16 and 24 (97%) were the most likely to report being satisfied with the way the last federal election went.
Ninety-six percent (96%) of the poll staff surveyed agreed strongly (73%) or somewhat (23%) that the voting process at their polling location went smoothly. Very few (4%) said the voting process did not go smoothly at their polling station.
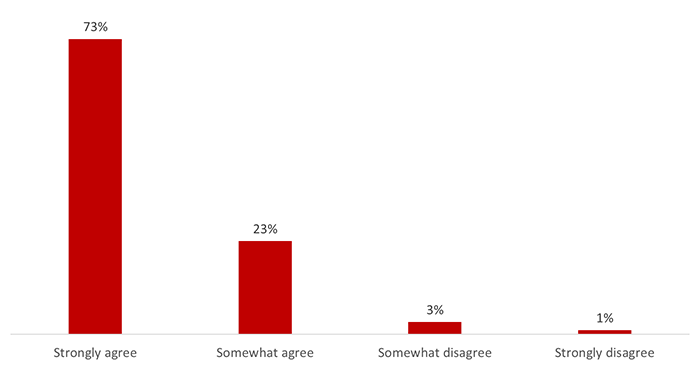
Text version of graph "Figure 26: Extent to Which the Voting Process Went Smoothly"
Poll workers in Manitoba (80%), followed by Atlantic Canada (78%), were more likely to strongly agree that the voting process went smoothly at their polling station. Those who worked at a regular polling station (73%) were more likely to strongly agree that the voting process went smoothly than those who worked at a seniors' residence or long-term care facility (66%). There were no noteworthy differences in perceptions by position.
More than nine in 10 poll workers (95%) agreed that poll workers in polling stations worked well together, including 80% who strongly agreed. In addition, most did not experience problems setting up or closing the polling station.
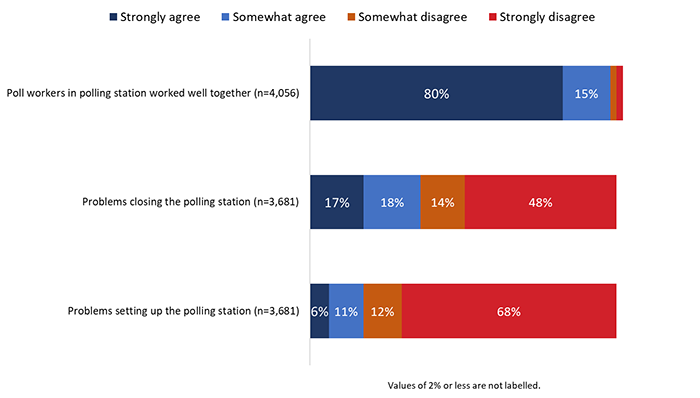
Text version of graph "Figure 27: Problems Encountered at the Polling Station"
Poll workers who agreed there were difficulties opening and/or closing the polling station (n=1,525) were asked to identify the types of difficulties they encountered. One-third (33%) said that instructions were not clear, while nearly one in four (23%) said the procedures, instructions and organization were poor. Following this, approximately one in five said there was either not enough assistance from colleagues (19%) or that there was a lack of knowledge, information, or training needed to close (19%). Seventeen percent (17%) reported problems with vote counting and 15% found the process of opening and/or closing the polling station time-consuming. The full range of responses is depicted in Figure 28.
The proportion of poll workers who said the instructions for closing the poll were not clear has increased significantly since 2015—21% said closing the polls did not go well due to unclear instructions in 2015 compared to 33% in 2019 (a 12 percentage point increase).

Text version of graph "Figure 28: Types of Difficulties Opening and Closing Polling Station"
Poll workers in Quebec were significantly more likely to say there were problems opening and/or closing the polling station due to missing instructions for closing the polls (22%). Meanwhile, officers in Ontario were more likely to say that there were problems opening/closing the polls due to problems with vote counting (22%).
Poll clerks and deputy returning officers were more likely to report that there were problems opening and/or closing polls because instructions were not clear (37% and 32% respectively). Additionally, poll clerks and deputy returning officers are also more likely to characterize the process of opening and/or closing the polling station as time-consuming (16% and 17% respectively).
The differences based on type of polling station were not noteworthy.
Nine in 10 (91%; up four percentage points since 2015) poll staff said that the building where they worked was suitable for holding an election.
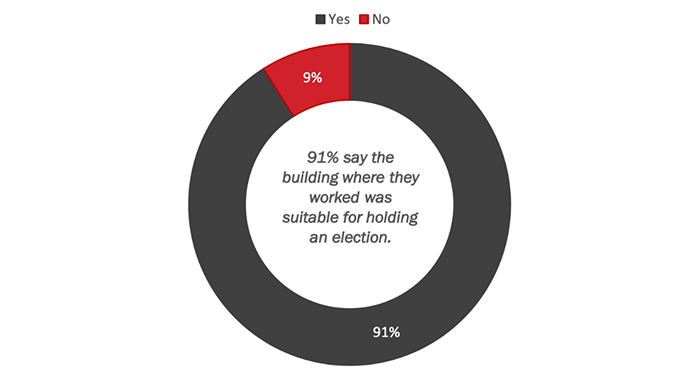
Poll workers in Saskatchewan (95%) were more likely than those in Ontario (90%) or Quebec (90%) to say the building where they worked was suitable for holding an election. There were no noteworthy differences based on type of position. When it comes to type of polling station, those working at regular stations (91%) were more likely than those working at a seniors' residence or long-term care facility (85%) to say the building where they worked was suitable for holding an election.
Poll workers who said the building where they worked was not suitable for holding an election (n=373) were asked which aspects where unsuitable. More than one-third each said the room where they worked was too small (35%) or the building had poor facilities (35%) (washrooms, break areas, etc.). Approximately one in five reported that the building was not accessible for people with disabilities (20%), and 16% each mentioned that the room was too cold, or that there were issues with accessibility (general). The full range of responses is depicted in Figure 30.
Consistent with 2015, the size of the rooms remains the most common complaint regarding the buildings. In 2015, among those who said the building where they worked was not suitable for holding an election, 36% said that there was not enough room (compared to 35% in 2019). Additionally, there is little fluctuation in the proportion of poll workers who said the building was not accessible for people with disabilities; specifically, in 2015, 18% said the building was not accessible for people with disabilities compared to 20% in 2019. Finally, the proportion of poll workers who said the building was too cold has decreased, from 29% in 2015 to 16% in 2019.
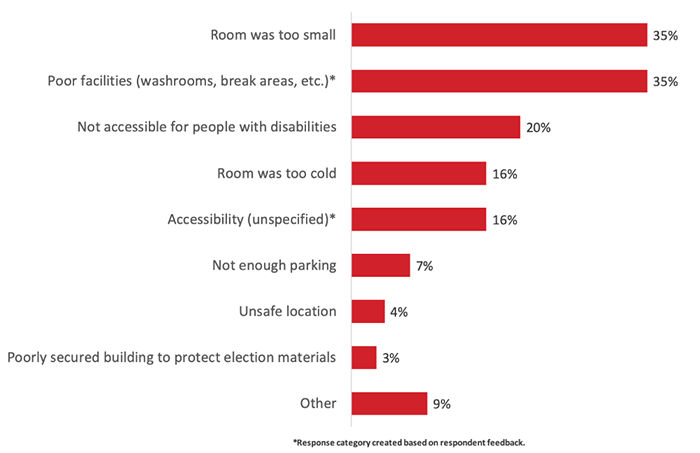
Text version of graph "Figure 30: Reasons Location of Polling Station Was Not Suitable"
Poll workers in Alberta (47%) were significantly more likely than those in British Columbia (20%), Manitoba (16%), Ontario (18%) and Quebec (10%) to say the building was not accessible for people with disabilities. Information officers (37%) were more likely to point to lack of accessibility for people with disabilities than deputy returning officers (18%), poll clerks (15%) and registration officers (15%). More than half (56%) of those who worked at a polling station in a seniors' residence or long-term care facility during the election said the building was not suitable for holding an election because the room was too small (compared to 34% of those who worked at a regular polling station).
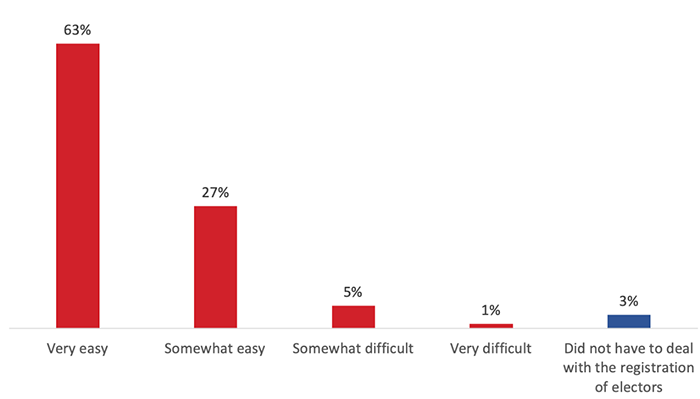
Nine in 10 (90%) central poll supervisors, deputy returning officers, and registration officers said it was easy to register electors, with 63% saying it was very easy. Perceptions of the ease of registering electors have improved since 2015, when 86% of central poll supervisors, deputy returning officers, and registration officers said this was easy. Most notably, the proportion of these officers saying it was very easy to register electors has increased significantly, from 47% in 2015 to 63% in 2019.
Text version of graph "Figure 31: Ease of Registering Electors"
Central poll supervisors, deputy returning officers, and registration officers in Ontario (68%) and Quebec (63%) were significantly more likely than officers in Alberta (53%) to say it was very easy to register electors. The likelihood of saying it was very easy to register electors was higher among those working at regular polling stations (64%) than among those working a seniors' residence or long-term care facility (55%).
There were no noteworthy differences based on position; however, first-time officers (91%) were more likely than those with previous federal experience (87%) to have said it was easy to register electors. There were very few differences based on age. Of note, 35 to 54 year olds (93%) were more likely than 65 to 74 year olds (88%) to have found it easy to register electors.
More than eight in 10 (83%) central poll supervisors, deputy returning officers, registration officers, and poll clerks said it was easy to deal with exceptional cases, such as completing various certificates or administering oaths, including 43% who said it was very easy to accommodate these cases. The proportion of these officers who found it easy to deal with exceptional cases is virtually identical to 2015 when 84% of specified officers found dealing with exceptional cases to be somewhat or very easy.
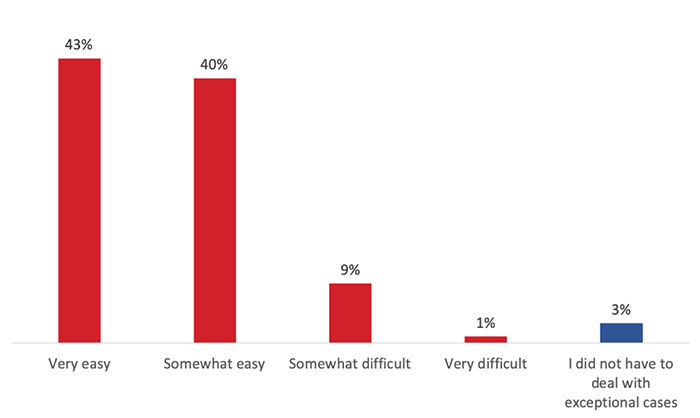
Central poll supervisors, deputy returning officers, registration officers, and poll clerks working in Quebec were less likely to find this aspect of their job very easy (34% compared to 40% to 48% of these officers in other regions). Those working in regular polling stations (43%) were more likely than those working at seniors' residences or long-term care facilities (35%) to say it was very easy to deal with exceptional cases.
In addition, those with previous federal experience (48%) were more likely than first-time officers (40%) to have found dealing with exceptional cases to be very easy. Finally, when it came to age, 35 to 54 year olds (50%) were more likely to have found this aspect of their job very easy as compared to 16 to 24 year olds (41%) and 55 to 74 year olds (41%).
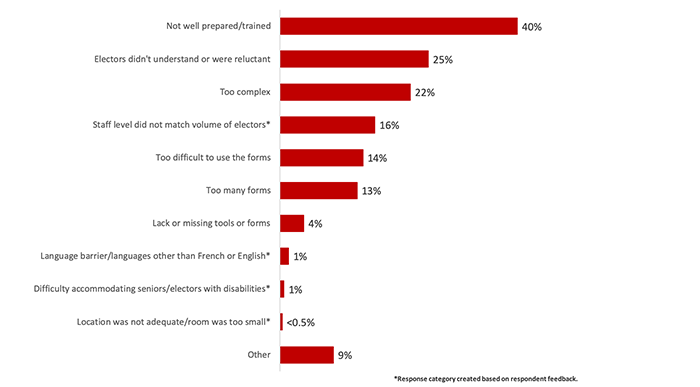
Central poll supervisors, deputy returning officers, registration officers, and poll clerks who said accommodating exceptional cases was difficult (n=353) were asked the reason(s) for which it was difficult to accommodate these requests. Four in 10 (40%; up from 31% in 2015) said they were not well prepared or trained to do so. In addition, similar proportions found it difficult to accommodate these cases because electors did not understand or were reluctant (25%; down from 34% in 2015) or because it was too complex (22%; down from 26% in 2015). The full range of responses is depicted in Figure 33.
Text version of graph "Figure 33: Reasons for Difficulties Accommodating Exceptional Cases"
Those in Alberta who said it was difficult to accommodate exceptional cases were more likely to attribute this to not being well prepared/trained (55% compared to 31% of those in Quebec). Those in Ontario were, instead, more likely to say that accommodating exceptional cases was difficult because the forms they were provided were difficult to use (22% compared to 7% of those in British Columbia and 2% of those in Alberta).
Noteworthy differences by staff position include the following:
The likelihood of saying that electors did not understand was higher among those working in seniors' residences or long-term care facilities (42%) than those working at regular polling stations (24%).
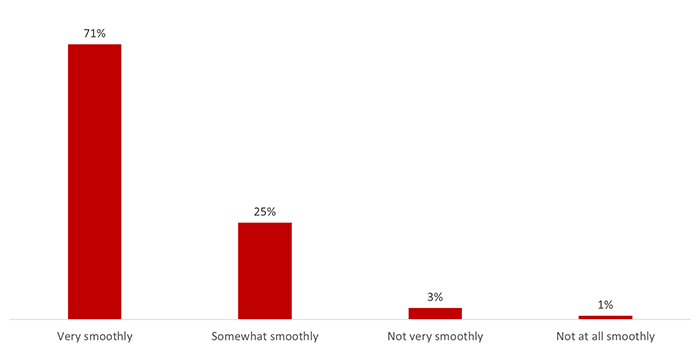
Ninety-five percent (95%)8 of poll staff said the flow of electors at the polls went smoothly; slightly more than seven in 10 (71%) said the flow went very smoothly, while one-quarter (25%) said it went somewhat smoothly. Satisfaction with the flow of electors is similar to previous election years, and up two percentage points since 2015; specifically, 94% said the flow of electors went smoothly in 2008, 95% in 2011, and 93% in 2015 compared to 95% in 2019.
Text version of graph "Figure 34: Flow of Electors at the Polls"
Poll workers in Quebec (81%) were among those most likely to say that during their working hours, the flow of electors went very smoothly at the polls. Compared to central poll supervisors (66%) and registration officers (67%), information officers (74%) were more like to say the flow of electors went very smoothly.
Poll workers working in polling stations in First Nations communities (75%) and at regular stations (71%) were more likely than officers working at seniors' residences or long-term care facilities (64%) or on student campuses (62%) to say the flow of electors went very smoothly during working hours.
The likelihood of saying that the flow of electors went very smoothly generally increased with age, from 55% of poll staff between the ages of 16 and 24 year olds to 74% of staff 55 to 64, 75% of staff 65 to 74, and 76% of staff aged 75 and older. In addition, those who worked all their scheduled shifts (96%) were more likely than those who worked only some of their shifts (85%) to have said that the flow of electors went smoothly.
Poll staff who said the flow of electors at the polls went poorly (n=185) were asked to identify the reason(s). Nearly one in four (37%) said it was due to long lineups and wait times. Additionally, poll staff noted that the flow of electors was impacted by the following: disorganization or confusion (27%), too many voters/crowds (19%), the need for more staff/help (12%), staff lack of preparedness to work (11%), and unpredictability (10%). The full range of responses is depicted in Figure 35.
Long lineups and wait times remain the most common reason poll staff offered to explain why the flow of electors was not smooth. However, the proportion pointing to lineups and wait times has increased considerably since 2015: 19% in 2015 compared to 37% in 2019. Moreover, disorganization and confusion also remain among the top reasons offered, but again, the proportion attributing problems to this has increased since 2015: 19% in 2015 compared to 27% in 2019.

Text version of graph "Figure 35: Reasons the Flow of Electors at the Polls Went Poorly"
The sample size is too small to discuss differences by subgroups.
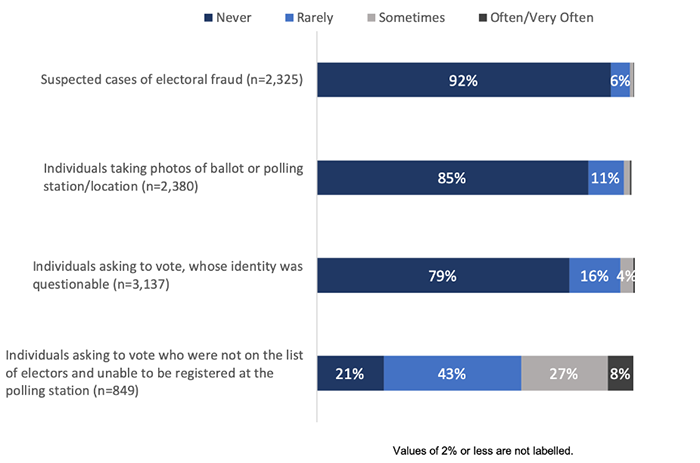
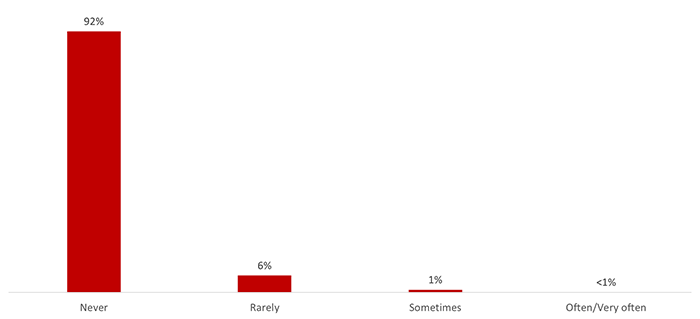
The vast majority of poll staff never or rarely experienced suspected cases of electoral fraud (97%), of individuals taking photos of ballots or polling station locations (96%), or of individuals asking to vote whose identity was questionable (95%). In contrast, 35% of poll staff said they sometimes or often encountered individuals asking to vote who were not on the list of electors and who were unable to be registered at the polling station.
Text version of graph "Figure 36: Frequency of Certain Problems at the Polls"
Poll workers in Saskatchewan (98%), followed by British Columbia (95%) and Atlantic Canada (94%) were among those most likely to say they never experienced suspected cases of electoral fraud. Additionally, poll clerks (94%) and deputy returning officers (93%) were more likely than other officers to say they never experienced suspected cases of electoral fraud.
The likelihood of never experiencing individuals taking photos of ballots or polling stations was higher among the following:
Deputy returning officers (80%) and poll clerks (79%) were more likely than other officers to say they never experienced individuals asking to vote whose identity was questionable.
Poll workers who worked at polling stations in First Nations communities (20%) were significantly more likely to say they often experienced individuals asking to vote who were not on the list of electors.
Ninety-four percent (94%) of poll workers did not notice any issues with candidates' representatives performing their duties. The proportion of poll workers that witnessed issues with candidates' representatives performing their duties—5%—is unchanged since 2015 when 6% noted such issues.
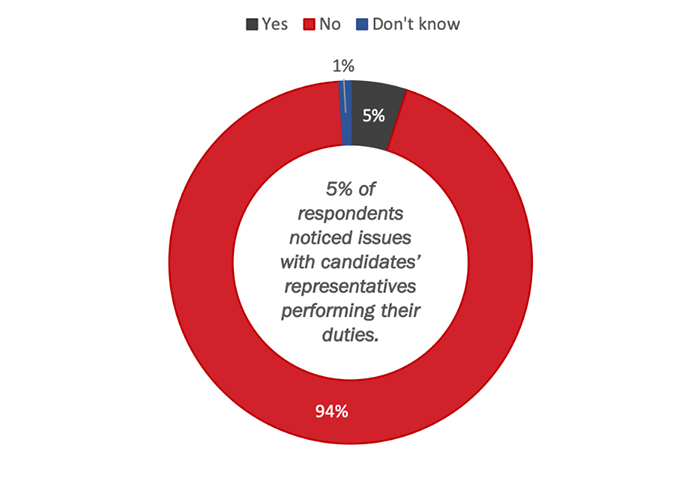
Text version of graph "Figure 37: Candidates' Representatives"
Poll workers in British Columbia were among the most likely to say they noticed issues with candidates' representatives performing their duties; specifically, 9% noticed issues with candidates' representatives. Central poll supervisors (10%) were also more likely to say they noticed issues with candidates' representatives performing their duties as compared to all other staffing positions.
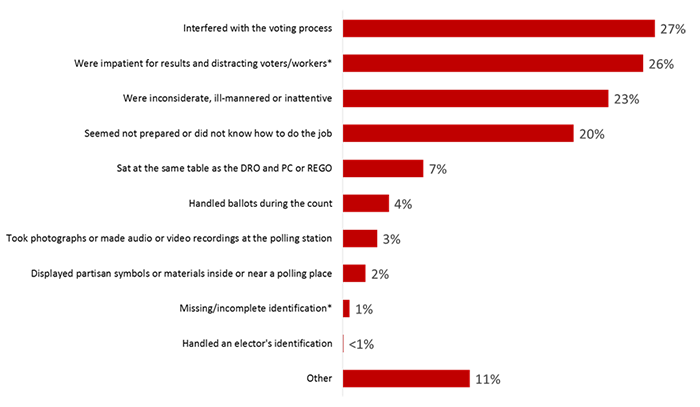
Poll staff who said they noticed issues with candidates' representatives performing their duties (n=204) were asked the nature of these issues. Approximately one in four noticed candidates' representatives interfering with the voting process (27%) or being impatient for results and distracting voters/workers (26%). Following this, 23% witnessed candidates' representatives being inconsiderate/ill-mannered/or inattentive and 20% found these representatives to be unprepared or not knowledgeable about how to do the job. The full range of responses is depicted in Figure 38.
The most commonly reported problem with candidates' representatives performing their duties remains the same as was reported in 2015. In 2015, 30% of poll workers witnessed a candidate's representative interfering with the voting process, while in 2019, 27% said the same. The proportion of poll staff who said that candidates' representatives were inconsiderate/ill-mannered/inattentive has increased 12 percentage points since 2015 (from 11% in 2015 to 23% in 2019), while the proportion saying that candidates' representatives were not properly prepared/did not know how to do the job has increased slightly since 2015–17% mentioned this as a concern in 2015, while 20% in 2019 said the same.
Text version of graph "Figure 38: Types of Issues with Candidates' Representatives"
Poll workers in Ontario (34%) were more likely than those from British Columbia (15%) to say that candidates' representatives were impatient for results/distracting voters and workers. Differences by position and type of polling station were not significant.
Ninety-seven percent (97%) of poll staff agreed that voting booths provided voters with enough privacy to vote, including 83% who strongly agree.
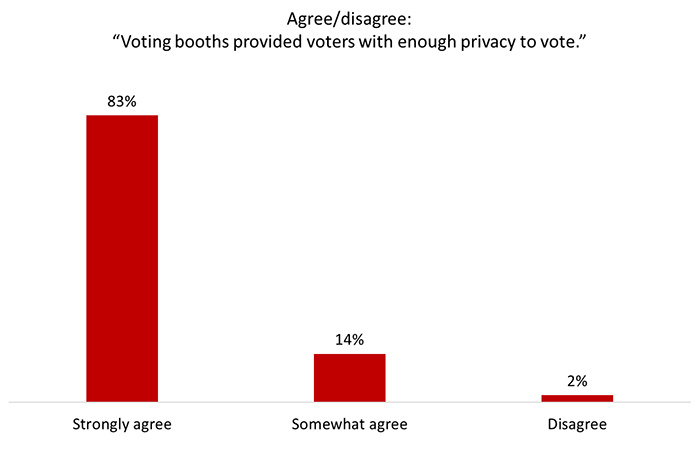
The likelihood of strongly agreeing that voting booths provided voters with sufficient privacy was higher among:
Nine in 10 (91%; unchanged from 92% in 20159) poll staff said that the training they received prepared them somewhat or very well to provide services to electors with disabilities. While the proportion of poll workers who said they were prepared to provide services to electors with disabilities is virtually unchanged since 2015, fewer staff characterized themselves as very well prepared in 2019 (58%) compared to 2015 (67%).
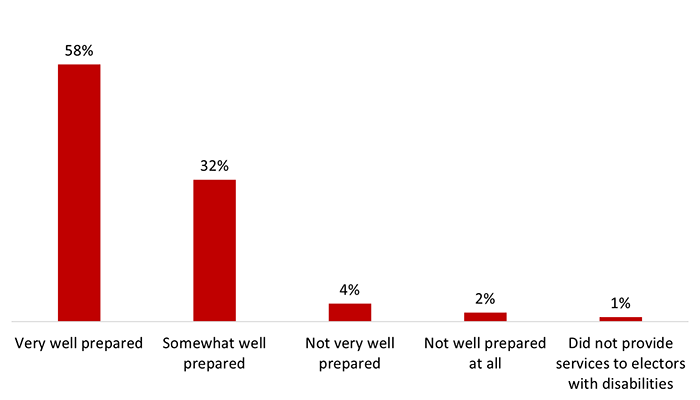
Text version of graph "Figure 40: Preparedness to Provide Services to Electors with Disabilities"
Poll staff in Manitoba (97%) were more likely than staff in other regions to view themselves as somewhat or very well prepared to provide services to electors with disabilities. Central poll supervisors (73%) were most likely to say they were very well prepared to provide such services. In addition, poll workers who worked at polling stations in First Nations communities (69%) were more likely than those who worked in seniors' residences/long-term care facilities (52%) to have said they were very well prepared to provide services to electors with disabilities.
Poll staff between the ages of 16 and 24 (46%) were less likely than poll staff aged 35 and older (60% of 35 to 54 year olds, 57% of 55 to 64 year olds, 60% of 65 to 74 year olds, and 69% of those aged 75 and older) to have felt the training prepared them very well to provide services to electors with disabilities.
The majority of poll staff surveyed (90%; compared to 91% in 2015) said the tools and services for electors with disabilities at their polling station were suitable.
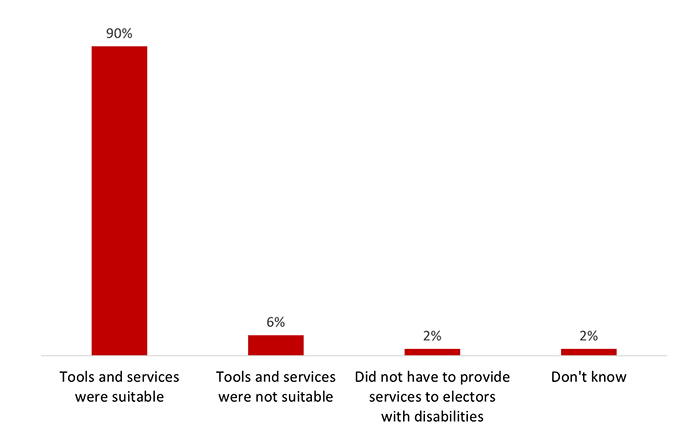
Text version of graph "Figure 41: Suitability of Tools and Services for Electors with Disabilities"
The likelihood of finding the tools and services for electors with disabilities at their polling station suitable was higher among:
Approximately one in five (19%) poll staff noticed electors with disabilities having difficulties completing their ballots. The majority—79%—did not.
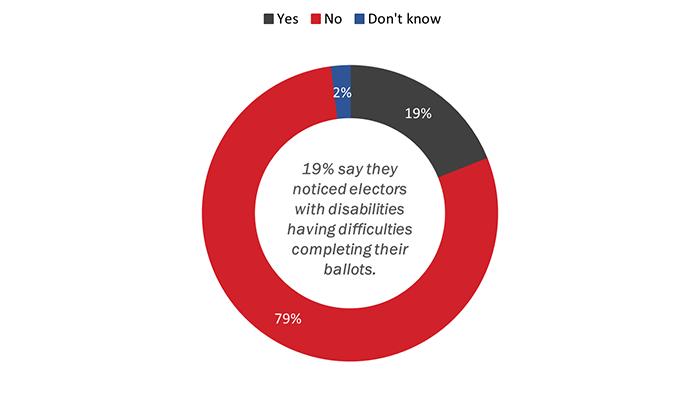
Text version of graph "Figure 42: Electors with Disabilities"
Poll workers in Ontario (22%) were more likely than those in Alberta (16%) and Quebec (16%) to have noticed electors with disabilities having difficulties completing their ballot. Registration officers (13%) were least likely to say they noticed electors with disabilities having difficulties completing their ballot. In addition, poll staff working at polling stations at seniors' residences or long-term care facilities (51%) were most likely to notice electors with disabilities having difficulties.
Poll staff who noticed electors with disabilities having difficulties completing their ballot (n=978) were asked how often they noticed this. Sixty-three percent (63%) said they rarely noticed electors with disabilities having difficulties completing their ballots, while 29% said this happened sometimes.
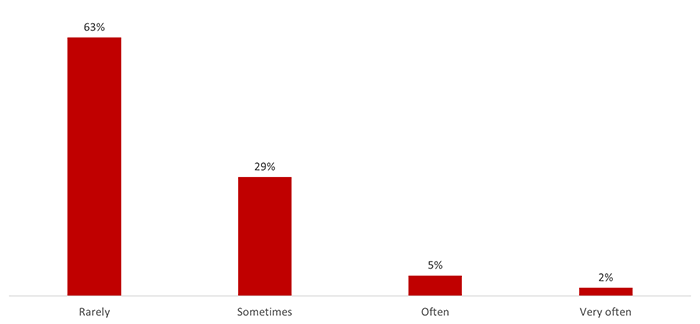
Poll workers in Quebec (50%) and Atlantic Canada (40%) were more likely to sometimes notice electors with disabilities having difficulties completing their ballot. Information officers (74%) and deputy returning officers (68%) were significantly more likely than poll clerks (55%) to rarely have noticed electors with disabilities having difficulties. In contrast, poll workers working at polling stations at seniors' residences or long-term care facilities (28%) were most likely to often or very often notice electors with disabilities having difficulties completing their ballot.
Ninety-six percent (96%) of poll staff did not encounter any difficulties providing services to electors in either official language. Three percent (3%; up from 1% in 2015) did experience difficulties providing services to electors in English or French.
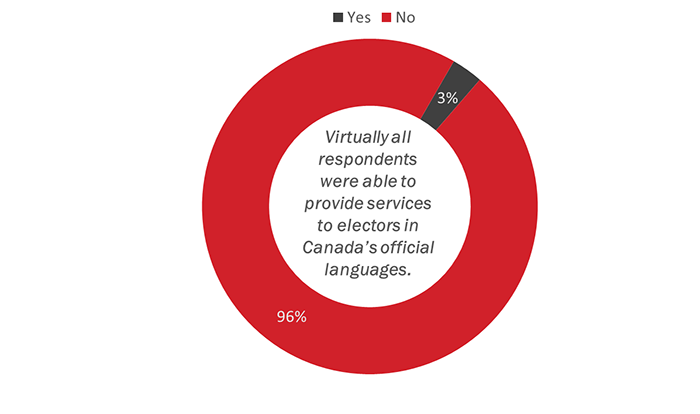
Text version of graph "Figure 44: Difficulties Providing Services to Electors in Official Languages"
There are no noteworthy subgroup differences to report.
This section presents results related to poll workers' satisfaction with the election materials provided to them.
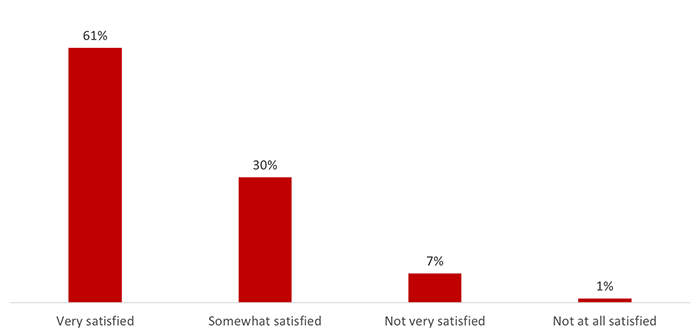
Of the poll staff surveyed, nine in 10 (92%)10 reported being satisfied with the election materials that were provided to them, including 61% who were very satisfied. Very few (8%) were not very or not at all satisfied with the election materials. Satisfaction levels are consistent with previous results: 89% were satisfied in 2015 and 90% in 2011. What is noteworthy, however, is that the proportion of poll workers very satisfied with these materials has increased significantly, from 52% in 2015 to 61% in 2019.
Text version of graph " Figure 45: Level of Satisfaction with Election Materials Provided"
Poll workers in Atlantic Canada (67%), Manitoba (67%), and Ontario (65%) were more likely than poll workers in Quebec (55%) to be very satisfied with the election materials. Information officers (69%), followed by poll clerks (63%) and deputy returning officers (62%), were more likely than registration officers (55%) and central poll supervisors (50%) to be very satisfied with these materials. There were no significant differences based on the type of polling station officers worked at during the election nor shift attendance (whether they attended some or all of their scheduled shifts).
Age-related differences were pronounced, with poll workers between the ages of 16 and 24 (74%) more likely to be very satisfied with the election materials than older workers (64% of 35 to 54 year olds, 57% of 55 to 64 year olds, 60% of 65 to 74 year olds and 61% of staff aged 75 and older).
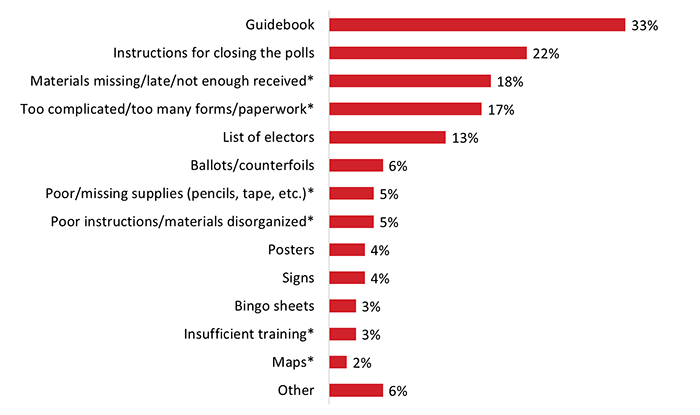
Poll workers who were not satisfied with the election materials they were provided (n=326) were asked which materials were unsatisfactory. One-third (33%) were not satisfied with the guidebook (up from 26% in 2015). The guidebook was followed, at a distance, by the instructions for closing the polls (22%), missing or insufficient quantities of materials (18%), and the opinion that the materials themselves were overly complicated (17%), including the view that there were too many forms and paperwork. Thirteen percent (13%) were not satisfied with the lists of electors. The full range of responses is depicted in Figure 46.
Text version of graph "Figure 46: Unsatisfactory Election Materials"
There were no significant differences based on region. That said, noteworthy differences by staff position included the following:
There were no significant differences based on the type of polling station officers worked at during the election nor shift attendance.
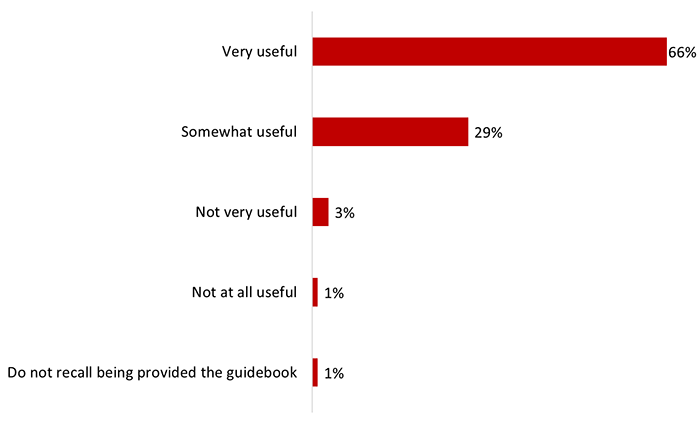
There was widespread agreement among poll workers that the guidebook was useful, with 95% of poll workers saying that it was somewhat (29%) or very (66%) useful. While the overall perceived usefulness of the guidebook is unchanged since 2015 (95% in 2015 and 2019), the proportion of poll workers who rated the guidebook as very useful has increased significantly compared to 2015 (from 59% in 2015 to 66% in 2019).
Text version of graph "Figure 47: Perceived Usefulness of the Guidebook"
The likelihood of viewing the guidebook as very useful was higher in Atlantic Canada (73%), Ontario (71%), Manitoba (70%), Saskatchewan (67%), and British Columbia (67%) than it was in Alberta (63%) and Quebec (57%). Deputy returning officers (71%), followed by information officers (68%), were more likely to rate the guidebook as very useful. There were no significant differences based on the type of polling station officers worked at during the election. Poll workers who did not miss a shift (95%) were more likely than those who were absent for at least one shift (83%) to view the guidebook as useful. In addition, the likelihood of viewing the guidebook as very useful was higher among 25 to 34 year olds (74%), 16 to 24 year olds (72%), those aged 75+ (71%), and 35 to 54 year olds (70%) compared to poll works aged 55 to 64 (62%).
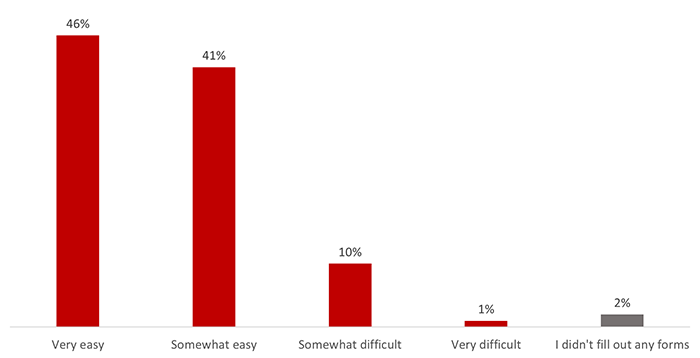
Eighty-seven percent (87%; up from 85% in 2015) of poll workers found the various forms provided easy to complete, including 46% who found them very easy to complete.
Text version of graph "Figure 48: Level of Difficulty Completing the Various Forms Provided"
Poll workers in Ontario (51%) and Alberta (50%) were significantly more likely than poll workers in Saskatchewan (39%) and Quebec (35%) to say the forms were very easy to complete. Poll workers in Manitoba (50%), the Atlantic region (49%) and British Columbia (47%) also were more likely than their counterparts in Quebec (35%) to view the forms as very easy to complete. Registration officers (58%) and information officers (54%) were most likely to say the various forms were very easy to complete.
There were no significant differences based on the type of polling station officers worked at during the election nor shift attendance.
The likelihood of saying the various forms were very easy to complete was generally higher among younger staff: 56% of 35 to 54 year olds, 54% of 25 to 34 year olds, and 52% of 16 to 24 year olds compared to 43% of 55 to 64 year olds and 41% of 65 to 74 year olds.
Among the poll workers who had difficulty completing the various forms (n=456), approximately one in five (19%) said the special procedure forms were not easy to use and 16% said this about the registration forms. In addition, 13% found the tally sheets difficult to use, 13% said the closing forms were difficult to use, and 12% pointed to the forms in general, that they were not clear, that they did not have the knowledge needed to complete the forms, or that the forms required more instructions. The full range of responses is depicted in Figure 49.

Text version of graph "Figure 49: Types of Forms That Were Difficult to Use"
The likelihood of saying that the special procedure forms (36%) and events log (19%) were difficult to use was higher among poll workers in Quebec. There were no noteworthy differences based on position, type of polling station, shift attendance, nor age of poll worker.
Poll workers were asked to what extent they agreed or disagreed that election instructions are too complex to understand quickly and easily. In response, four in 10 (39%) agreed that this was a problem. The majority (59%) did not.
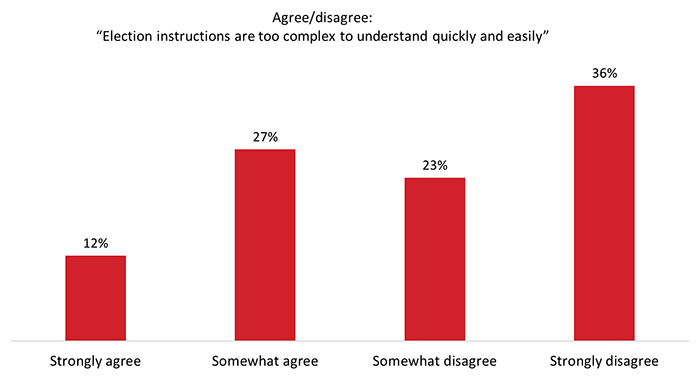
Text version of graph "Figure 50: Complexity of Election Instructions"
The likelihood of strongly agreeing that election instructions are too complex to understand quickly and easily was higher among:
There were no noteworthy differences based on type of polling station or shift attendance.
This section reports poll staff feedback on the voter identification requirements.
Ninety-nine percent (99%) of poll staff said the identification of electors at their polling station went somewhat (20%) or very (79%) well. Compared to 2015, a greater proportion of poll workers said the identification process went very well (79% in 2019 compared to 68% in 2015).
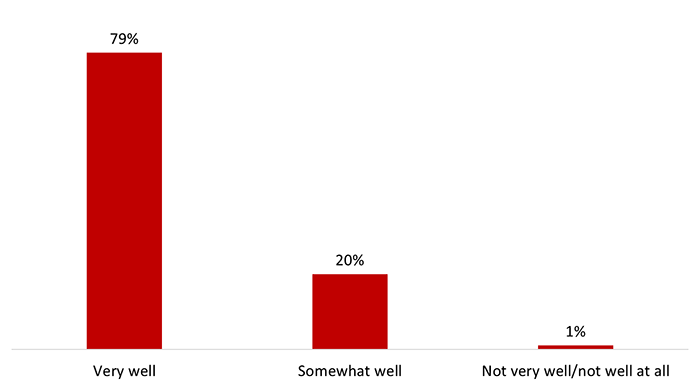
Text version of graph "Figure 51: Ease of Identification of Electors"
The likelihood of saying the identification of electors went very well at their polling location was higher among:
Registration officers and deputy returning officers (n=1,756) were asked how well prepared they were to apply the voter identification requirements. Similar to 2015, 98% of these officers said they were somewhat (20%) or very (78%) well prepared to apply the voter ID requirements. In 2015, 97% of registration officers and deputy returning officers said they were very (72%) or somewhat (25%) prepared to apply the voter identification requirements.
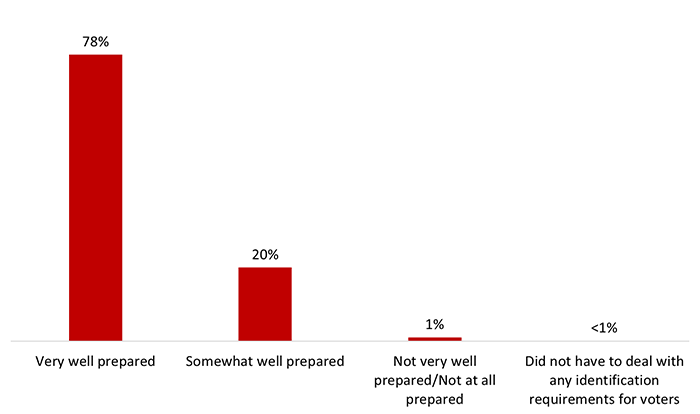
Text version of graph "Figure 52: Ability to Apply the Voter Identification Requirements"
Registration officers and deputy returning officers in Alberta (62%) were among those least likely to say they were very well prepared to apply the voter identification requirements. Compared to registration officers (66%), deputy returning officers (82%) were more likely to consider themselves very well prepared to apply the identification requirements. Those who worked at a regular polling station (79%) were most likely to say they were very well prepared to apply the identification requirements. In addition, those under 35 years of age (100%) were more apt to say they were prepared compared to those 35 to 54 (97%), 55 to 64 (98%) and 65 to 74 (98%).
Similar to 2015 (91%), 95% of poll workers said electors were somewhat (41%) or very (54%) well prepared to apply the voter identification requirements. What has changed since 2015 is the proportion of poll workers who felt electors were very well prepared to meet the ID requirements. In 2015, 43% of poll workers said that electors were very well prepared compared to 54% in 2019 (an 11 percentage point increase).
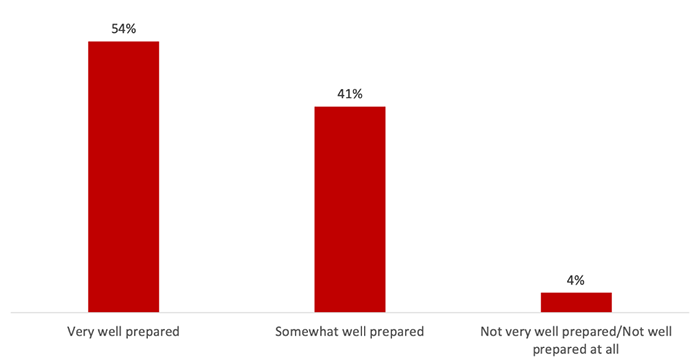
Information officers (45%) and registration officers (37%) were among those least likely to say that electors seemed very well prepared to meet the voter identification requirements. Regional differences were not pronounced and there were no significant differences by type of polling station. Poll staff aged 75 and older (64%) were more likely than most younger staff (50% of 16 to 24 year olds, 44% of 25 to 34 year olds, 52% of 55 to 64 year olds, and 53% of 65 to 74 year olds) to report that electors seemed very well prepared.
Information officers, registration officers, deputy returning officers, and poll clerks (n=3,582) were asked if they noticed electors having difficulties proving their address or identity. Twenty-seven percent (27%) noticed electors having difficulties proving their address, while 14% noticed electors having difficulties proving their identity.
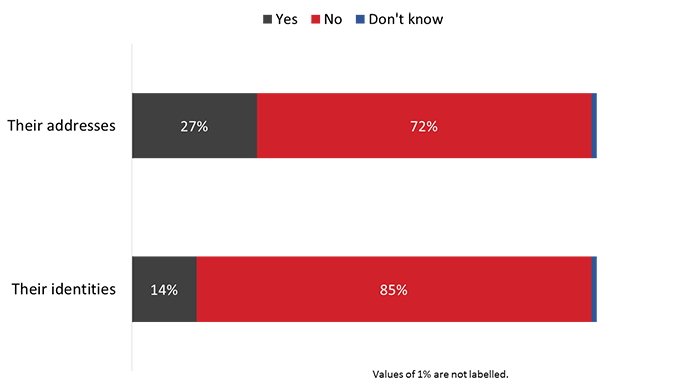
Text version of graph "Figure 54: Difficulties Proving Address or Identity"
Information officers, registration officers, deputy returning officers, and poll clerks in Saskatchewan (40%) and Alberta (38%) were most likely to have noticed electors having difficulties proving their address. Registration officers, followed by information officers, were among those most likely to have noticed electors having difficulties proving their address (44% and 33%, respectively) and their identity (23% and 19%, respectively). There were no significant differences by type of polling station.
When it came to age-related differences, those aged 75 and older were less likely to have noticed electors having difficulties proving their address (20% compared to 32% of 16 to 24 year olds, 29% of 35 to 54 year olds, and 28% of 55 to 64 year olds) and their identity (10% compared to 16% of 35 to 54 year olds and 15% of 55 to 64 year olds).
Poll staff who noticed electors having difficulties proving their address or identity (n=1,110) were asked to describe the types of difficulties electors were having. As in 2015, addresses that did not match the list of electors is the most common type of difficulty electors had when proving their address. Approximately four in 10 (39%; down from 44% in 2015) noticed electors whose address did not match the list of electors, while nearly identical proportions noticed electors who had improper ID/inability to satisfy the ID requirements (35%) or improper proof of address (34%). The full range of responses are depicted in figure 55.
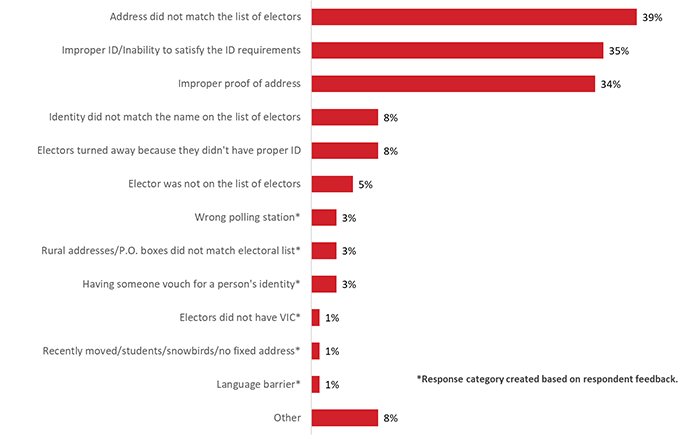
Information officers, registration officers, deputy returning officers, and poll clerks in Quebec (15%) were most likely to notice that electors were not on the list of electors, while improper proof of address was more likely to have been noticed by those in Saskatchewan (50%) and Alberta (45%). Differences in reported difficulties based on staff position and type of poll were not noteworthy.
The following age-related differences are noteworthy:
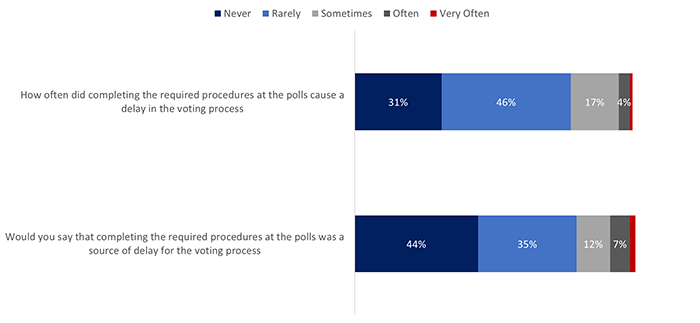
A split sample was used to test two different question formulations. The first sample of registration officers and deputy returning officers was asked whether completing the required procedures at the polls was a source of delay for the voting process. More than four in ten (44%) said that completing the required procedures at the polls was never a source of delay, while 35% say it rarely caused delays. In contrast, 12% said it sometimes caused delays, 7% say it was often a cause of delay, and 2% say it caused delays very often.
The second sample was, instead, asked how often completing the required procedures at the polls caused a delay in the voting process. In this case, 31% of respondents said completing the required procedures never caused a delay, while 46% say it rarely caused delays. In contrast, 17% said the required procedures sometimes cause caused delays, 4% say it often caused delays, and lastly, 1% say the required procedures very often caused delays.
Q53a [recoded]. On a scale of 1 to 10, where 1 means there were no difficulties and 10 means there were many difficulties, would you say that completing the required procedures at the polls was a source of delay for the voting process? Base: n=877 Split Sample registration officers or deputy returning officers only.
Q53b. How often, if at all, did completing the required procedures at the polls cause a delay in the voting process? Base: n=879 Split Sample registration officers or deputy returning officers only.
Text version of graph "Figure 56: Difficulties Completing Required Procedures at the Polls"
Regardless of question formulation, registration officers and deputy returning officers in Quebec were more likely to say this was never a source of delay for the voting process (66% for Q53a and 47% for Q53b). Differences based on staff position and type of poll were not noteworthy. Officers under the age of 55 were less likely than officers aged 55 and older to say this was never a source of delay.
Most poll staff (96%) agreed that the voter information card facilitated the identification of electors, including 80% who strongly agreed that this was the case.
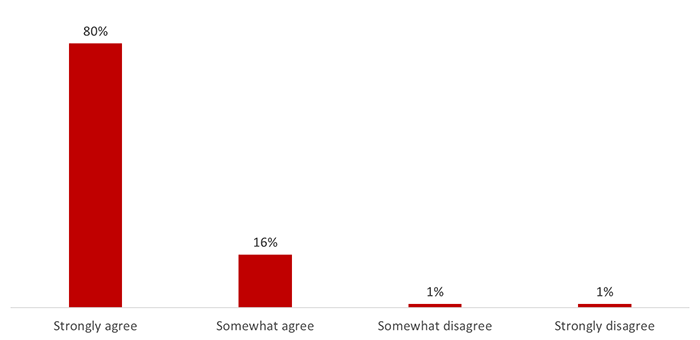
Text version of graph "Figure 57: Ease of Identification with Voter Information Card"
Poll staff who worked in British Columbia (85%), as well as those who worked in Ontario (84%), were more likely to strongly agree that the voter information card facilitated the identification of electors. Differences based on staff position, type of poll and age of staff were not noteworthy.
The majority of poll staff (92%; down from 95% in 201511) never witnessed an elector's identity being challenged by a candidate or their representatives.
Text version of graph "Figure 58: Frequency of Electors' Identity Being Challenged"
The following groups were more likely to say they never witnessed an elector's identity being challenged by a candidate or a candidate's representative:
There were no noteworthy differences based on type of poll.
This section presents findings on poll workers' absenteeism and the impact this had on the work of their colleagues and recruitment officers.
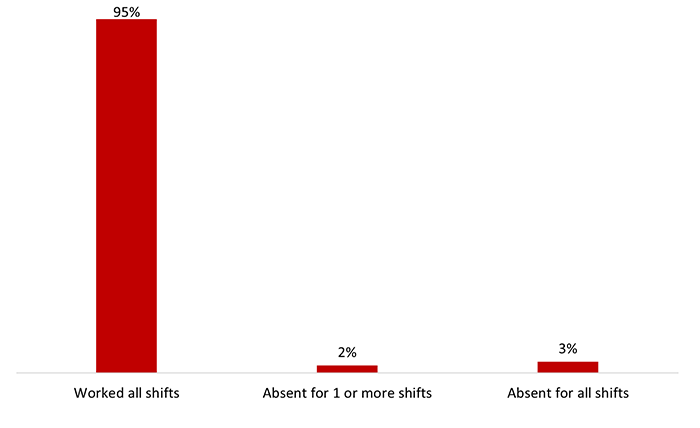
Ninety-five percent (95%) of poll staff reported having worked all their scheduled shifts. Three percent (3%) were absent for all their scheduled shifts, and 2% were absent for at least one of their shifts.
With 91% reporting full attendance, polls workers in Quebec were less likely to have worked all their scheduled shifts. In addition, deputy returning officers (97%) were more likely to have been present for all their scheduled shifts as compared to central poll supervisors (94%), information officers (93%), and poll clerks (93%). Differences based on staff age were not noteworthy.
Notably, 80% of those who worked some of their scheduled shifts and 83% who worked none of their scheduled shift said they felt prepared after training. In contrast, a greater proportion (88%) of those who worked all their scheduled shifts reported feeling prepared to undertake the tasks of their position.
Among poll workers who were absent for a least part of one shift (n=139), 39% attributed their absence to a physical illness or musculoskeletal injury. This is followed by 22% who said their shift presented a conflict with their regular job, school or another responsibility, and 11% who had a family emergency. In addition, 6% said that they were not called or asked to work, 5% that the shifts were too long, and 5% that the job or training was too complicated. One percent of absentee workers attributed this to transportation issues, such as car trouble, an accident, a flat tire, traffic, or lack of public transit.

Text version of graph "Figure 60: Reasons for Absence During Scheduled Shifts"
The sample size is too small to discuss differences by subgroups.
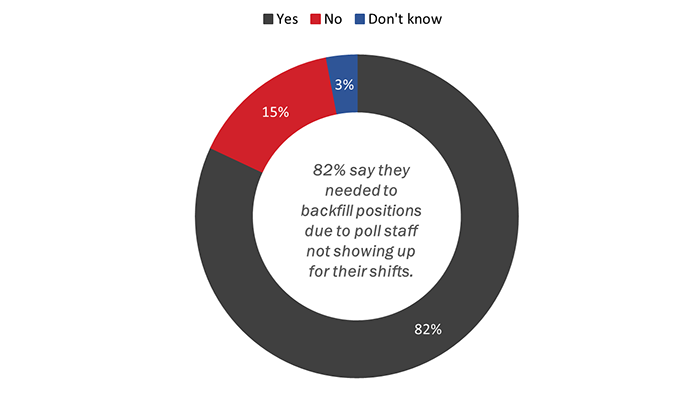
Approximately eight in 10 (82%) recruitment and assistant recruitment officers needed to backfill positions due to poll staff not showing up for their shifts. Fifteen percent (15%) did not need to do so, while 3% did not know or could not recall whether this was an issue.
The sample size is too small to discuss differences by subgroups.
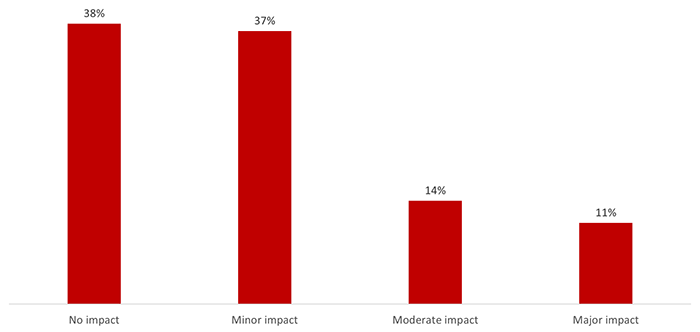
Poll workers who said fellow poll staff were absent for part of, or all, of their shifts (n=600) were asked the level of impact this had on their work. Three in four officers (75%) said this had no impact (38%) or only a minor impact (37%). In contrast, one-quarter (25%) believe this had a moderate or major impact on their work.
Text version of graph "Figure 62: Impact of Absent Poll Staff"
Registration officers (85%) were more likely than deputy returning officers (68%) to say absenteeism had no impact or only a minor impact. Compared to officers working at polls on student campuses (47%), those working at regular stations (75%) were more likely to say absent staff had no impact or only a minor impact. Regional differences were not noteworthy. Staff between the ages of 16 and 24 (86%) were more likely than those 35 to 54 (68%) and 55 to 64 (70%) to say that absenteeism had no impact or only a minor impact.
This section presents findings on poll workers' overall evaluation of working conditions.
More than half (54%) said the working conditions they experienced were very good, while an additional 38% said the conditions were fairly good. In total, 92% of poll workers offered a positive assessment of the working conditions. Satisfaction with working conditions is virtually unchanged since 2015 (94% in 2015 versus 92% in 2019). What has changed is the proportion of poll workers describing the working conditions as very good. This has declined since 2015: 63% in 2015 compared to 54% in 2019.
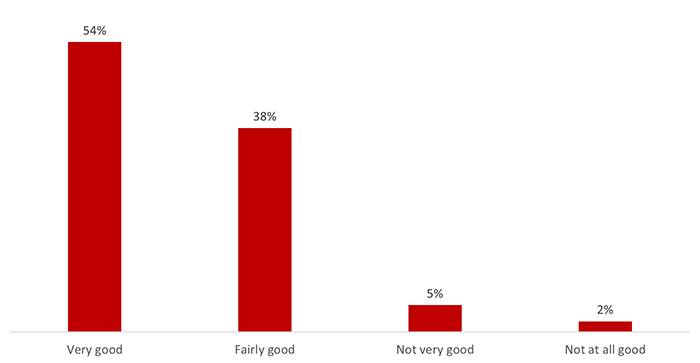
Text version of graph "Figure 63: Experience with Working Conditions"
Poll workers in British Columbia (88%) were less likely to assess their working conditions as fairly or very good compared to officers in Manitoba (96%), Quebec (95%), Atlantic Canada (94%), Alberta (93%) and Ontario (92%). Differences based on position and type of poll are not noteworthy.
Staff between the ages of 16 and 24 years were more likely than older staff to view the working conditions as fairly or very good (98% compared to 92% of 25 to 34 year olds, 93% of 35 to 54 year olds, 91% of 55 to 64 year olds, and 93% of 65 to 74 year olds).
Among poll workers who said the working conditions were poor (n=298), more than half (60%; up from 29% in 2015) pointed to a lack of breaks to explain why. Following this, 41% (up from 22% in 2015) said the number of hours of work required were too long. The full range of responses is depicted in Figure 64.
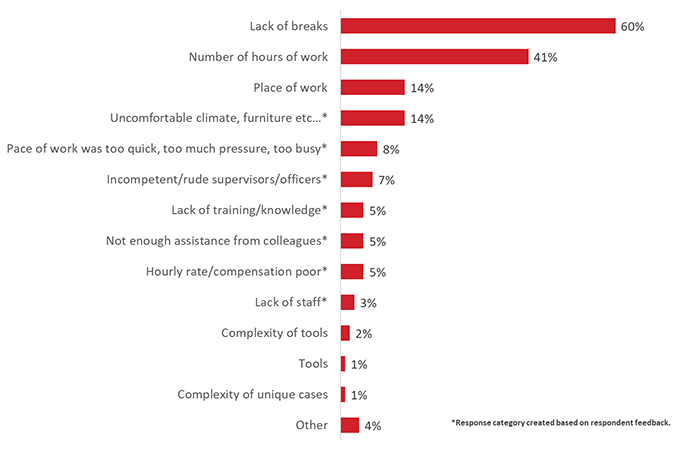
Text version of graph "Figure 64: Reasons Working Conditions Were Viewed as Poor"
With the exception of age, there are no noteworthy subgroup differences to report. In terms of age-related differences, 35 to 54 year olds were more likely to mention lack of breaks (88% compared to 60% of 55 to 64 year olds and 47% of 65 to 74 year olds).
When asked what they would change to make it easier for them to do their work, approximately one in three (29%) poll workers mentioned better training. As in 2015, better training is the top suggestion among poll workers; however, the proportion mentioning this in 2019 has increased significantly, from 17% in 2015 to 29% in 2019. The full range of responses is depicted in Figure 65.
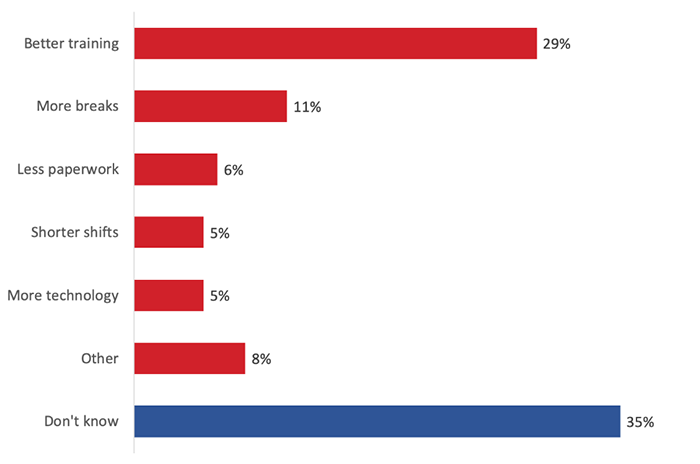
Text version of graph "Figure 65: Potential Changes to Make It Easier for Staff to Do Their Work"
The single largest proportion (35%) did not know what they would change to make it easier for them to do their work.
Poll workers in all regions outside of Quebec and central poll supervisors (47%) were more likely to suggest better training. Those 35 to 54 (33%) and 55 to 64 (33%) were also more likely than 16 to 24 year olds (21%) and those aged 75 and older (23%) to mention better training as the first thing they would change to make it easier to do their job.
The vast majority of poll workers (94%) said they did not experience harassment while working in the election. Five percent (5%) did experience harassment in the workplace during the last federal election.
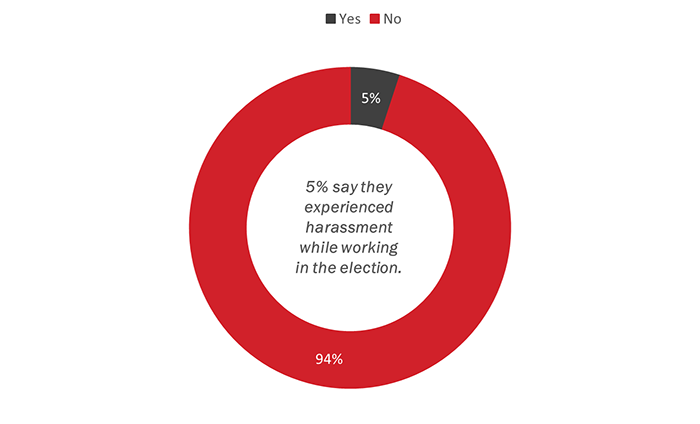
Text version of graph "Figure 66: Harassment in the workplace"
Regionally, poll workers in British Columbia (7%), Alberta (7%) and Ontario (6%) were more likely to have experienced harassment. The likelihood of experiencing harassment was higher among central poll supervisors (10%) and information officers (9%) than among deputy returning officers (5%) and poll clerks (4%). Differences by type of polling station and age were not noteworthy.
Among those who experienced harassment while working in the federal election (n=220), more than half (53%) said that they experienced harassment from electors. Following this, nearly one-quarter (24%) experienced harassment from a superior, and 23% said they were harassed by a co-worker while working during the election.
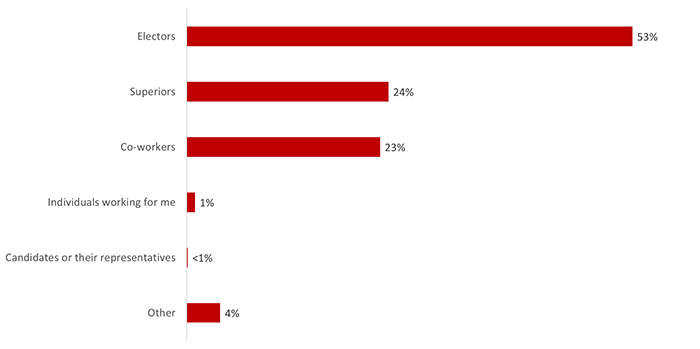
Text version of graph "Figure 67: Harassment in the Workplace (from Whom)"
Poll workers from Quebec (50%) were more likely than their counterparts in other regions to report having been harassed by a co-worker. Differences by type of polling station, position, and age were not noteworthy.
Approximately one-third (36%) of poll workers were very satisfied with the hourly rate of pay, while 44% were somewhat satisfied with their pay. In total, therefore, 80% expressed modest or strong satisfaction with the hourly rate of pay. This is virtually unchanged since 2015, when 81% were somewhat or very satisfied with their pay.
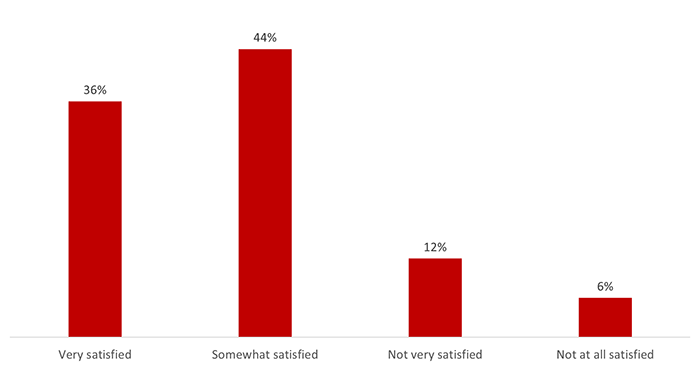
Text version of graph "Figure 68: Satisfaction with Hourly Rate of Pay"
Respondents in Atlantic Canada (43%), Manitoba (40%), Quebec (38%), and Ontario (36%) were among those most likely to say they were very satisfied with their hourly rate of pay. Poll clerks (22%) are more likely to express dissatisfaction with their hourly rate of pays than central poll supervisors (14%), deputy returning officers (17%) and registration officers (14%). Differences based on type of polling station were not noteworthy. Those between the ages of 16 and 24 (52%) were most likely to be very satisfied with their hourly pay.
At the time of the survey, 95% of poll workers had received their paycheque for the time they worked during the election.
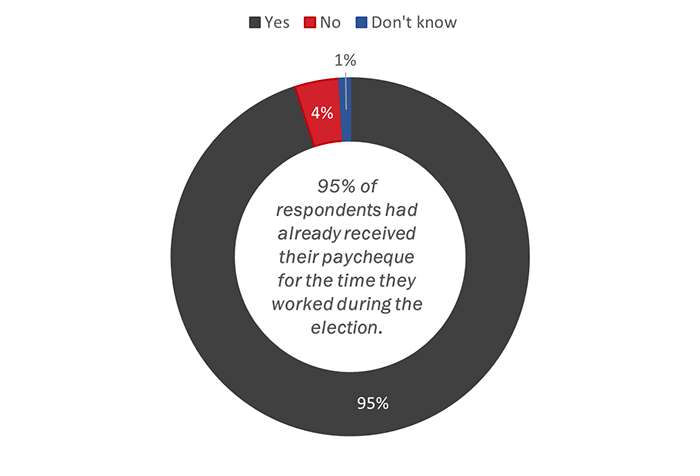
There were no noteworthy differences based on the position held at the polls. Those who worked at a polling station in a First Nations community (98%) were more likely than those who worked at a station in a seniors' residence/long-term care facility (92%) to have received their paycheque. Differences based on region and age were not noteworthy.
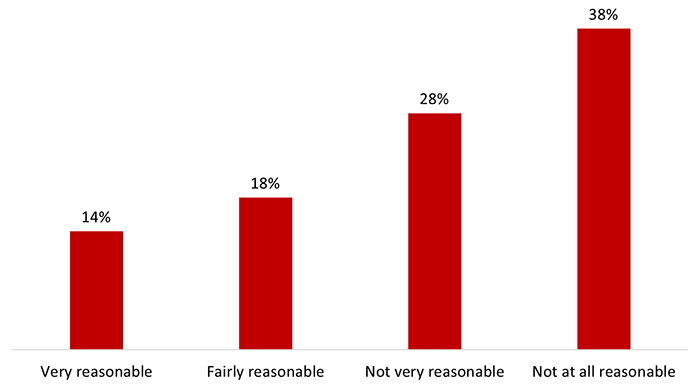
Poll workers who said they received their paycheque (n=3,948) felt that the time it took to receive their pay was very (44%) or fairly (41%) reasonable. Views on timeliness are identical to 2015 when 86% felt the time it took to receive their cheque was reasonable.
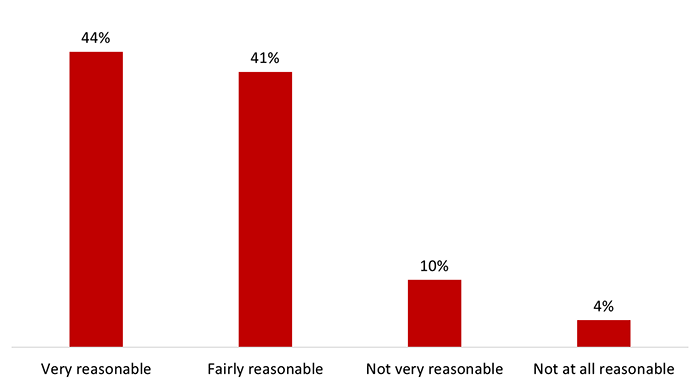
Text version of graph "Figure 70: Satisfaction with Time It Took to Receive Paycheque"
Poll workers in British Columbia (20%), Manitoba (20%) and Alberta (17%) were among the most likely to say the time it took to receive their pay was not reasonable. Conversely, those in Quebec (90%), Atlantic Canada (89%), Saskatchewan (87%), and Ontario (86%) were among those most likely to say the time it took to receive their pay for their work during the federal election was reasonable.
Information officers (20%), followed by registration officers (18%), were most likely to say the length of time was unreasonable.
Poll workers who worked at polling stations in First Nations communities (26%) were most likely to say the amount of time it took to receive their pay was unreasonable.
Younger staff were generally less likely to say the time it took to receive their pay was reasonable; specifically, 73% of 25 to 34 year olds followed by 80% of 16 to 24 year olds said the wait time was reasonable compared to 84% of 35 to 54 year olds, 87% of 55 to 64 year olds, 90% of 65 to 74 year olds and 85% of staff aged 75 and older.
Two-thirds (67%) of poll workers who had not yet received their paycheque (n=141) said the time it was taking was not very (28%) or not at all (38%) reasonable.
Text version of graph "Figure 71: Satisfaction with Time It Is Taking to Receive Paycheque"
There are no noteworthy subgroup differences to report.
This section presents election officers' use of technology and views on introducing electronic methods for vote counting. The questions in this section were asked of all election officers (n=4,251).
Approximately three-quarters (74%) of election officers said they use a computer, tablet or smartphone for personal purposes multiple times a day, with an additional 16% doing so once or twice a day. Few use these technologies for personal purposes less frequently.
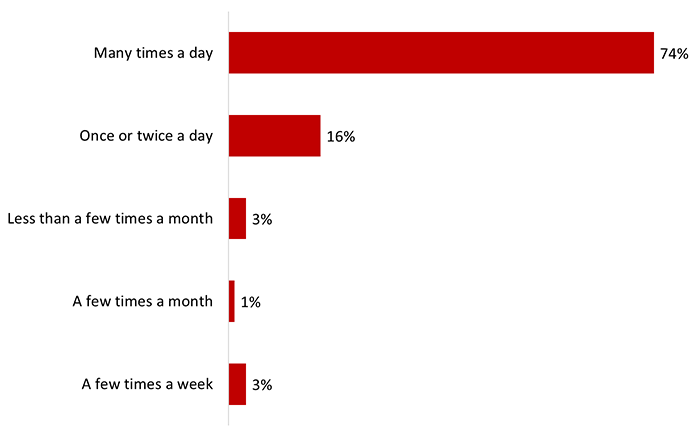
Text version of graph "Figure 72: Use of Technology for Personal Purposes"
Use of a computer, tablet or smartphone for personal purposes many times a day or once or twice a day was lowest among those aged 75 and older (78%) and highest among 16 to 34 year olds (99%).
A majority of election officers (85%) said that they learn new technology quickly, including 40% who claim to learn very quickly. In contrast, 14% said they learn new technology somewhat or very slowly.
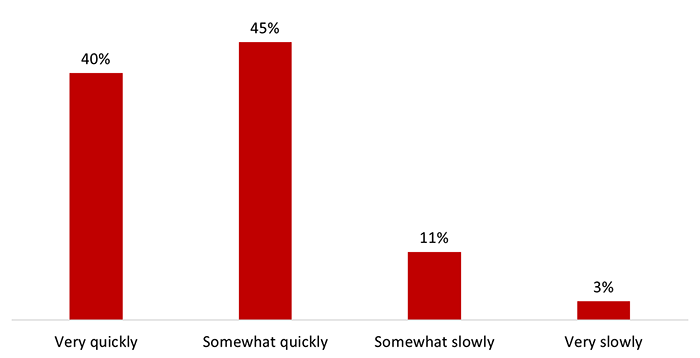
Text version of graph "Figure 73: Ability to Learn New Technology"
Election officers are split on their preferred method of counting votes. Forty-four percent (44%) believe counting votes by hand is more accurate, while 42% believe doing so electronically is more accurate.
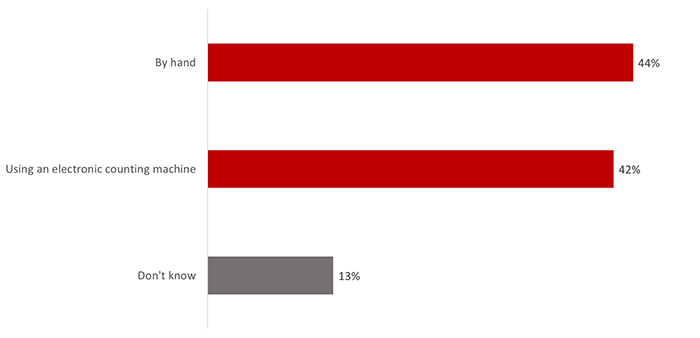
Text version of graph "Figure 74: Preferred Method of Counting Votes"
The following subgroup differences are noteworthy:
Nearly nine in 10 (86%)12 election officers said they would be comfortable working with electronic lists of electors rather than paper lists; specifically, more than half (59%) would be very comfortable doing so and 28% would be fairly comfortable working with electronic lists. Few (12%) would be somewhat or very uncomfortable.
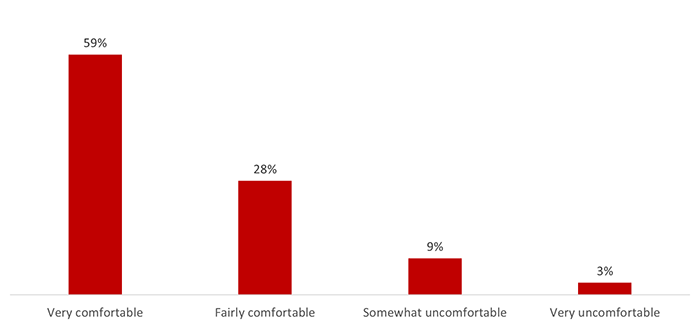
Text version of graph "Figure 75: Level of Comfortability with Electronic Lists of Electors"
The following subgroups were more likely to have said they would be comfortable (fairly or very) working with electronic lists of electors:
In addition, respondents aged 75 and older (69%) were least likely to say they would be comfortable working with electronic lists of electors, while 25 to 34 year olds (83%) were most likely to be very comfortable using such lists.
Return to source of Footnote 2 In total, 101 recruitment and assistant recruitment officers responded to the survey. Subgroup differences are not discussed for questions asked only of this sub-population due to small sample sizes.
Return to source of Footnote 3 Q23. What type of difficulties did you have? Base: n=15; recruitment officers and assistant recruitment officers who needed to hire bilingual poll staff or staff who spoke the minority official language in their electoral district.
Return to source of Footnote 4 Q25. What type of special accommodations did you provide? Base: n=37; recruitment officers and assistant recruitment officers who provided special accommodations for applicants.
Return to source of Footnote 5 Q18. How satisfied were you with the services obtained from the regional media advisors/community relations officers? Were you….? Recruitment officers and assistant recruitment officers who used the regional media advisors (n=14) or community relations officers (n=36).
Return to source of Footnote 6 Q20. How satisfied were you with the Field Support Network (FSN)? Were you…? Base: n=27; recruitment officers and assistant recruitment officers who used the Field Support Network.
Return to source of Footnote 7 The overall level of preparedness of poll workers is 88% due to rounding.
Return to source of Footnote 8 The percentage of poll staff who said the flow of electors at the polls went smoothly differs from Figure 34 due to rounding.
Return to source of Footnote 9 The question was worded differently in 2015: “In terms of providing services to electors with disabilities, would you say that you were...?” Caution should be exercised in comparing results over time.
Return to source of Footnote 10 The percentage of poll staff who reported being satisfied with the election materials is 92% due to rounding.
Return to source of Footnote 11 Please note that question wording and response categories were changed in 2019.
Return to source of Footnote 12 The percentage of election officers who said they would be comfortable working with electronic lists of electors differs from Figure 75 due to rounding.