Contract # 82082-160235/001/CY
Produced by TNS Canada
Contract Award Date: January 25, 2016
Report Date: March 29, 2016
Ce rapport est aussi disponible en français.
The CRTC has committed to evaluating the effectiveness of the Wireless Code and to use the results in the formal review process. The review of the Wireless Code over time assesses whether it meets and continues to meet its objectives, which includes ensuring that consumers are empowered to make informed decisions about wireless services.
The overall objective of the research is to determine how consumers understand their wireless service contracts and their related rights and how that has changed over time. More specifically:
The CRTC developed the Wireless Code to make it easier for Canadians to understand their wireless contracts and to allow consumers to more easily take advantage of competitive offers. Over the past two years, consumers have reported that they are taking advantage of competitive offers more often, are showing a better understanding of their contracts, and have lodged fewer complaints. Furthermore, consumers have indicated that data is becoming increasingly important to Canadians’ wireless contracts.
Taking Advantage of Competitive Offers
Canadians are increasingly taking advantage of a variety of competitive wireless offers.
In particular, Canadians are taking advantage of family plans and employer/association plans more frequently in 2016 than in 2015. Canadians are also increasingly signing contracts for wireless services (instead of pay-as-you-go).
In 2016, Canadians are showing a stronger preference and usage for monthly/post-paid plans over pay-as-you go than in the past. The preference for monthly/post-paid plans suggests Canadians have become more accustomed to signing contracts with wireless providers, which may be due to a better understanding of what the contract entails as well as the promotion of monthly/post-paid plans by wireless providers.
While the number of Canadians who have changed providers in the past two years has remained the same, the reasons for changing providers have changed. The primary reason for changing providers continues to be to get a better deal and has increased quite substantially in 2016. Fewer Canadians are switching due to low satisfaction with the service provider, phone upgrades, expense, network coverage or personal situation.
Among those who have switched providers, the perceived ease of switching continues to be high and has remained the same over the past two years as have the reasons for considering switching difficult.
Understanding of Contracts
While overall perceptions of the clarity of contract language have changed very little, there are many indications that Canadians’ understanding of contracts has improved over the past two years. More specifically, improvements to the understanding of cancellation fees, declines in complaints and declines in bill shock all provide indications that Canadians’ understanding of wireless contracts have improved. It is important to note however, that declines in bill shock and complaints will also occur due to a variety of reasons including the safeguards against overages in the Wireless Code.
Canadians’ perceptions of the clarity of the contract language have remained the same over the past two years. Nearly two-thirds of Canadians find the contracts clear and easy to understand. Canadians’ understanding of early cancellations fees in particular have shown improvement, with Canadians citing better clarity and understanding of cancellation fees over the past two years.
While ratings on clarity of the contract have remained the same, complaints and bill shock have declined. These findings suggest Canadians are more aware of their contractual obligations or the terms and conditions to which they have agreed than they have in the past.
This is further supported by the finding that those who made a complaint were nearly three times more likely to consider their contract unclear or difficult to understand.
Lastly, over the past two years, slightly fewer Canadians have experienced service provider changes to their plans without being made expressly aware. This suggests that wireless providers are complying with the Wireless Code requirement to notify Canadians of changes to their contracts and related documents and that Canadians have become more aware of their contracts which in turn gives them improved understanding.
Complaints
Over the last two years, wireless complaints have fallen. For the second year in a row, Canadians are making fewer complaints suggesting Canadians better understand the wireless contracts and services that they signed up for. The decline in complaints in 2016 is largely driven by reduced complaints by those with a family and/or monthly/post-paid plan. Interestingly, there has been a surge in complaints by those who have pay-as-you-go plans with complaints nearly doubling over 2015.
While Canadians are making fewer complaints, they continue to primarily complain to their wireless service provider and continue to be to be dissatisfied with the resolution of their complaint.
Surprisingly few Canadians (less than one-in-five) are aware of their right to complain to the Commission for Complaints for Telecommunications Services (CCTS). Canadians’ who were aware of their right to complain to the CCTS were more likely to be satisfied with the resolution of their complaint compared to those who were not aware.
Overall, wireless complaints reported by Canadians are down. While Canadians with family/shared plans are making fewer complaints than they did last year, they are still making more complaints than Canadians with individual plans, suggesting that those who signed up for a family/shared plan are not fully satisfied with the plan. It also suggests that they did not fully understand the details of the contract or plan that was presented to them.
Data is Becoming More Important to Canadians
Data is becoming increasingly important to Canadians subscribing to wireless services. Indeed, Canadians are increasingly considering data “essential” to their wireless plans while the importance of calling minutes and text messaging has remained the same in 2016. The importance of data is largely being driven by younger Canadians (<55).
Furthermore, Canadians would be most upset by changes to their data plan without notification or consent - including the pricing of their data plan. In 2015, the extent to which Canadians would be upset by changes to their plan without notification was relatively similar regardless of the type of change. However in 2016, data changes without notification are significantly more upsetting than other changes (roaming, contract length, texting, etc.) again, showcasing the increasing importance of data to Canadians.
Strategic Implications
The results of the research provide evidence that over the past two years Canadians’ understanding of their wireless services have improved and Canadians are taking advantage of competitive offers. It also provides information that may inform future processes at the CRTC. More specifically,
A telephone survey was conducted among Canadians age 18 years and older who owned their own cell phone. Random telephone sample was used, of which, 20 per cent was cell phone while the remaining was landline sample. The rationale for including a cell phone only requirement is that approximately one fifth, or 20 per cent, of all Canadian households do not have a landline. This requirement ensures that we captured households with only cell phones. Targeting only landlines would likely have captured a mix of landline only households and households with both cell phones and landlines. The survey was in field from February 3rd to February 18th, 2016. A total of 925 surveys were completed. The sample for this study was a probability sample and as such the findings can be extrapolated to the Canadian population with a margin of error of +/-3.2 per cent, 19 times out of 20.
The total contract value for this project was $48,523.33 including HST.
I hereby certify as Vice President, Ottawa Regional Office & Public Sector Practice Lead of TNS Canada Ltd. that the deliverables fully comply with the Government of Canada political neutrality requirements outlined in the Communications Policy of the Government of Canada and Procedures for Planning and Contracting Public Opinion Research. Specifically, the deliverables do not include information on electoral voting intentions, political party preferences, and standings with the electorate or ratings of the performance of apolitical party or its leaders.
David Ang, Vice President, Ottawa Regional Office & Public Sector Practice Lead
TNS Canada Ltd.
The Wireless Code is a mandatory code of conduct for wireless service providers that serves two primary goals: to ensure consumers are empowered to make informed decisions about wireless services; to establish consumer-friendly business practices for the wireless service industry where necessary; and to make it easier for consumers to take advantage of competitive offers. The Code includes 61 provisions that address, among others: clarity; contracts and related documents; changes to contracts; bill management; mobile device issues; and cancellation. The Code applies to all retail mobile wireless voice and data services (wireless services) provided to individual and small business consumers in Canada as of June 3, 2015.
The CRTC has committed to evaluating the effectiveness of the Code and to use the results as part of the formal review process.
The review of the Wireless Code is intended to assess whether it meets and will continue to meet its objectives. Benchmarks were collected in the winter of 2014 and 2015. As such, the CRTC seeks to understand the impact over time of the Wireless Code on consumers’ understanding of their wireless service contracts and their related rights.
The overall objective of the research is to determine how consumers understand their wireless service contracts and their related rights and how that has changed over time. More specifically:
A telephone survey was conducted among Canadians age 18 years and older who owned their own cell phone. Random telephone sample was used, of which, 20 per cent was cell phone while the remaining was landline sample. The survey was in field from February 3rd to February 18th, 2016. A total of 925 surveys were completed, yielding a margin of error of +/-3.2 per cent, 19 times out of 20. Surveying was conducted in the respondent’s official language of choice and took an average of 9 minutes to complete. A detailed methodology can be found in Chapter 5.
Please note: Analysis was undertaken to look at differences between demographics such as gender, age, region, level of education attained, language spoken, as well as incidence of making a complaint about wireless services. Only differences significant at the 95% confidence level are presented in this report. Any differences that are statistically significant between subgroups are in bold and highlighted in green throughout the report.
The numbers presented throughout this report are rounded to the closest full number. Due to this rounding, in some cases it may appear that ratings collapsed together are different by a percentage point from when they are presented individually and totals may not add up to 100%. Also the data for 2015 and 2014 was taken directly from the 2014 and 2015 Wireless Code Public Opinion Research reports. TNS has incorporated these results into the 2016 report for the purpose of year-over-year comparison.
The CRTC developed the Wireless Code to make it easier for Canadians to understand their wireless contracts and to allow consumers to more easily take advantage of competitive offers. Over the past two years, consumers have been taking advantage of competitive offers more often, are showing a better understanding of their contracts and have lodged fewer complaints. Furthermore, consumers have indicated that data is becoming increasingly important to Canadians’ wireless contracts.
Taking Advantage of Competitive Offers
Canadians are increasingly taking advantage of a variety of competitive wireless offers.
In particular, Canadians are taking advantage of family plans and employer/association plans more frequently in 2016 than in 2015. Canadians are also increasingly signing contracts for wireless services (instead of pay-as-you-go).
In 2016, Canadians are showing a stronger preference and usage for monthly/post-paid plans over pay-as-you go than in the past. The preference for monthly/post-paid plans suggests Canadians have become more accustomed to signing contracts with wireless providers, which may be due to a better understanding of what the contract entails as well as the promotion of monthly/post-paid plans by wireless providers.
While the number of Canadians who have changed providers in the past two years has remained the same, the reasons for changing providers have changed. The primary reason for changing providers continues to be to get a better deal and has increased quite substantially in 2016. Fewer Canadians are switching due to low satisfaction with the service provider, phone upgrades, expense, network coverage or personal situation.
Among those who have switched providers, the perceived ease of switching continues to be high and has remained the same over the past two years as have the reasons for considering switching difficult.
Understanding of Contracts
While overall perceptions of the clarity of contract language have changed very little, there are many indications that Canadians’ understanding of contracts has improved over the past two years. More specifically, improvements to the understanding of cancellation fees, declines in complaints and declines in bill shock all provide indications that Canadians’ understanding of wireless contracts have improved. It is important to note however, that declines in bill shock and complaints will also occur due to a variety of reasons including the safeguards against overages in the Wireless Code.
Canadians’ perceptions of the clarity of the contract language have remained the same over the past two years. Nearly two-thirds of Canadians find the contracts clear and easy to understand. Canadians’ understanding of early cancellations fees in particular have shown improvement, with Canadians citing better clarity and understanding of cancellation fees over the past two years.
While ratings on clarity of the contract have remained the same, complaints and bill shock have declined. These findings suggest Canadians are more aware of their contractual obligations or the terms and conditions to which they have agreed than they have in the past.
This is further supported by the finding that those who made a complaint were nearly three times more likely to consider their contract unclear or difficult to understand.
Lastly, over the past two years, slightly fewer Canadians have experienced service provider changes to their plans without being made expressly aware. This suggests that wireless providers are complying with the Wireless Code requirement to notify Canadians of changes to their contracts and related documents and that Canadians have become more aware of their contracts which in turn gives them improved understanding.
Complaints
Over the last two years, wireless complaints have fallen. For the second year in a row, Canadians are making fewer complaints suggesting Canadians better understand the wireless contracts and services that they signed up for. The decline in complaints in 2016 is largely driven by reduced complaints by those with a family and/or monthly/post-paid plan. Interestingly, there has been a surge in complaints by those who have pay-as-you-go plans with complaints nearly doubling over 2015.
While Canadians are making fewer complaints, they continue to primarily complain to their wireless service provider and continue to be to be dissatisfied with the resolution of their complaint.
Surprisingly few Canadians (less than one-in-five) are aware of their right to complain to the Commission for Complaints for Telecommunications Services (CCTS). Canadians’ who were aware of their right to complain to the CCTS were more likely to be satisfied with the resolution of their complaint compared to those who were not aware.
Overall, wireless complaints reported by Canadians are down. While Canadians with family/shared plans are making fewer complaints than they did last year, they are still making more complaints than Canadians with individual plans, suggesting that those who signed up for a family/shared plan are not fully satisfied with the plan. It also suggests that they did not fully understand the details of the contract or plan that was presented to them.
Data is Becoming More Important to Canadians
Data is becoming increasingly important to Canadians subscribing to wireless services. Indeed, Canadians are increasingly considering data “essential” to their wireless plans while the importance of calling minutes and text messaging has remained the same in 2016. The importance of data is largely being driven by younger Canadians (<55).
Furthermore, Canadians would be most upset by changes to their data plan without notification or consent - including the pricing of their data plan. In 2015, the extent to which Canadians would be upset by changes to their plan without notification was relatively similar regardless of the type of change. However in 2016, data changes without notification are significantly more upsetting than other changes (roaming, contract length, texting, etc.) again, showcasing the increasing importance of data to Canadians.
Strategic Implications
The results of the research provide evidence that over the past two years Canadians’ understanding of their wireless services have improved and Canadians are taking advantage of competitive offers. It also provides information that may inform future processes at the CRTC. More specifically,
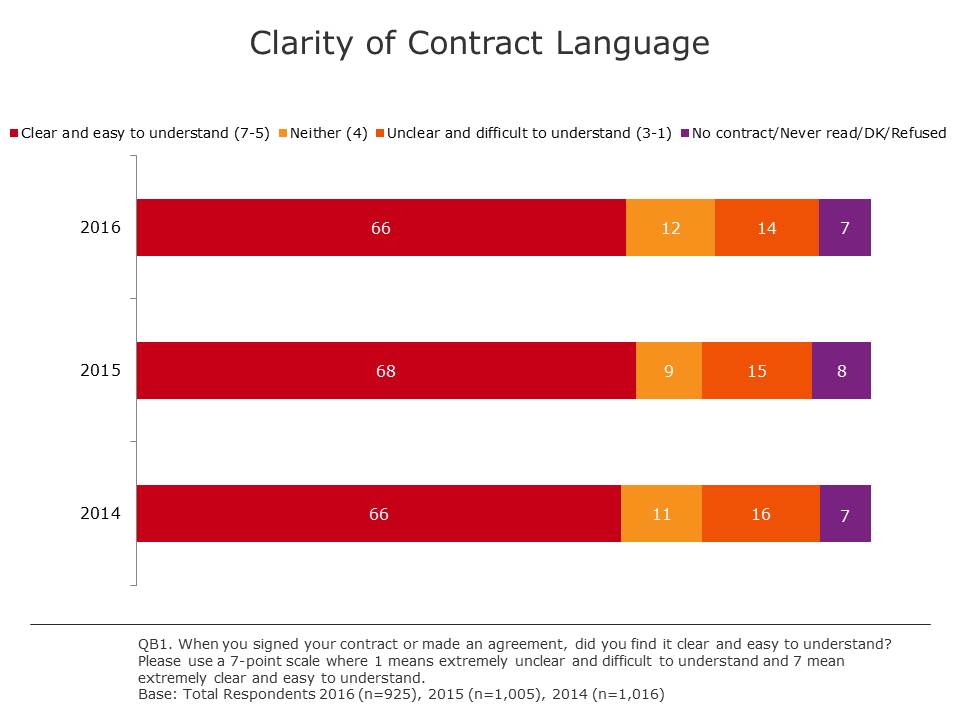
Clarity of contract language has remained unchanged since 2014. Generally speaking, wireless contracts are considered clear and easy to understand by many Canadians. However, a sizeable portion of the Canadian population continues to find wireless contracts unclear and difficult to understand.
Consistent with results from 2014 and 2015, two thirds of Canadians (66%) find the contract they signed to be clear and easy to understand. One-in-seven (14%) however, find their contract to be unclear and difficult to understand.
As seen in last year’s results, younger Canadians (18-34) are more likely to consider their contract clear and easy to understand (72% vs 61%-64%) as are Quebecers (77% vs. 60%-71%). Since the majority of Francophone Canadians reside in Quebec, it is not surprising that Francophones are significantly more likely to consider their contract clear and easy to understand (77% vs. 62% of Anglophones).
Those who have not made a complaint about their wireless services are also significantly more likely to consider their contract clear and easy to understand (69% vs 54%).
| Clarity of Contract Language | Total | Gender | Age | Region | |||||||
|---|---|---|---|---|---|---|---|---|---|---|---|
| Male | Female | 18-34 | 35-54 | 55+ | Atl | Que | Ont | Pra | BC | ||
| Base=actual | (925) % |
(441) % |
(484) % |
(157) % |
(288) % |
(480) % |
(87) % |
(202) % |
(321) % |
(201) % |
(114) % |
| Extremely clear and easy to understand (7) | 24 | 23 | 25 | 27 | 22 | 23 | 10 | 33 | 18 | 30 | 25 |
| Top 3 Box (5-7) | 66 | 63 | 68 | 72 | 64 | 61 | 60 | 77 | 61 | 71 | 58 |
| Bottom 3 Box (1-3) | 14 | 17 | 12 | 13 | 14 | 16 | 20 | 11 | 12 | 18 | 16 |
| Clarity of Contract Language | Total | Education | Language | Made a Complaint | |||||
|---|---|---|---|---|---|---|---|---|---|
| HS or less | College | Uni | English | French | Other | Yes | No | ||
| Base=actual | (925) % |
(223) % |
(281) % |
(407) % |
(599) % |
(205) % |
(54) % |
(179) % |
(741) % |
| Extremely clear and easy to understand (7) | 24 | 31 | 31 | 16 | 23 | 34 | 14 | 14 | 27 |
| Top 3 Box (5-7) | 66 | 69 | 68 | 64 | 62 | 77 | 64 | 54 | 69 |
| Bottom 3 Box (1-3) | 14 | 12 | 14 | 15 | 15 | 12 | 20 | 28 | 10 |
Canadians’ understanding of cancellation fees has improved since 2014.
More than half of Canadians think their service provider clearly explained any fees that would be applied to cancel their contract agreement early. While this remained stable from 2015 it is up five per cent from 2014 showing improvement over time.
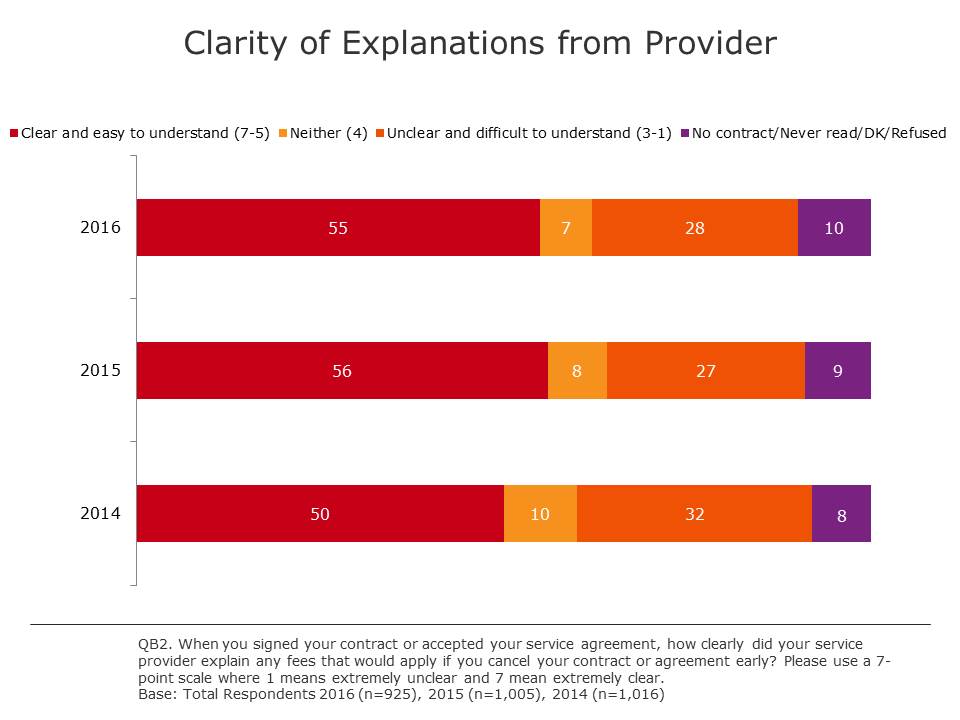
Quebec residents (65%) are also more likely to find the explanation of early cancellation fees to be clear and easy to understand compared to other regions. Not unexpectedly, due to the overlap of French speaking Canadians living in Quebec, Francophones are also more likely than Anglophones to consider the explanation clear and easy to understand (62% vs. 53%).
Additionally, Canadians who have made a complaint about their wireless provider are significantly more likely to find the explanation unclear and difficult to understand (41% vs. 28%).
| Clarity Of Explanation from Provider | Total | Gender | Age | Region | |||||||
|---|---|---|---|---|---|---|---|---|---|---|---|
| Male | Female | 18-34 | 35-54 | 55+ | Atl | Que | Ont | Pra | BC | ||
| Base=actual | (925) % |
(441) % |
(484) % |
(157) % |
(288) % |
(480) % |
(87) % |
(202) % |
(321) % |
(201) % |
(114) % |
| Extremely clear (7) | 26 | 24 | 28 | 32 | 21 | 27 | 22 | 39 | 20 | 28 | 22 |
| Top 3 Box (5-7) | 55 | 55 | 56 | 58 | 54 | 53 | 52 | 65 | 53 | 48 | 57 |
| Bottom 3 Box (1-3) | 28 | 31 | 26 | 33 | 29 | 22 | 28 | 22 | 29 | 36 | 27 |
| Clarity Of Explanation from Provider | Total | Education | Language | Made a Complaint | |||||
|---|---|---|---|---|---|---|---|---|---|
| HS or less | College | Uni | English | French | Other | Yes | No | ||
| Base=actual | (925) % |
(223) % |
(281) % |
(407) % |
(599) % |
(205) % |
(54) % |
(179) % |
(741) % |
| Extremely clear (7) | 26 | 37 | 29 | 20 | 24 | 39 | 17 | 18 | 29 |
| Top 3 Box (5-7) | 55 | 58 | 60 | 51 | 53 | 62 | 58 | 47 | 57 |
| Bottom 3 Box (1-3) | 28 | 20 | 23 | 35 | 31 | 21 | 28 | 41 | 25 |
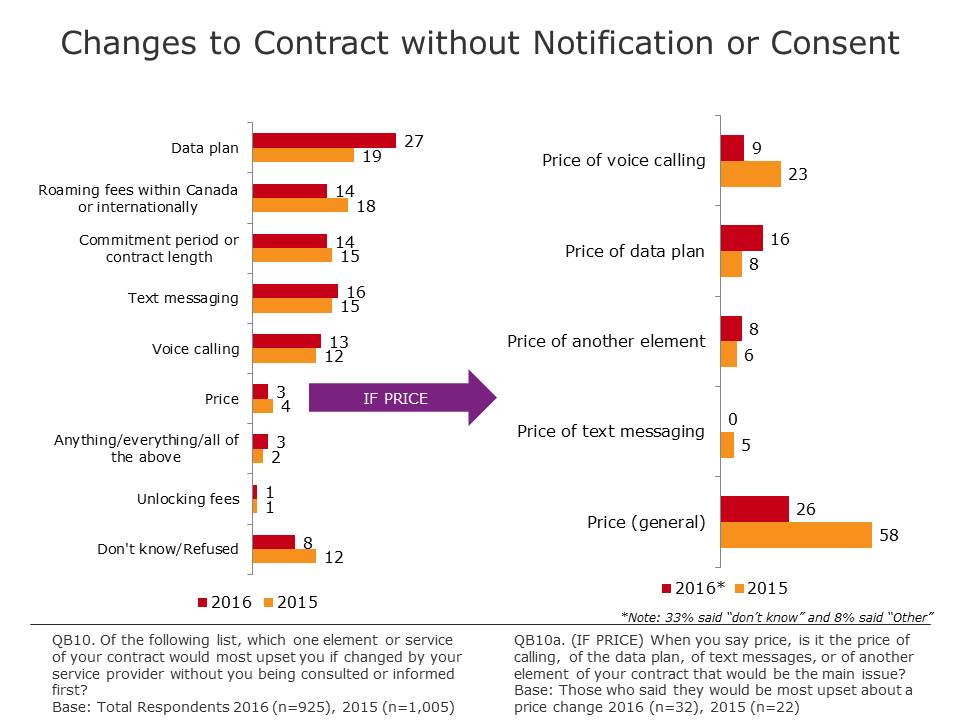
Canadians would be most upset with changes to their data plan without notification or consent including changes to the pricing of data.
Canadians would be most upset by changes to their data plan without notification or consent. Being upset by changes to a data plan have increased substantially over 2015 (27% vs 19%) as have concerns about increases to the price of the data plan (16% vs 8%) suggesting data is becoming increasingly important to Canadians.
Roaming fees (14%), commitment period (14%), text messaging (16%), and voice calling (13%) are all similarly rated, and consistent with 2015 results. A very small proportion (3%) would be upset with a change without notification to the price of their contract. Among those who would be upset about a change without notification to price1, the main issue continues to be centred on the general price of their service (26%) and increasingly the price of data (+8%).
Changes to Contract without Notification or Consent - text version
Since 2014, fewer Canadians have become aware that their service provider changed their plan without expressly making them aware of how the terms and conditions had changed.
Less than one-in-five (17%) Canadians reported that they were aware of their service provider changing their plan without making them aware of the terms and conditions. While this represents a small decline (-2%2) since 2014, it indicates progress in the right direction.
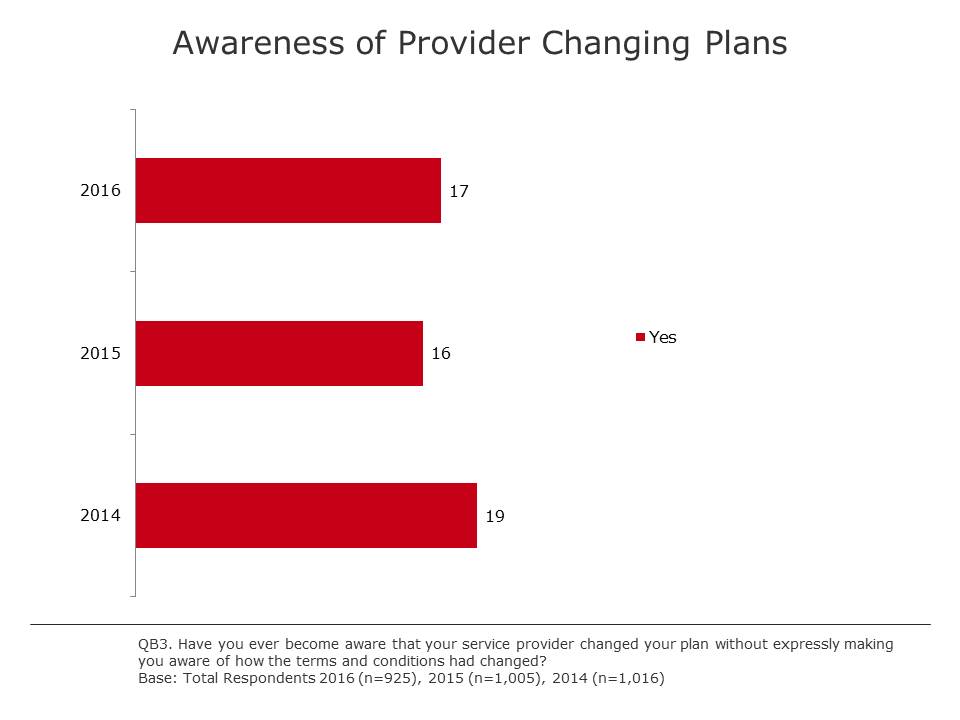
Canadians who speak a language other than English or French are significantly more likely to have become aware of their service provider changing their plan without expressly making them aware of how the terms and conditions had changed (24% vs. 13% for French and 17% for English).
Furthermore, Canadians who have made a complaint about their wireless services are far more likely to have become aware of changes (33% vs. 12%).
| Awareness of Provider Changing Plans | Total | Language | Made a Complaint | |||
|---|---|---|---|---|---|---|
| English | French | Other | Yes | No | ||
| Base=actual | (925) % |
(599) % |
(205) % |
(54) % |
(179) % |
(741) % |
| Yes | 17 | 17 | 13 | 24 | 33 | 12 |
| No | 80 | 80 | 86 | 66 | 60 | 86 |
Fewer Canadians are experiencing bill shock in 2016. Greater than expected data usage is the leading cause of bill shock.
One quarter (24%) of Canadians experienced “bill shock” from a surprisingly high bill in the past year, down significantly from 2015 and 2014. This downward trend in bill shock suggests Canadians understand more fully, the terms and costs associated with their contract. This also suggests that the protections built into the Code are having an impact.
The primary reason for experiencing bill shock is having greater than expected data usage, with four-in-ten Canadians citing this as the reason for the bill shock. The prevalence of this problem has increased each year from 2014 and may be a function of increased use of smartphones by the Canadian public as well as improvements and changes to mobile apps and the extent to which such apps use data. In other words, greater than expected data usage may be a function of Canadians not fully understanding how their mobile device uses data rather than a problem understanding the terms of data usage with the service provider.
Other causes for bill shock include roaming charges (16%), billing issues (12%), unexplained airtime / data usage (10%), long distance charges (8%), and not being given the plan they were promised (8%); most of which have remained stable or decreased since 2014 and 2015.
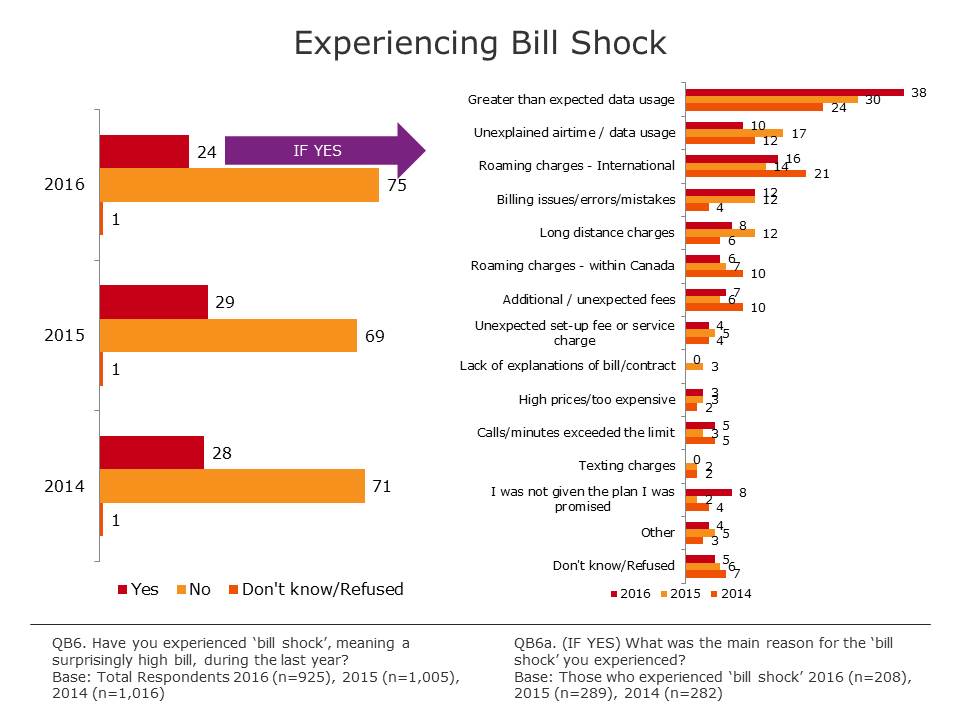
Canadians who are younger (18 to 34) (29%), with a university education (29%) and primarily speak English (28%) are more likely to have experienced bill shock.
Not unexpectedly, Canadians who made a complaint about their wireless services are far more likely to have experienced bill shock than those who did not make a complaint (56% vs. 15%). One could surmise their complaint was likely directly related to the bill shock they experienced.
| Experienced Bill Shock | Total | Gender | Age | Region | |||||||
|---|---|---|---|---|---|---|---|---|---|---|---|
| Male | Female | 18-34 | 35-54 | 55+ | Atl | Que | Ont | Pra | BC | ||
| Base=actual | (925) % |
(441) % |
(484) % |
(157) % |
(288) % |
(480) % |
(87) % |
(202) % |
(321) % |
(201) % |
(114) % |
| Yes | 24 | 23 | 25 | 29 | 23 | 20 | 28 | 16 | 27 | 23 | 28 |
| No | 75 | 76 | 74 | 70 | 76 | 79 | 72 | 83 | 73 | 73 | 72 |
| Don’t know | 1 | 1 | 1 | 1 | 1 | 1 | - | 1 | 1 | 4 | - |
| Experiencing Bill Shock | Total | Education | Language | Made a Complaint | |||||
|---|---|---|---|---|---|---|---|---|---|
| HS or less | College | Uni | English | French | Other | Yes | No | ||
| Base=actual | (925) % |
(223) % |
(281) % |
(407) % |
(599) % |
(205) % |
(54) % |
(179) % |
(741) % |
| Yes | 24 | 19 | 20 | 29 | 28 | 15 | 22 | 56 | 15 |
| No | 75 | 81 | 79 | 69 | 71 | 84 | 76 | 44 | 83 |
| Don’t know | 1 | 1 | 1 | 2 | 1 | 1 | 2 | 1 | 1 |
While the discrepancy is not as drastic as it was in 2015, Canadians with a family plan continue to experience bill shock at a higher rate than those with an individual plan (28% vs. 22%). The fact that bill shock has lowered for family plans in 2016 suggests that family plan terms and conditions may be being explained more fully to consumers by wireless providers.
| Individual plan | Family plan | |||
|---|---|---|---|---|
| 2016 (n=629) |
20153 | 2016 (n=279) |
2015 | |
| % experienced bill shock | 22% | 26% | 28% | 40% |
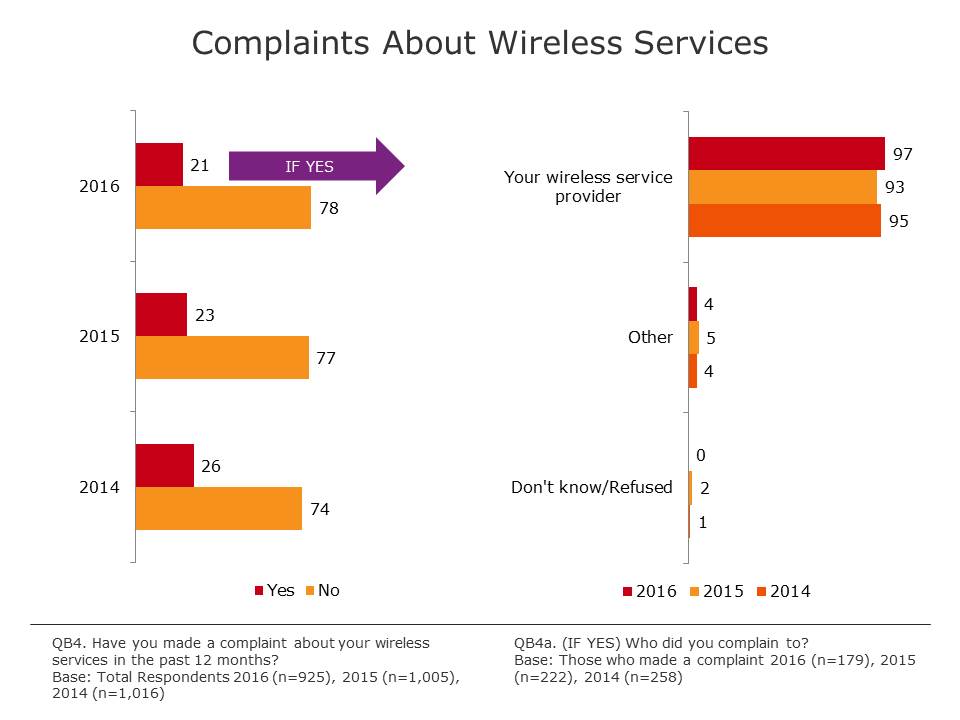
Fewer Canadians are making complaints about their wireless service provider in 2016. Nearly all complaints continue to be made directly to wireless service provider.
For the second straight year, the incidence of making a complaint about wireless services in the past 12 months has decreased. In 2014, 26 per cent of Canadians report having made a complaint about their wireless service while only 21 per cent did in 2016 (representing a decrease of 20% in complaints since 2014). This downward trend of in complaints suggests a better understanding of the contracts and the services they signed up for.
As in previous years, the vast majority of Canadians who made a complaint did so directly to their wireless provided (97%).
| Complaints about Wireless Services | Total | Gender | Age | Region | |||||||
|---|---|---|---|---|---|---|---|---|---|---|---|
| Male | Female | 18-34 | 35-54 | 55+ | Atl | Que | Ont | Pra | BC | ||
| Base=actual | (925) % |
(441) % |
(484) % |
(157) % |
(288) % |
(480) % |
(87) % |
(202) % |
(321) % |
(201) % |
(114) % |
| Yes | 21 | 25 | 18 | 25 | 20 | 18 | 25 | 15 | 25 | 20 | 20 |
| No | 78 | 75 | 81 | 74 | 79 | 81 | 73 | 85 | 74 | 79 | 80 |
| Complaints about Wireless Services | Total | Education | Language | ||||
|---|---|---|---|---|---|---|---|
| HS or less | College | Uni | English | French | Other | ||
| Base=actual | (925) % |
(223) % |
(281) % |
(407) % |
(599) % |
(205) % |
(54) % |
| Yes | 21 | 20 | 20 | 23 | 23 | 13 | 26 |
| No | 78 | 80 | 79 | 77 | 76 | 87 | 74 |
Complaints by Canadians with family plans and/or monthly/post-paid customers are down in 2016.
Complaints about wireless services as a whole are down but not significantly, since 2015 (21% vs. 23% in 2015), suggesting an overall better understanding of their plans. In particular, there is a statistically significant reductions in complaints from Canadians with a family plan (27% vs. 33%), as well as those with a monthly/post-paid plan (21% vs. 25%). Again, this would indicate that consumers on these types of plans have a better grasp of their contract than in previous years.
Interestingly, a surge of complaints have been made by prepaid/pay-as-you-go Canadians in 2016, more than double the number reported in 2015 (21% vs. 10%).
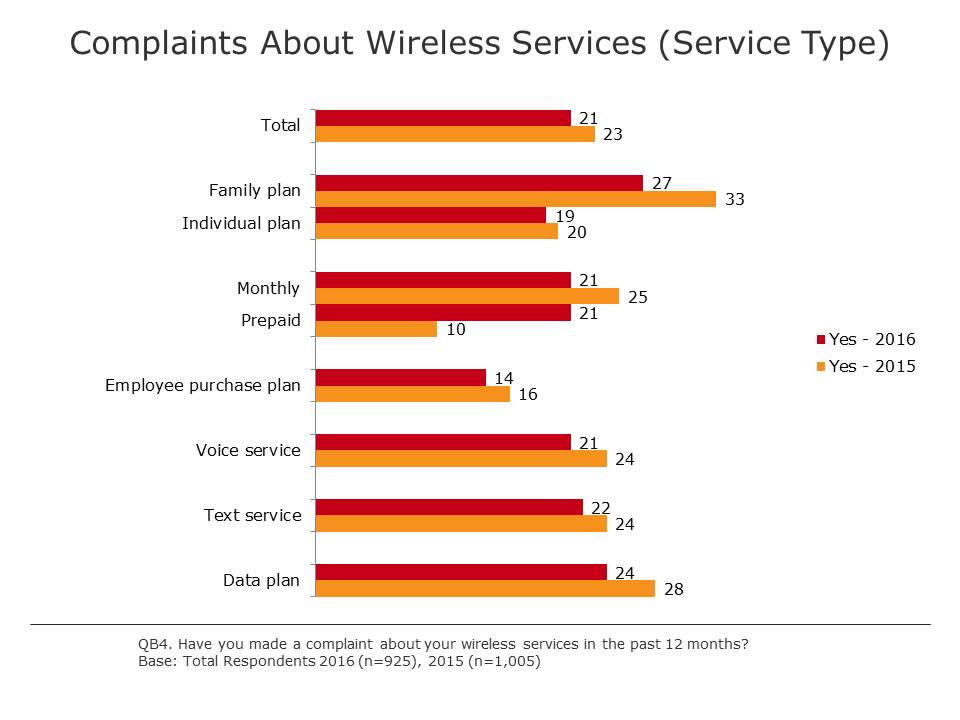
Complaints about Wireless Services by Service Type - text version
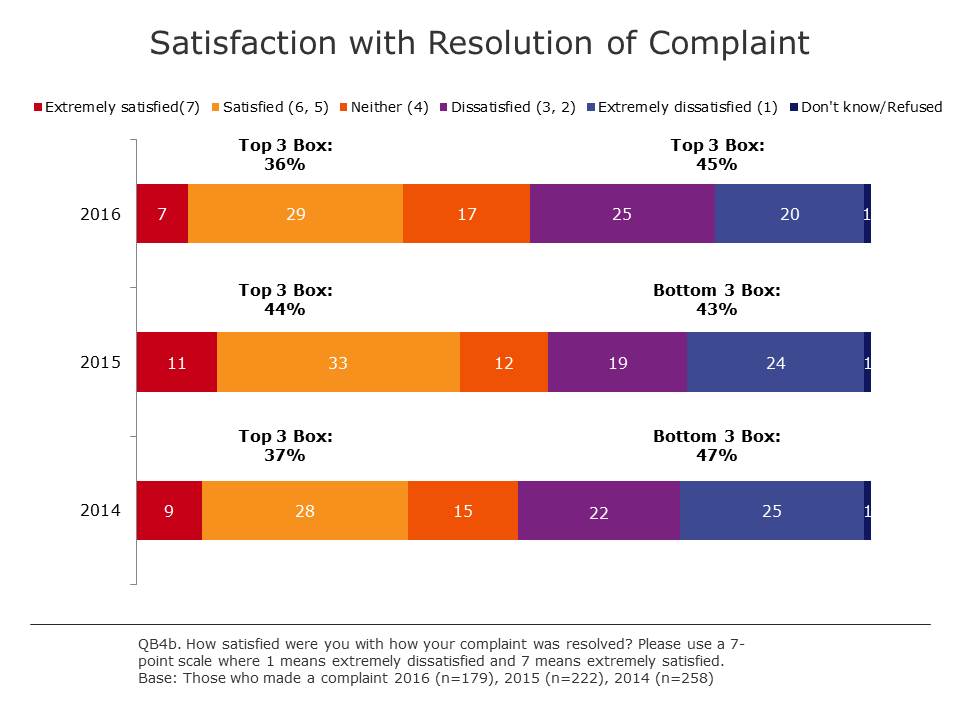
Canadians are typically dissatisfied with the resolution of their complaint.
While the incidence of making a complaint about wireless services is down since 2015 (and 2014), the level of satisfaction with the resolution of the complaint is also down, erasing the gains seen from 2014 to 2015. Furthermore, the proportion of Canadians that are dissatisfied with the resolution (1, 2, 3 rating) continues to exceed the proportion that are satisfied (5, 6, 7 rating) (45% vs. 36%)4.
These findings suggest complaint resolution continues to be problematic for Canadians. Considering nearly all complaints are made directly to a wireless service provider, these results would suggest Canadians are not happy with the way wireless providers are handling their complaints.
Demographics appear to play no role in satisfaction levels related to complaint resolution.
Canadians are generally unaware of their right to complain to the Commissioner for Complaints for Telecommunications Services (CCTS) and their awareness is decreasing.
Nearly half of all Canadians (48%) are unaware of their right to complain to the CCTS over issues related to their wireless service provider, a decrease of six per cent over last year. A mere third (33%) are vaguely aware, while less than one-in-five (17%) are fully aware of this right. Falling awareness is not unexpected as the Wireless Code is no longer new and as such it is likely getting less media attention than in the past.
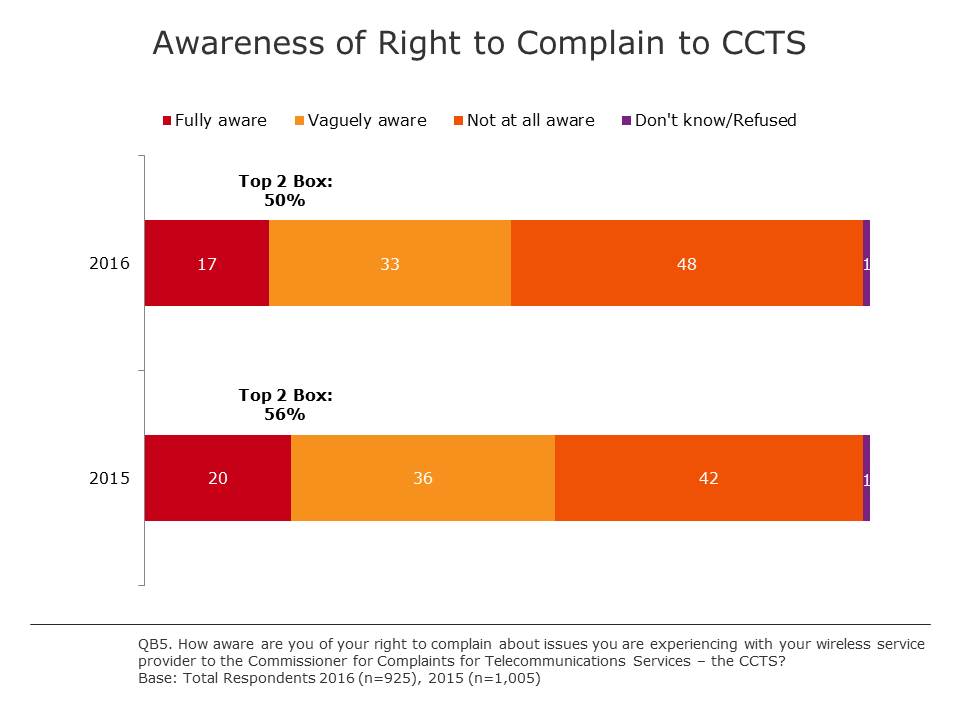
Demographics play a role in Canadians’ awareness of their right to complain to the CCTS. In particular, older Canadians (55+) are more aware of this right (63% vaguely/fully aware vs. 45% for 18-34 year olds and 46% for 35 to 54 year olds) as are those who speak either official language (52% vaguely/fully aware for Anglophones and 57% for Francophones vs. 36% for those who speak another language).
Surprisingly, awareness is lower among those who have made a complaint (61% vs 45% not at all aware) compared to those who have not.
| Awareness of Right to Complain to CCTS | Total | Gender | Age | Region | |||||||
|---|---|---|---|---|---|---|---|---|---|---|---|
| Male | Female | 18-34 | 35-54 | 55+ | Atl | Que | Ont | Pra | BC | ||
| Base=actual | (925) % |
(441) % |
(484) % |
(157) % |
(288) % |
(480) % |
(87) % |
(202) % |
(321) % |
(201) % |
(114) % |
| Fully aware | 17 | 19 | 17 | 12 | 18 | 23 | 16 | 9 | 18 | 26 | 19 |
| Vaguely aware | 33 | 35 | 32 | 33 | 28 | 40 | 33 | 41 | 31 | 27 | 36 |
| Not at all aware | 48 | 45 | 50 | 54 | 52 | 37 | 48 | 49 | 49 | 47 | 44 |
| Don’t know | 1 | 1 | 1 | 1 | 2 | 1 | 2 | 1 | 2 | 0 | 1 |
| Awareness of Right to Complain to CCTS | Total | Education | Language | Made a Complaint | |||||
|---|---|---|---|---|---|---|---|---|---|
| HS or less | College | Uni | English | French | Other | Yes | No | ||
| Base=actual | (925) % |
(223) % |
(281) % |
(407) % |
(599) % |
(205) % |
(54) % |
(179) % |
(741) % |
| Fully aware | 17 | 25 | 20 | 12 | 21 | 11 | 10 | 10 | 19 |
| Vaguely aware | 33 | 29 | 31 | 36 | 31 | 46 | 26 | 27 | 35 |
| Not at all aware | 48 | 42 | 48 | 51 | 47 | 43 | 59 | 61 | 45 |
| Don’t know | 1 | 3 | 1 | 1 | 1 | 0 | 5 | 2 | 1 |
As seen in 2015, those who are fully aware of their right to complain to CCTS are the most likely to be satisfied with their complaint resolution.
| Satisfaction with Complaint Resolution | Awareness of Right to Complain to CCTS | |||||
|---|---|---|---|---|---|---|
| Fully aware | Vaguely Aware | Not at all Aware | ||||
| 2016 (n=25) | 20155 | 2016 (n=47) | 2015 | 2016 (n=103) | 2015 | |
| Satisfied (5,6,7) | 42% | 64% | 39% | 51% | 34% | 35% |
| Neither (4) | 10% | 10% | 16% | 20% | 19% | 9% |
| Dissatisfied (1,2,3) | 48% | 26% | 48% | 27% | 44% | 56% |
One-in-five Canadians have changed wireless providers in the past two years, primarily because of a better deal with a different provider.
Consistent with findings from 2015 and 2014, one-fifth (18%) of Canadians have switched providers within the past two years.
The main reason for switching providers continues to be getting offered a better deal with a different provider which has increased each year since 2014 (55% vs. 42% in 2015 and 38% in 2014). More consumers are making a wireless provider change for a better deal and not because they are unhappy with their provider. This suggests the Wireless Code is allowing consumers to take advantage of competitive offers more frequently than in the past.
Other common reasons for switching include no longer being satisfied with their service provider (25% vs. 33% in 2015 and 30% in 2014) and needing a new phone or to upgrade their current phone (9% vs. 10% in 2015 and 14% in 2014).
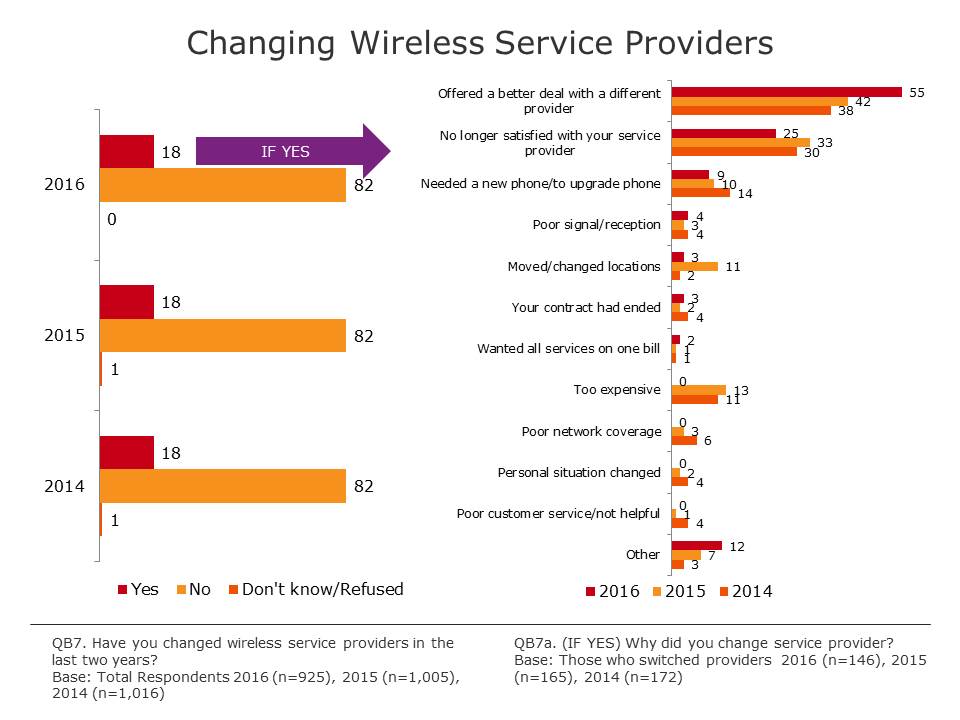
The incidence of changing wireless service providers in the past two years is significantly higher among younger Canadians aged 18 to 34 year olds (22% vs. 13% for those over 54 years old and 18% for 35 to 54 year olds). Canadians who speak a language other than English or French are twice as likely to have switched providers (33% vs. 15% for Francophones and 17% for Anglophones).
| Changing Wireless Service Providers | Total | Gender | Age | Region | |||||||
|---|---|---|---|---|---|---|---|---|---|---|---|
| Male | Female | 18-34 | 35-54 | 55+ | Atl | Que | Ont | Pra | BC | ||
| Base=actual | (925) % |
(441) % |
(484) % |
(157) % |
(288) % |
(480) % |
(87) % |
(202) % |
(321) % |
(201) % |
(114) % |
| Yes | 18 | 17 | 18 | 22 | 18 | 13 | 21 | 19 | 20 | 16 | 10 |
| No | 82 | 83 | 82 | 78 | 82 | 87 | 78 | 81 | 80 | 84 | 89 |
| Changing Wireless Service Providers | Total | Education | Language | Made a Complaint | |||||
|---|---|---|---|---|---|---|---|---|---|
| HS or less | College | Uni | English | French | Other | Yes | No | ||
| Base=actual | (925) % |
(223) % |
(281) % |
(407) % |
(599) % |
(205) % |
(54) % |
(179) % |
(741) % |
| Yes | 18 | 15 | 18 | 15 | 17 | 15 | 33 | 22 | 16 |
| No | 82 | 85 | 82 | 85 | 83 | 84 | 67 | 78 | 83 |
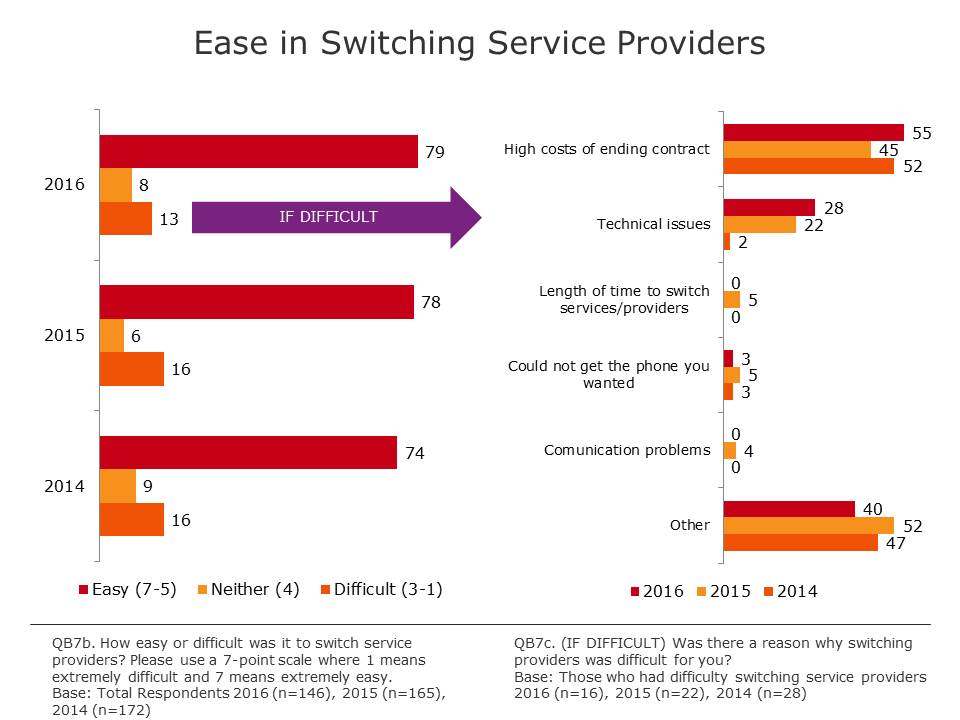
Switching service providers is generally considered to be easy. The most difficult aspect of switching is the high cost of ending a contract.
Consistent with findings from 2015 and 2014, four-out-of-five (79%) Canadians who changed providers in the past two years found the switch to be easy (score of 5,6 or 7), while about one out of eight (13%) found the switch difficult (bottom 3 box score).
Of those who found the change difficult, over half (55%) claimed that it was due to high costs of ending their contract, up 10 per cent from 2015. Just over one quarter (28% up from 22% in 2015) said technical issues were the main cause of difficulty switching providers.
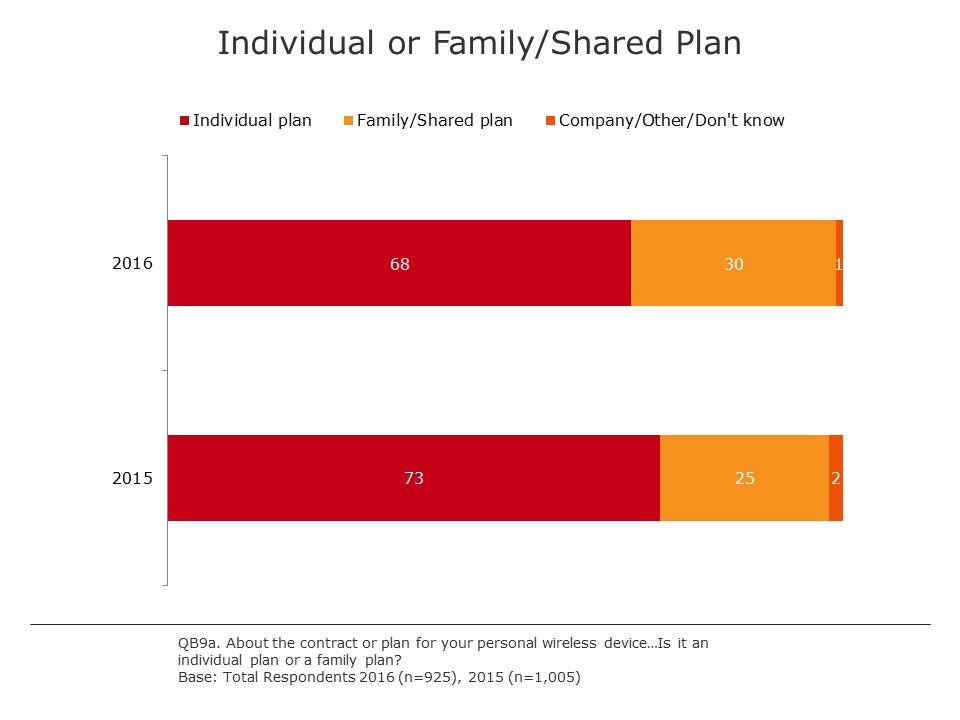
While individual plans continue to be most common, Canadians are increasingly taking advantage of a variety of competitive offers such as family and/or promotional plans through an employer or association in 2016.
Canadians are more than twice as likely to have an individual plan (68%) than a family plan (30%). The incidence of family plans is quickly increasing(up 5% from 2015) at the expense of individual plans which are in decline (down 5%). Plans through employers or associations are also on the rise up to seven percent from five in 2015.
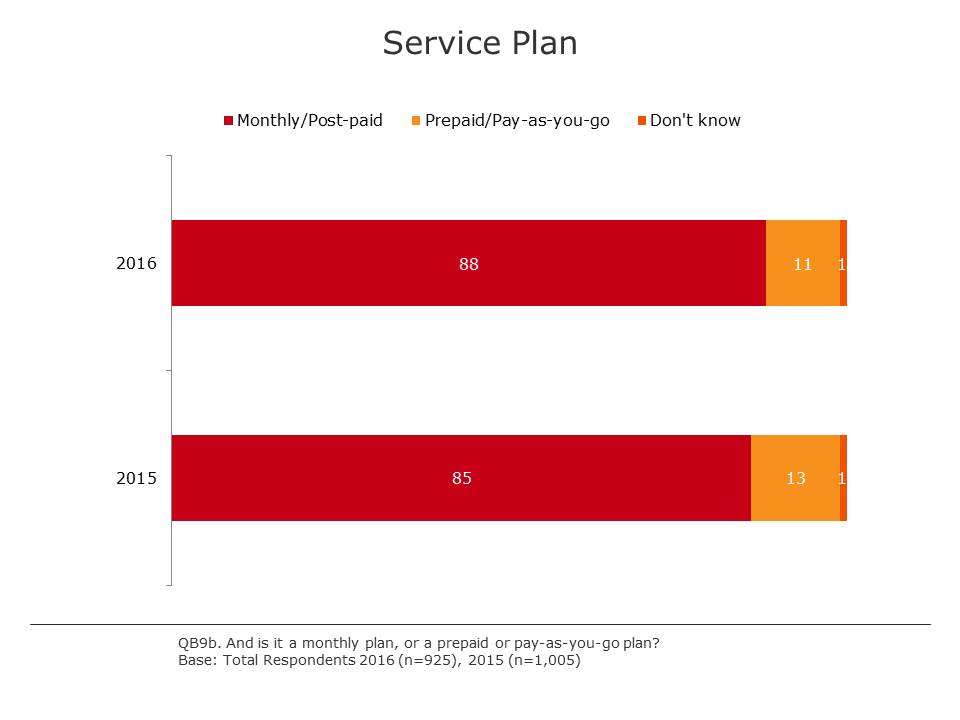
Postpaid/monthly plans (88%) continue to be far more prevalent than prepaid or pay-as-you-go plans (11%). The three main services (voice, text, and data) are included in the majority of plans however data continues to be less common than talk or text.
| Summary of Service Agreement Types | % Yes | |
|---|---|---|
| 2016 (n=925) |
2015 (n=1,005) |
|
| Individual plan | 68% | 73% |
| Family plan | 30% | 25% |
| Other | 1% | 2% |
| Postpaid/monthly | 88% | 85% |
| Prepaid/pay-as-you-go | 11% | 13% |
| % with calling | 87% | 87% |
| % with text | 91% | 90% |
| % with data | 73% | 70% |
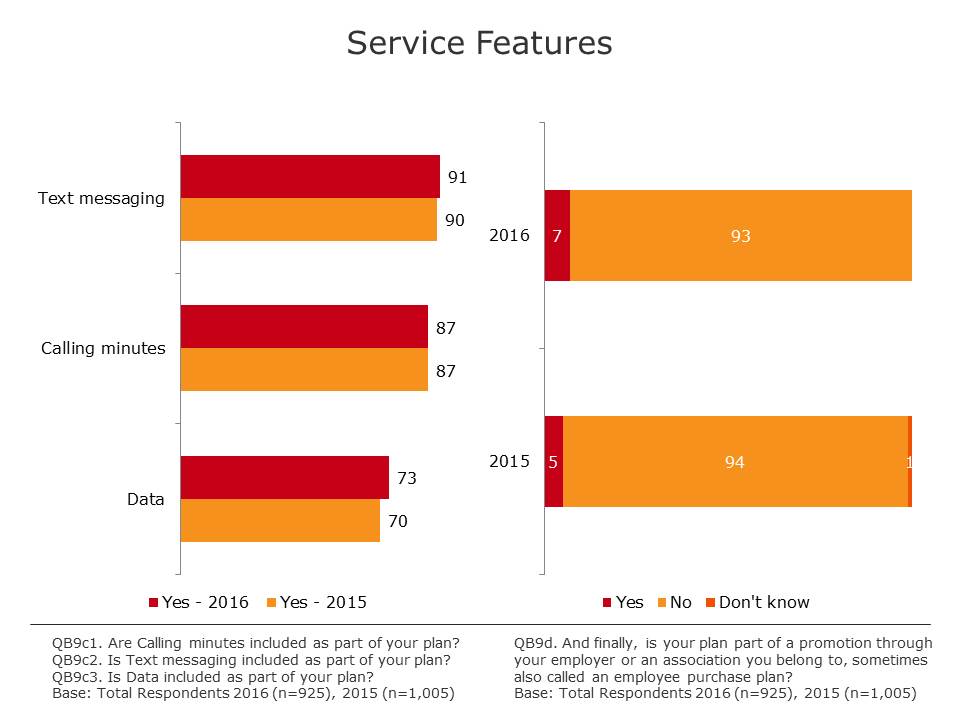
| % with employee plans | 7%6 | 5% |
Canadians are showing a stronger preference and uptake for monthly/post-paid services in 2016 than in 2015. The incidence of consumers with monthly/post-paid has increased by three percent while pre-paid/pay-as-you-go plans have declined by the same amount.
As seen in 2015, younger (18-54 years old) Canadians continue to be more likely to pay for their plan on a monthly basis compared to their older counter parts (90-92% vs 80%). Furthermore, as an individuals’ education rises, so does their propensity to have a monthly/post-paid plan. In other words, Canadians with a lower education continue to favour the pre-paid/pay-as-you-go model.
The favouring of the pre-paid/pay-as-you go model by those with lower educations could be a function of lower incomes and the desire to keep costs low.
| Service Plan Type | Total | Gender | Age | Region | |||||||
|---|---|---|---|---|---|---|---|---|---|---|---|
| Male | Female | 18-34 | 35-54 | 55+ | Atl | Que | Ont | Pra | BC | ||
| Base=actual | (925) % |
(441) % |
(484) % |
(157) % |
(288) % |
(480) % |
(87) % |
(202) % |
(321) % |
(201) % |
(114) % |
| Monthly/post-paid | 88 | 88 | 88 | 90 | 92 | 80 | 89 | 85 | 86 | 93 | 90 |
| Prepaid/ pay-as-you-go | 11 | 12 | 11 | 9 | 7 | 19 | 7 | 14 | 13 | 7 | 10 |
| Other/ don’t know | 1 | 0 | 1 | 0 | 1 | 1 | 2 | 1 | 1 | 0 | 0 |
| Service Plan Type | Total | Education | Language | Made a Complaint | |||||
|---|---|---|---|---|---|---|---|---|---|
| HS or less | College | Uni | English | French | Other | Yes | No | ||
| Base=actual | (925) % |
(223) % |
(281) % |
(407) % |
(599) % |
(205) % |
(54) % |
(179) % |
(741) % |
| Monthly/post-paid | 88 | 80 | 87 | 92 | 89 | 86 | 81 | 89 | 88 |
| Prepaid/ pay-as-you-go | 11 | 18 | 12 | 8 | 10 | 12 | 19 | 11 | 11 |
| Other/ don’t know | 1 | 2 | 1 | 0 | 1 | 2 | 0 | 0 | 1 |
Canadians are increasingly taking advantage of family/shared plans but are more likely to have made a compliant if they have a family/shared plan.
Since 2015, there has been an increase in the use of family plans (up 5%) at the expense of individual plans (down a statistically significant 5%).
Canadians aged 35-54 are more likely to have family plans (37% vs 26% for over 54 years old and 27% for 18 to 34 years old) than their younger or older counterparts. This is likely due to their increased need for a plan with multiple phones given their increased propensity to have children living at home.
Individual plans are more prevalent in Quebec and BC (80% and 78%, respectively vs. 55-66% for the rest of Canada) compared to Atlantic Canada, Ontario and the Prairies.
Anglophone Canadians are nearly twice as likely to have a family/shared plan compared to Francophones (35% vs. 19%).
Interestingly, those who made a complaint about their wireless services in the past 12 months are more likely to have a family/shared plan compared to those who did not make a complaint (38% vs. 28%). Anglophones are significantly more likely to make a complaint compared to French speaking Canadians (23% vs. 13%). This suggests that Anglophone Canadians may not fully understand the contract terms when signing up.
| Plan Type | Total | Gender | Age | Region | |||||||
|---|---|---|---|---|---|---|---|---|---|---|---|
| Male | Female | 18-34 | 35-54 | 55+ | Atl | Que | Ont | Pra | BC | ||
| Base=actual | (925) % |
(441) % |
(484) % |
(157) % |
(288) % |
(480) % |
(87) % |
(202) % |
(321) % |
(201) % |
(114) % |
| Individual | 68 | 69 | 68 | 73 | 61 | 71 | 55 | 80 | 62 | 66 | 78 |
| Family/shared plan | 30 | 30 | 31 | 27 | 37 | 26 | 42 | 20 | 37 | 33 | 21 |
| Company/other | 1 | 1 | 1 | 0 | 1 | 2 | 1 | 0 | 1 | 2 | 1 |
| Plan Type | Total | Education | Language | Made a Complaint | |||||
|---|---|---|---|---|---|---|---|---|---|
| HS or less | College | Uni | English | French | Other | Yes | No | ||
| Base=actual | (925) % |
(223) % |
(281) % |
(407) % |
(599) % |
(205) % |
(54) % |
(179) % |
(741) % |
| Individual | 68 | 71 | 69 | 66 | 64 | 80 | 77 | 61 | 70 |
| Family/shared plan | 30 | 27 | 30 | 33 | 35 | 19 | 23 | 38 | 28 |
| Company/other | 1 | 2 | 1 | 0 | 1 | 1 | 0 | 0 | 1 |
The composition of service features on wireless plans has remained relatively stable. The majority of cell phone plans include text messaging, calling minutes, and data.
Very little movement has been seen since 2015 with regard to the composition of service features on wireless plans. Text messaging (91% vs. 90% in 2015), calling minutes (87% vs. 87% in 2015), and to a somewhat lesser extent data (73% vs. 70% in 2015), are all included in the majority of cell phone plans.
Similarly, only a very small proportion of cell phone plans are part of a promotion through an employer or association (7% vs. 5% in 2015) however, some movement is being seen on this front. Slightly more (+2%7) Canadians are taking advantage of promotions offered through their employer or association than in 2015.
A large discrepancy continues to exist in the composition of services included within monthly/post-paid and prepaid/pay-as-you-go cell phone plans. For the most part, monthly/post-paid plans tend to include calling minutes, text and data while prepaid/pay-as-you-go plans are substantially less likely to have data included (79% vs 31%). The 2016 results also indicate that the “data gap” between monthly/post-paid and pre-paid is widening (+5%)8.
| Service Feature | Monthly/Post-paid | Prepaid | |||
|---|---|---|---|---|---|
| 2016 (n=792) |
20159 | 2016 (n=124) |
2015 | ||
| % with this feature | Text messaging | 94% | 93% | 70% | 67% |
| Calling minutes | 90% | 89% | 70% | 73% | |
| Data | 79% | 76% | 31% | 33% | |
Canadians are increasingly considering data “essential” in their wireless plans. Little has changed in relation to Canadians views of the importance of calling minutes or text messaging in their wireless plans, however the importance of data has increased significantly (+5%). On a similar note, significantly fewer Canadians also believe data is unimportant to their plan (-6%).
| Service Feature | % saying ‘Essential’ | % saying ‘Unimportant’ | ||
|---|---|---|---|---|
| 2016 (n=925) |
2015 (n=1,005) |
2016 (n=925) |
2015 (n=1,005) |
|
| Text messaging | 53% | 53% | 12% | 15% |
| Calling minutes | 51% | 50% | 9% | 9% |
| Data | 45% | 40% | 21% | 27% |
The perceived level of importance of a service feature certainly drives whether it is included in a wireless plan. Canadians that consider text messaging or data “essential” are significantly more likely to have the feature included in their wireless plan. Those who consider calling minutes “essential” are roughly equally likely to have or not have the feature. On the other hand, Canadians who feel text messaging, calling minutes, or data is “unimportant” are significantly less likely to have the feature included.
| Service Feature | Say Service is ‘Essential’ | Say Service is ‘Unimportant’ | ||
|---|---|---|---|---|
| Have service | Do not have service | Have service | Do not have service | |
| Text messaging | 56% | 25% | 9% | 59% |
| Calling minutes | 51% | 55% | 7% | 16% |
| Data | 57% | 13% | 7% | 59% |
Importance of Features – Text Messaging
The importance of text messaging being included in Canadians wireless plans has remained stable in 2016.
The importance of text messaging remains virtually unchanged since 2015. Four out of five (79%) consider text messaging important (a score of 5, 6, or 7) while slightly more than half consider it an “essential” service (53%) in their wireless plan.
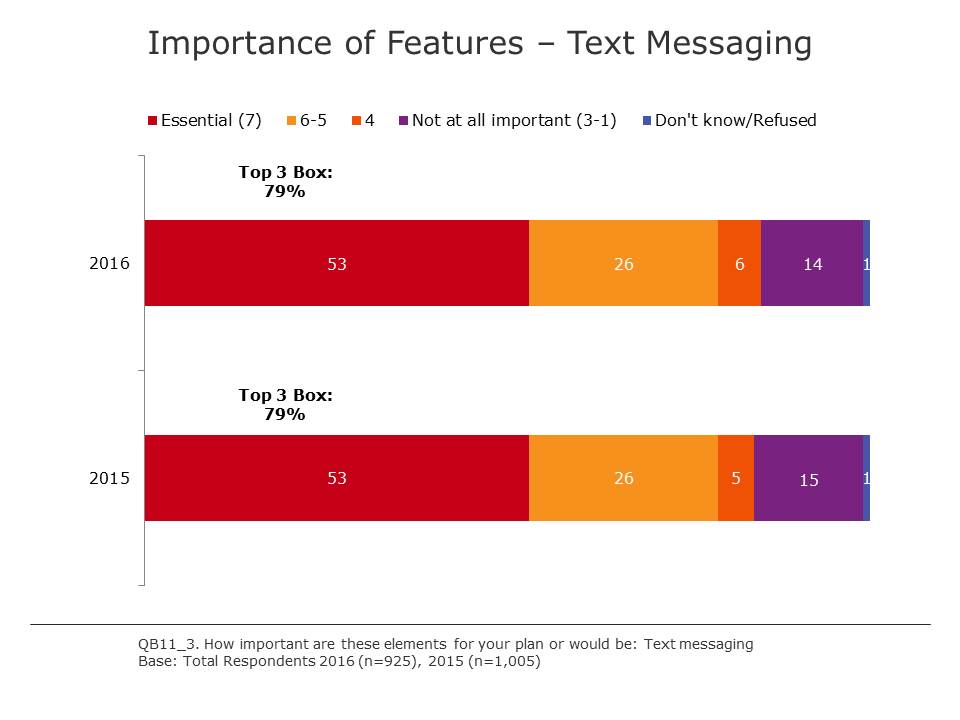
There are distinct differences between gender and age groups when it comes to the importance of text messaging as a feature in a wireless plan. Similar to last year, women are more likely than men to consider text messaging important (84% vs. 74%) or “essential” (59% vs. 46%). Not surprisingly, younger Canadians (18-54) are more likely than their older counterparts to consider text messaging important (85%-86% vs. 65%) or “essential” (57%-59% vs 41%). Furthermore, older Canadians (55+) are more than twice as likely as their younger counterparts to consider text messaging unimportant (25% vs. 8%-10%) in a wireless plan.
| Importance of Features (Text Messaging) |
Total | Gender | Age | Region | |||||||
|---|---|---|---|---|---|---|---|---|---|---|---|
| Male | Female | 18-34 | 35-54 | 55+ | Atl | Que | Ont | Pra | BC | ||
| Base=actual | (925) % |
(441) % |
(484) % |
(157) % |
(288) % |
(480) % |
(87) % |
(202) % |
(321) % |
(201) % |
(114) % |
| Essential (7) | 53 | 46 | 59 | 57 | 59 | 41 | 53 | 54 | 49 | 54 | 61 |
| Top 3 Box (5-7) | 79 | 74 | 84 | 86 | 85 | 65 | 81 | 75 | 78 | 84 | 83 |
| Bottom 3 Box (1-3) | 14 | 17 | 12 | 10 | 8 | 25 | 13 | 15 | 15 | 11 | 13 |
| Importance of Features (Text Messaging) |
Total | Education | Language | Made a Complaint | |||||
|---|---|---|---|---|---|---|---|---|---|
| HS or less | College | Uni | English | French | Other | Yes | No | ||
| Base=actual | (925) % |
(223) % |
(281) % |
(407) % |
(599) % |
(205) % |
(54) % |
(179) % |
(741) % |
| Essential (7) | 53 | 53 | 55 | 52 | 56 | 54 | 48 | 54 | 53 |
| Top 3 Box (5-7) | 79 | 75 | 85 | 78 | 82 | 76 | 76 | 84 | 78 |
| Bottom 3 Box (1-3) | 14 | 15 | 10 | 16 | 12 | 13 | 18 | 9 | 15 |
Importance of Features – Calling Minutes
The importance of calling minutes to Canadian wireless plans remains stable in 2016.
The importance of calling minutes remains the same as in 2015. Four out of five (84%) Canadians consider it an important element of their wireless plan, while half (51%) consider it essential. Few (9%) Canadians consider calling minutes unimportant (a score of 1, 2, or 3).
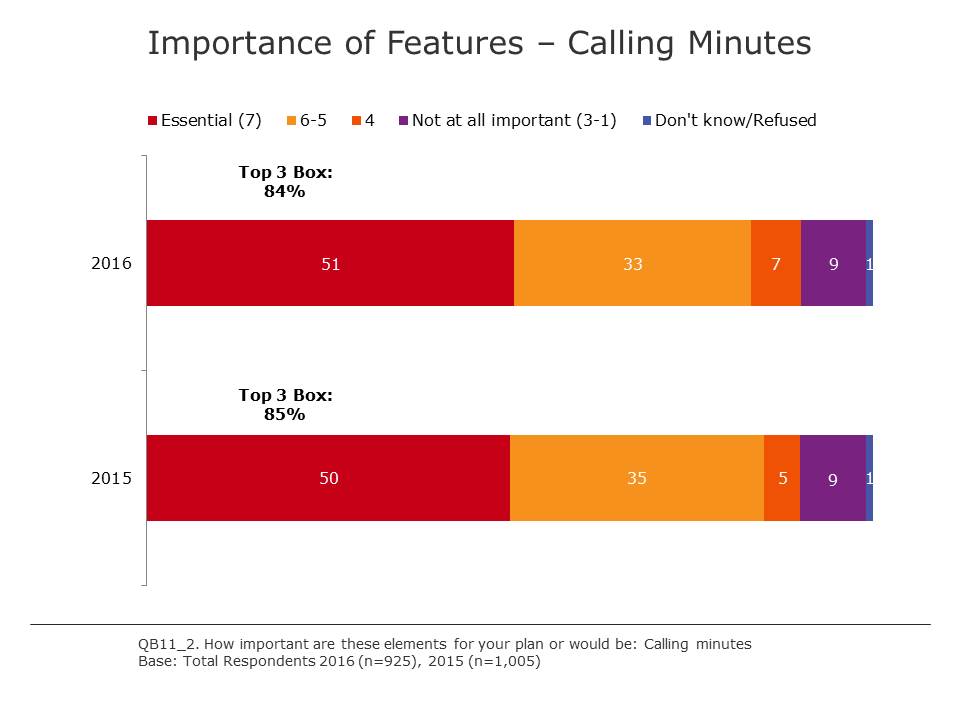
As with text messaging, women are significantly more likely than men to consider calling minutes “essential” (56% vs. 44%). Older Canadians are more likely to consider calling minutes “essential”. About half of middle age Canadians (51%) consider it “essential”, while fifty five per cent of those over 54 years feel the same.
Quebecers are significantly more likely to consider calling minutes important (88%) or “essential” (59%). Canadians with a college or university education are also more likely to consider this feature important (86% and 84%, respectively).
| Importance of Features (Calling Minutes) |
Total | Gender | Age | Region | |||||||
|---|---|---|---|---|---|---|---|---|---|---|---|
| Male | Female | 18-34 | 35-54 | 55+ | Atl | Que | Ont | Pra | BC | ||
| Base=actual | (925) % |
(441) % |
(484) % |
(157) % |
(288) % |
(480) % |
(87) % |
(202) % |
(321) % |
(201) % |
(114) % |
| Essential (7) | 51 | 44 | 56 | 45 | 51 | 55 | 50 | 59 | 46 | 51 | 51 |
| Top 3 Box (5-7) | 83 | 80 | 86 | 84 | 85 | 80 | 84 | 88 | 79 | 83 | 85 |
| Bottom 3 Box (1-3) | 9 | 9 | 8 | 6 | 7 | 13 | 10 | 5 | 12 | 5 | 10 |
| Importance of Features (Calling Minutes) |
Total | Education | Language | Made a Complaint | |||||
|---|---|---|---|---|---|---|---|---|---|
| HS or less | College | Uni | English | French | Other | Yes | No | ||
| Base=actual | (925) % |
(223) % |
(281) % |
(407) % |
(599) % |
(205) % |
(54) % |
(179) % |
(741) % |
| Essential (7) | 51 | 46 | 51 | 52 | 49 | 55 | 56 | 48 | 51 |
| Top 3 Box (5-7) | 83 | 76 | 86 | 84 | 81 | 87 | 83 | 78 | 84 |
| Bottom 3 Box (1-3) | 9 | 12 | 7 | 8 | 10 | 5 | 10 | 11 | 8 |
Importance of Features – Data
Canadians consider data to be a more important element of a wireless plan in 2016.
While still considered the least important element of a wireless plan, the importance of data to Canadians is rising. Overall, Canadians consider data to be more important in 2016 (+4%) than in 2015 and they are more likely to consider it “essential” (45% vs 40%) – both significant increases.
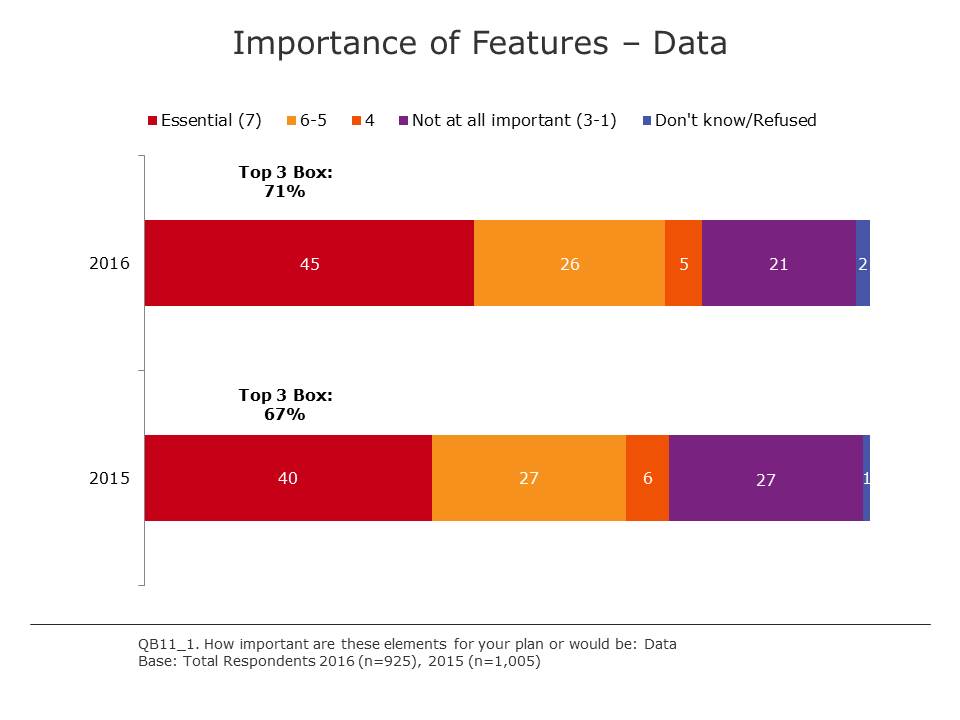
The importance of data is largely being driven by younger Canadians (<55) and women. Both cohorts are far more likely to consider data important or essential. In fact, the younger the Canadian, the more likely they are to consider data as an “essential” wireless plan feature. More specifically, those between the ages of 18 to 34 (84%) and 35 to 54 (77%) are significantly more likely to consider data important or “essential” (57% and 50%, respectively).
Interestingly, those who speak a language other than English or French are more likely to consider data “essential” (68% vs 39-46%).
Finally, Canadians who have made a complaint about their wireless service in the past 12 months are significantly more likely to consider data important (80% vs. 69%) or “essential” (55% vs. 43%) compared to those who have not made a complaint.
| Importance of Features (Data) |
Total | Gender | Age | Region | |||||||
|---|---|---|---|---|---|---|---|---|---|---|---|
| Male | Female | 18-34 | 35-54 | 55+ | Atl | Que | Ont | Pra | BC | ||
| Base=actual | (925) % |
(441) % |
(484) % |
(157) % |
(288) % |
(480) % |
(87) % |
(202) % |
(321) % |
(201) % |
(114) % |
| Essential (7) | 45 | 40 | 50 | 57 | 50 | 28 | 44 | 35 | 48 | 51 | 46 |
| Top 3 Box (5-7) | 71 | 67 | 75 | 84 | 77 | 50 | 65 | 64 | 72 | 79 | 73 |
| Bottom 3 Box (1-3) | 21 | 24 | 19 | 13 | 14 | 39 | 19 | 28 | 22 | 15 | 20 |
| Importance of Features (Data) |
Total | Education | Language | Made a Complaint | |||||
|---|---|---|---|---|---|---|---|---|---|
| HS or less | College | Uni | English | French | Other | Yes | No | ||
| Base=actual | (925) % |
(223) % |
(281) % |
(407) % |
(599) % |
(205) % |
(54) % |
(179) % |
(741) % |
| Essential (7) | 45 | 39 | 44 | 49 | 46 | 39 | 68 | 55 | 43 |
| Top 3 Box (5-7) | 71 | 63 | 70 | 76 | 72 | 62 | 80 | 80 | 69 |
| Bottom 3 Box (1-3) | 21 | 29 | 23 | 17 | 21 | 28 | 13 | 16 | 23 |
“On December 2, 2013 a Wireless Code came into effect establishing guidelines for wireless service providers. The Code ensures that wireless consumers are empowered to make informed decisions and that there is a more competitive wireless marketplace.”
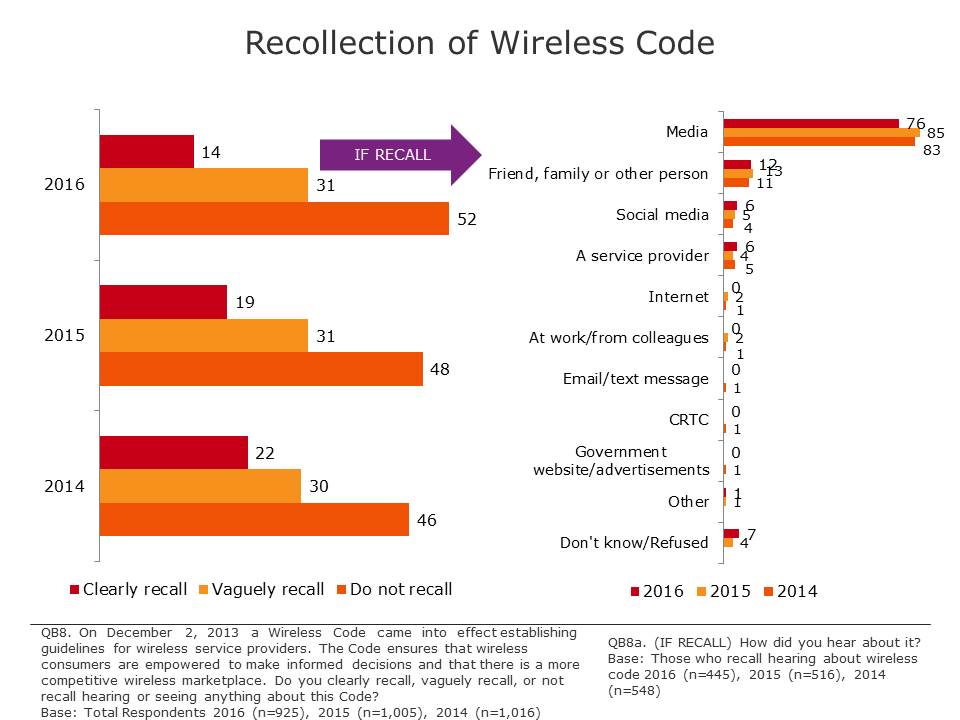
Under half of Canadians recall hearing or seeing anything about the Wireless Code, down slightly since 2014. The media is the main source of recall.
After hearing a description of the Code, less than half of Canadians (45%) claimed to fully or vaguely recall hearing or seeing anything about the Wireless Code. Perhaps not surprising, as time goes by, recall of the Wireless Code is gradually decreasing due to lack of recency in Canadians’ minds, likely a function of the decreased media attention (down 5% from 2015 and 7% from 2014).
Of the Canadians who were able to recall the Wireless Code, three quarters (76%) indicate that they heard about it from the media. Other sources of recollection include friends and family (12%), social media (6%), and their service provider (6%).
Please note: To ensure consistent tracking and comparability over time, the same methodology that was used for the Wireless Code POR in 2014 and 2015 was used by TNS Canada in 2016
A telephone survey was conducted among Canadians age 18 years and older who owned their own cell phone. Random telephone sample was used, of which 20 per cent was cell phone, while the remaining was landline sample. The survey was in field from February 3rd to February 18th, 2016. A total of 925 surveys were completed, yielding a margin of error of +/-3.2%, 19 times out of 20. Surveying was conducted in the respondents’ official language of choice and took an average of 9 minutes to complete.
To ensure a representative sample of cell phone owners in Canada, regional, age and gender quotas were also set as follows:
| Target | Quota* | Completions |
|---|---|---|
| Region | ||
| Atlantic | 100 | 87 |
| Quebec | 200 | 202 |
| Ontario | 385 | 321 |
| Prairies | 200 | 201 |
| British Columbia/Territories | 115 | 114 |
| Gender | ||
| Male | 500 | 441 |
| Female | 500 | 484 |
| Age | ||
| 18-34 | 220 | 157 |
| 35-54 | 415 | 288 |
| 55 and over | 365 | 480 |
*Due to a lower than expected incidence rate of cell phone owners not on a corporate plan, quotas were altered slightly, thus only 925 total completes were obtained.
Survey data were weighted using the 2011 Census and Statistics Canada telephone ownership statistics with regard to gender, age, region and cell phone penetration. Further details about the methodology follow.
Since this is a tracking survey and the overall objectives have not changed, the survey questionnaire was therefore not changed from the 2015 wave. CRTC provided TNS with both English and French versions of the survey. The survey took approximately 9 minutes to complete.
Since no changes were made to the questionnaire from the 2015 survey, a live pre-test was not undertaken. A soft-launch was undertaken on February 3rd, 2016 to ensure programming was working as expected. Upon completion of the soft-launch, the data was checked to ensure accuracies in skip patterns and programming. No changes were required.
A regionally stratified sample was drawn to achieve 925 completions among Canadians who own their own cell phone. The sample was regionally stratified to ensure regional quotas were met.
Both and line and cell phone sample was provided by an internal random number generator that randomizes the last four digits of the phone number based on known area code/exchange combinations. Landline respondents were screened to ensure they qualified for the study. Cell phone numbers are randomly generated with well-known cell-phone pre-fixes. The person answering the cell phone was selected for the study if they were 18 years of age or older, not driving a vehicle at the time and owned their own cell phone (not paid for by an employer).
The telephone survey was conducted using computer assisted telephone interviewing (CATI) technology. CATI ensures the interview flows as it should with pre-programmed skip patterns. It also controls responses to ensure appropriate ranges and data validity. Sample is imported directly into the survey to ensure accurate recording of sample variable such as region. The system also controls automated scheduling and call-backs to ensure all appointments are adhered to.
Surveys were conducted in English or French as chosen by the respondent. The survey was conducted from February 3rd to February 18th, 2016. In total 925 surveys were completed. The average survey length was 9 minutes.
Interviewing was conducted by fully trained interviewers and supervisors. A minimum of five per cent of all interviews were independently monitored and validated in real time.
All participants were informed of the general purpose of the research, they were informed of the sponsor and the supplier and that all of their responses would be confidential. As well, the survey was registered with the Survey Registration System
A sample of 925 drawn from the Canadian adult population would produce a margin of error of +/-3.2 per cent 19 times out of 20. Sub-groups have larger margins of error and are presented below.
| Target | Completes (Unweighted) |
Completes (Weighted) |
Margin of Error |
|---|---|---|---|
| Region | |||
| Atlantic | 87 | 64 | +/- 10.5 |
| Quebec | 202 | 203 | +/- 6.9 |
| Ontario | 321 | 361 | +/- 5.5 |
| Prairies | 201 | 168 | +/- 6.9 |
| British Columbia/Territories | 114 | 129 | +/- 9.2 |
| Gender | |||
| Male | 441 | 428 | +/- 4.7 |
| Female | 484 | 497 | +/- 4.5 |
| Age | |||
| 18-34 | 157 | 296 | +/- 7.8 |
| 35-54 | 288 | 349 | +/- 5.8 |
| 55 and over | 480 | 280 | +/- 4.5 |
Data were weighted by region, age, gender and cell phone penetration to match the cell phone owning Canadian population using 2011 Census Data. Regional cell phone penetration weights were derived from Statistics Canada data from the Residential Telephone Service Survey (RTSS) conducted in 2013. Age and gender weights were derived from 2011 Census data.
| Region | Age | Gender | Population (N) |
Population (%) |
|---|---|---|---|---|
| Atlantic | 18-34 | Male | 160,221 | 0.72 |
| Female | 270,821 | 1.22 | ||
| 35-54 | Male | 297,583 | 1.34 | |
| Female | 307,288 | 1.38 | ||
| 55+ | Male | 211,465 | 0.95 | |
| Female | 282,250 | 1.27 | ||
| Quebec | 18-34 | Male | 823,498 | 3.71 |
| Female | 819,405 | 3.69 | ||
| 35-54 | Male | 869,800 | 3.92 | |
| Female | 952,579 | 4.29 | ||
| 55+ | Male | 578,676 | 2.61 | |
| Female | 831,489 | 3.75 | ||
| Ontario | 18-34 | Male | 1,365,297 | 6.15 |
| Female | 1,343,245 | 6.05 | ||
| 35-54 | Male | 1,557,875 | 7.02 | |
| Female | 1,730,185 | 7.79 | ||
| 55+ | Male | 1,155,521 | 5.20 | |
| Female | 1,512,596 | 6.81 | ||
| Prairies | 18-34 | Male | 719,398 | 3.24% |
| Female | 715,553 | 3.22% | ||
| 35-54 | Male | 663,437 | 2.99% | |
| Female | 817,925 | 3.68% | ||
| 55+ | Male | 551,387 | 2.48% | |
| Female | 575,980 | 2.59% | ||
| BC & Territories | 18-34 | Male | 356,970 | 1.61% |
| Female | 520,962 | 2.35% | ||
| 35-54 | Male | 507,914 | 2.29% | |
| Female | 680,023 | 3.06% | ||
| 55+ | Male | 456,029 | 2.05% | |
| Female | 567,050 | 2.55% | ||
| Total Cell Owners 18 + | 22,202,420 | 100 | ||
| Region | Cell Penetration | Population (N) |
Population (%) |
|---|---|---|---|
| Atlantic | Cell Only | 326,241 | 1.47 |
| Both | 1,203,387 | 5.42 | |
| Quebec | Cell Only | 1,055,181 | 4.75 |
| Both | 3,820,266 | 17.21 | |
| Ontario | Cell Only | 2,244,904 | 10.11 |
| Both | 6,419,815 | 28.91 | |
| Prairies | Cell Only | 1,142,210 | 5.14 |
| Both | 2,901,470 | 13.07 | |
| BC & Territories | Cell Only | 935,937 | 4.22 |
| Both | 2,153,010 | 9.70 | |
| Total | 22,202,420 | 100 | |
A total of 103,067 Canadian phone numbers were dialed, of which n=925 completed the survey. The overall response rate achieved for the telephone study was 3.63%. The following table outlines the sample disposition and response rate as per the MRIA guidelines.
| TOTAL NUMBERS ATTEMPTED | 103,067 |
|---|---|
| Invalid | 66,010 |
| NIS | 63,964 |
| Fax/Modem | 1,989 |
| Business/Non-Residential | 57 |
| Unresolved (U) | 31,257 |
| Busy | 1,423 |
| No Answer | 13,011 |
| Answering Machine | 16,823 |
| Appointments | 0 |
| In-scope - non-responding (IS) | 4,453 |
| Language problem/ Illness, incapable |
340 |
| Selected respondent not available | 939 |
| Household refusal/ Respondent refusal |
2,999 |
| Qualified respondent break-off | 175 |
| In-scope - Responding units (R) | 1,347 |
| Language disqualify | 0 |
| No one 18+ | 0 |
| Other disqualify | 402 |
| Completed interviews | 925 |
| Response Rate = R/(U+IS+R) | 3.63% |
The response rate for this survey was 3.63%. The expected response rate for a telephone survey of this type with a similar field length is between three and five per cent. In order to maximize response TNS undertakes the following:
Detailed tables are included under separate cover.
Section A: Introduction and Screening
Hello/Bonjour. My name is _______________ and I am calling from TNS on behalf of the Government of Canada. We are conducting a survey with Canadians to get their attitudes and opinions towards issues of importance to Canadians. Would you prefer that I continue in English or French? Préférez-vous continuer en français ou en anglais?
Your participation in this survey is voluntary. Please be assured that your responses are confidential and will not be reported individually nor attributed to you personally. The survey will take about 7 minutes to complete. May I continue?
| Yes | CONTINUE |
|---|---|
| No, other time | SCHEDULE CALLBACK |
| No/Refused | THANK AND TERMINATE |
[IF ASKED: TNS is a professional research company hired by the Government of Canada to conduct this survey]
A1. And, just to confirm, have I reached you on a landline phone or a cell phone?
| Landline | CONTINUE to A1b |
|---|---|
| Cell phone | CONTINUE |
| Don't know/Refused | THANK AND TERMINATE |
[IF CELL PHONE AT A1] A1a. For your safety, are you currently driving?
| Yes | SCHEDULE CALLBACK |
|---|---|
| No | CONTINUE |
| Don't know/Refused | THANK AND TERMINATE |
[ASK ALL] A1b. Do you have your own cell phone, smartphone or other wireless device? In other words, a phone that is not paid for by your employer?
| YES | CONTINUE |
|---|---|
| NO | THANK AND TERMINATE |
A1c. [IF CELL PHONE AT A1] Does your household have a landline?
| Yes | 1 |
|---|---|
| No | 2 |
| DK/NR (VOLUNTEERED) | 9 |
A2. Are you or is any member of your household or immediate family employed in any of the following businesses? [READ LIST]
Market Research 1 [THANK AND TERMINATE]
Public or media relations or advertising 2 [THANK AND TERMINATE]
Any media company such as print, radio, TV 3 [THANK AND TERMINATE]
Media monitoring 4 [THANK AND TERMINATE]
Any telecommunications company 5 [THANK AND TERMINATE]
No 6 [CONTINUE]
A3. Record gender [DO NOT ASK]
| Male | 1 |
|---|---|
| Female | 2 |
A4. Can you tell me, in what year were you born?
_____________[RECORD YEAR TO CALCULATE AGE]
DK/refused
A4.1 [IF QA4 = DK/refused]
For classification purposes, could you tell me whether your age is: [READ LIST]
| between 18 and 34 | 1 |
|---|---|
| between 35 and 54 | 2 |
| or 55 or older | 3 |
[ASK ALL]
A5. Before we begin, can you please confirm that you live in [PROVINCE FROM SAMPLE]? [IF NECESSARY, INTERVIEWER SAYS:] This information will be used for classification purposes only.
| Yes | 1 |
|---|---|
| No | 2 |
A51. [IF A5=2] In which province or territory do you live?
| Alberta | 1 |
|---|---|
| British Columbia | 2 |
| Manitoba | 3 |
| New Brunswick | 4 |
| Newfoundland | 5 |
| Nova Scotia | 6 |
| Ontario | 7 |
| Prince Edward Island | 8 |
| Quebec | 9 |
| Saskatchewan | 10 |
| Yukon | 11 |
| Nunavut | 12 |
| Northwest Territories | 13 |
IF QUALIFIED (if CELL OWNER - A1B=1): Thank you, you have qualified for the survey. The questions are about your cell or wireless phone service. Specifically, the questions are about your contract or service agreement, regardless of whether you have signed a contract for a specific time period, are month-to-month or use pre-paid cards. [CONTINUE TO B1]
IF NOT QUALIFIED: Thank you very much for your time, unfortunately you are not selected to participate in this study, Have a good evening! [TERMINATE]
Section B: Wireless Code
[ASK ALL]
B1. When you signed your contract or made an agreement, did you find it clear and easy to understand? Please use a 7-point scale where 1 means extremely unclear and difficult to understand and 7 means extremely clear and easy to understand.
| 7 – Extremely clear and easy to understand | 07 |
|---|---|
| 6 | 06 |
| 5 | 05 |
| 4 | 04 |
| 3 | 03 |
| 2 | 02 |
| 1 – Extremely unclear and difficult to understand | 01 |
| DO NOT READ: Do not have a contract | 08 |
| DO NOT READ: Never read the agreement | 09 |
| DO NOT READ: Don’t Know | 99 |
B2. When you signed your contract or accepted your service agreement, how clearly did your service provider explain any fees that would apply if you cancel your contract or agreement early? Please use a 7-point scale where 1 means extremely unclear and 7 means extremely clear.
| 7 – Extremely clear | 07 |
|---|---|
| 6 | 06 |
| 5 | 05 |
| 4 | 04 |
| 3 | 03 |
| 2 | 02 |
| 1 – Extremely unclear | 01 |
| DO NOT READ: Do not have a contract | 08 |
| DO NOT READ: Never read the agreement | 09 |
| DO NOT READ: Don’t Know | 99 |
B3. Have you ever become aware that your service provider changed your plan without expressly making you aware of how the terms and conditions had changed?
| Yes | 1 |
|---|---|
| No | 2 |
| DK | 99 |
B4. Have you made a complaint about your wireless services in the past 12 months?
| Yes | 1 |
|---|---|
| No | 2 |
| DK | 99 |
B4a. [If answered “Yes” to B4] Who did you complain to? DO NOT READ LIST
| Commissioner for Complaints for Telecommunications Services (CCTS) | 1 |
|---|---|
| Canadian Radio-television and Telecommunications Commission (CRTC) | 2 |
| Your wireless service provider | 3 |
| Other [open ended] | 77 |
| DK | 99 |
B4b. [If answered “Yes” to B4] How satisfied were you with how your complaint was resolved? Please use a 7-point scale where 1 means extremely dissatisfied and 7 means extremely satisfied.
| 7 – Extremely satisfied | 07 |
|---|---|
| 6 | 06 |
| 5 | 05 |
| 4 | 04 |
| 3 | 03 |
| 2 | 02 |
| 1 – Extremely dissatisfied | 01 |
| DO NOT READ: Still in process | 08 |
| DO NOT READ: Don’t Know | 99 |
[ASK ALL]
B5. How aware are you of your right to complain about issues you are experiencing with your wireless service provider to the Commissioner for Complaints for Telecommunications Services – the CCTS? Would you say you were fully aware, vaguely aware, or not at all aware of this right?
| Fully Aware | 3 |
|---|---|
| Vaguely Aware | 2 |
| Not at all aware | 1 |
| DK | 99 |
B6. Have you experienced ‘bill shock’, meaning a surprisingly high bill, during the last year?
| Yes | 1 |
|---|---|
| No | 2 |
| DK | 99 |
B6a. [If answered “Yes” to B6] What was the main reason for the ‘bill shock’ you experienced? DO NOT READ LIST – SELECT ALL THAT APPLY
INTERVIEWER NOTE: IF RESPONDENT SAYS ‘ROAMING/ROAMING FEES, CLARIFY WHETHER THIS WAS WITHIN CANADA OR IN ANOTHER COUNTRY
| Roaming charges – Within Canada | 01 |
|---|---|
| Roaming charges – International | 02 |
| Additional / Unexpected fees (Network access fee/911, etc.) | 03 |
| Greater than expected data usage | 04 |
| Unexplained airtime / data usage | 05 |
| Unexpected set-up fee or service charge | 06 |
| Billing issues/errors/mistakes | 21 |
| Calls/minutes exceeded the limit | 22 |
| Long distance charges | 23 |
| I was not given the plan/deal I was promised | 26 |
| Other (Specify) | 77 |
| Don’t Know | 99 |
[ASK ALL]
B7. Have you changed wireless service providers in the last two years?
| Yes | 1 |
|---|---|
| No | 2 |
| DK | 99 |
B7a. [If answered “Yes” to B7] Why did you change service provider? (DO NOT READ LIST - SELECT ALL THAT APPLY)
| Your contract had ended | 1 |
|---|---|
| You were no longer satisfied with your service provider | 2 |
| Offered a better deal with a different provider | 3 |
| Needed a new phone / to upgrade phone | 4 |
| Other [open ended] | 77 |
| DK | 99 |
B7b [If answered “Yes” to B7 ] How easy or difficult was it to switch service providers? Please use a 7-point scale where 1 means extremely difficult and 7 means extremely easy.
| 7 – Extremely easy | 07 |
|---|---|
| 6 | 06 |
| 5 | 05 |
| 4 | 04 |
| 3 | 03 |
| 2 | 02 |
| 1 – Extremely difficult | 01 |
| DO NOT READ: Don’t Know | 99 |
B7c. [If answered “Somewhat/Very Difficult” to B7b (B7b = 3, 2 or 1)] Was there a reason why switching providers was difficult for you? (DO NOT READ LIST – SELECT ALL THAT APPLY)
| Technical issues | 01 |
|---|---|
| Difficulty retaining phone number | 02 |
| High costs of ending contract | 03 |
| Could not get the phone you wanted | 04 |
| Other [open ended] | 77 |
| Don’t Know | 99 |
[ASK ALL]
B8. On December 2, 2013 a Wireless Code came into effect establishing guidelines for wireless service providers. The Code ensures that wireless consumers are empowered to make informed decisions and that there is a more competitive wireless marketplace. Do you clearly recall, vaguely recall, or not recall hearing or seeing anything about this Code?
| Clearly Recall | 3 |
|---|---|
| Vaguely Recall | 2 |
| Do not recall | 1 |
| DK | 99 |
B8a. [If answered “Clearly recall or vaguely recall” to B8] how did you hear about it? (DO NOT READ – SELECT ALL THAT APPLY)
| Media (newspaper, online news, tv news, radio) | 1 |
|---|---|
| Social media (twitter, facebook) | 2 |
| Friend, family or other person | 3 |
| A service provider | 4 |
| The Commissioner for Complaints for Telecommunications Services (CCTS) | 5 |
| The Canadian Radio-television and Telecommunications Commission (CRTC) | 6 |
| Other [open ended] | 77 |
| DK | 99 |
[ASK ALL] About the contract or plan for your personal wireless device…
[Interviewer note: If say “I don’t have a plan/I have pay-as-you-go/month-to-month,” say: “this question is about your service agreement or plan, regardless of whether you have signed a contract for a specific time period, are month-to-month or use pre-paid cards.”]
B9a. Is it an individual plan or a family plan?
[Interviewer note: If unsure about the difference, say “Do you pay only for one person (which is an individual plan) or do you share a plan with your family and pay together (which is a family plan)?”]
| Individual plan | 1 |
|---|---|
| Family/shared plan | 2 |
| [DO NOT READ] Other [SPECIFY] | 77 |
| DK | 99 |
B9b. And is it a monthly plan, or a prepaid or pay-as-you-go plan?
[Interviewer note: If unsure about the difference, say “If you pay your bill after you use your wireless service, it’s a monthly or post-paid plan. If you pay before you use your wireless service, it’s a prepaid or pay-as-you-go plan.“]
| Monthly/post-paid (paying after) | 1 |
|---|---|
| Prepaid/pay-as-you-go (paying before) | 2 |
| [DO NOT READ] Other [SPECIFY] | 77 |
| DK | 99 |
B9c1. Are Calling minutes included as part of your plan? [Interviewer note: If unsure about the meaning, say “This is what you need to make or receive phone calls.”]
B9c2. Is Text messaging included as part of your plan
B9c3.Is Data included as part of your plan? [Interviewer note: If unsure about the meaning of data, say “This is what you need to browse the Internet, access applications or your emails with your wireless device.”]
| Yes | 1 |
|---|---|
| No | 2 |
| DK | 99 |
B9d. And finally, is your plan part of a promotion through your employer or an association you belong to, sometimes also called an employee purchase plan?
| Yes | 1 |
|---|---|
| No | 2 |
| DK | 99 |
B10. Of the following list, which one element or service of your contract would most upset you if changed by your service provider without you being consulted or informed first? [READ LIST, SELECT ONE ONLY]
INTERVIEWER NOTE: DO NOT READ “PRICE” – SELECT ONLY IF OFFERED UNPROMPTED/VOLUNTEERED BY RESPONDENT
| Voice calling (IF ASKED: for example, number of minutes or cost per minute) | 1 |
|---|---|
| Data plan (IF ASKED: for example, amount of data or price for data) | 2 |
| Text messaging (IF ASKED: for example, number included in the plan or cost per text) | 3 |
| Roaming fees within Canada or internationally | 4 |
| Unlocking fees | 5 |
| Commitment period or contract length | 6 |
| Some other element of your contract [If Chosen: “What would that element be?”] | 7 |
| DO NOT READ: Price | 8 |
| DK | 99 |
IF B10=8:
B10a. When you say price, is it the price of calling, of the data plan, of text messages, or of another element of your contract that would be the main issue?
| Price of Voice calling | 1 |
|---|---|
| Price of Data plan | 2 |
| Price of Text messaging | 3 |
| Price of another element | 4 |
| DO NOT READ: Price (General/Unspecified) | 7 |
| Other [SPECIFY] | 77 |
| DK | 99 |
ASK ALL
B11. Now I have a short list of elements you may have as part of your plan or that you could consider when shopping for a plan. For each, I’d like you to tell me how important they are or would be for you. Please use a 7-point scale where 1 means not at all important and 7 means essential. How about…[READ AND RANDOMIZE]
[Interviewer note: If say “I don’t have a plan/I have pay-as-you-go/month-to-month,” say: “this question is about your service agreement or plan, regardless of whether you have signed a contract for a specific time period, are month-to-month or use pre-paid cards.”
Interviewer note: If say “This is not part of my plan,” offer: “How important do you think it would be to you if it were part of your plan?”]
| 7 – Essential | 07 |
|---|---|
| 6 | 06 |
| 5 | 05 |
| 4 | 04 |
| 3 | 03 |
| 2 | 02 |
| 1 – Not at all important | 01 |
| DO NOT READ: Don’t Know | 99 |
Section D: Demographics
Thank you, we now just have a couple of other questions about you and your household. Please be assured that your responses will remain confidential.
D3. What is the highest level of formal education that you have completed? [READ IF NECESSARY - CODE ONE ONLY]
| Grade 8 or less | 1 |
|---|---|
| Some high school | 2 |
| High School diploma or equivalent | 3 |
| Registered Apprenticeship or other trades certificate or diploma | 4 |
| College, CEGEP or other non-university certificate or diploma | 5 |
| University certificate or diploma below bachelor’s level | 6 |
| Bachelor’s degree | 7 |
| Post graduate degree above bachelor’s level | 8 |
| [DO NOT READ] Prefer not to answer | 99 |
D4. What is your mother tongue, that is, the language you first learned at home? [CODE ONE ONLY]
| English | 1 |
|---|---|
| French | 2 |
| Other (SPECIFY____________) | 8 |
| DK/NR (VOLUNTEERED) | 99 |
D5. Which of the following categories best describes your total household income? That is, the total income of all persons in your household combined, before taxes? [READ - CODE ONE ONLY]
| Under $20,000 | 1 |
|---|---|
| $20,000 to just under $40,000 | 2 |
| $40,000 to just under $60,000 | 3 |
| $60,000 to just under $80,000 | 5 |
| $80,000 to just under $100,000 | 6 |
| $100,000 to just under $150,000 | 7 |
| $150,000 and above | 8 |
| [DO NOT READ] Refused | 99 |
Those are all the questions I have for you today. Thank you.
Section A : Introduction et vérification
Hello / Bonjour. Je suis _______________ de TNS et j’appelle au nom du gouvernement du Canada. Nous réalisons un sondage auprès des Canadiens pour déterminer vos attitudes et vos opinions sur les services cellulaires ou sans fil. Préférez-vous continuer en français ou en anglais? Would you prefer that I continue in English or French?
La participation à ce sondage est volontaire. Soyez assurés que vos réponses seront traitées en toute confidentialité et ne seront utilisées que de façon regroupée et anonyme. Le sondage prendra environ sept minutes. Voulez-vous continuer?
| Oui | CONTINUER |
|---|---|
| Non – pas maintenant | PRÉVOIR UN RAPPEL |
| Non – refus | REMERCIER ET METTRE FIN À L’APPEL |
[SI L’INTERLOCUTEUR LE DEMANDE : TNS est une firme de recherche professionnelle engagée par le gouvernement du Canada pour effectuer le sondage.]
A1. Pouvez-vous me dire si je vous ai rejoint sur un téléphone fixe ou un téléphone cellulaire?
| Téléphone fixe | PASSER À A1b |
|---|---|
| Téléphone cellulaire | CONTINUER |
| Ne sait pas ou refus | REMERCIER ET METTRE FIN À L’APPEL |
[Si A1 = TÉLÉPHONE CELLULAIRE] A1a. Pour assurer votre sécurité, êtes-vous au volant?
| Oui | PRÉVOIR UN RAPPEL |
|---|---|
| Non | CONTINUER |
| Ne sait pas ou refus | REMERCIER ET METTRE FIN À L’APPEL |
[POSER À TOUS]
A1B. Avez-vous votre propre téléphone cellulaire, téléphone intelligent ou autre appareil sans fil? C’est-à-dire, un téléphone qui n’est pas payé par votre employeur?
| Oui | CONTINUER |
|---|---|
| Non | REMERCIER ET METTRE FIN À L’APPEL |
A1c. [SI A1 = TÉLÉPHONE CELLULAIRE] Avez-vous une ligne téléphonique terrestre à la maison?
Oui 1
Non 2
Ne sait pas ou pas de réponse (DIT SPONTANÉMENT) 9
A2. Est-ce que vous ou un membre de votre ménage ou de votre famille immédiate travaillez dans un des domaines suivants? [LIRE LA LISTE]
Études de marché 1 [REMERCIER ET METTRE FIN À L’APPEL]
Relations publiques ou avec les médias, ou publicité 2 [REMERCIER ET METTRE FIN À L’APPEL]
Entreprise médiatique (impression, radio, télévision) 3 [REMERCIER ET METTRE FIN À L’APPEL]
Surveillance des médias 4 [REMERCIER ET METTRE FIN À L’APPEL]
Toute entreprise de télécommunications 5 [REMERCIER ET METTRE FIN À L’APPEL]
Non 6 [CONTINUER]
A3. Consigner le sexe de l’interlocuteur [NE PAS LE DEMANDER]
| Homme | 1 |
|---|---|
| Femme | 2 |
A4. Pouvez-vous m’indiquer votre année de naissance?
_____________ [CONSIGNER L’ANNÉE POUR PERMETTRE LE CALCUL DE L’ÂGE]
Ne sait pas ou refus
A4.1 [Si A4 = Ne sait pas ou refus]
Aux fins de classement, pouvez-vous m’indiquer votre tranche d’âge? [LIRE LA LISTE]
| de 18 à 34 | 1 |
|---|---|
| de 35 à 54 | 2 |
| 55 ou plus | 3 |
[POSER À TOUS]
A5. Avant de commencer, pouvez-vous confirmer que vous habitez au/en/à [PROVINCE DE L’ÉCHANTILLON]? [AU BESOIN, INDIQUER QUE : ] Ce renseignement sera utilisé uniquement aux fins de classement.
| Oui | 1 |
|---|---|
| Non | 2 |
A5.1. [Si A5=2] Dans quelle province ou quel territoire habitez-vous?
| Alberta | 1 |
|---|---|
| Colombie-Britannique | 2 |
| Manitoba | 3 |
| Nouveau-Brunswick | 4 |
| Terre-Neuve-et-Labrador | 5 |
| Nouvelle-Écosse | 6 |
| Ontario | 7 |
| Île-du-Prince-Édouard | 8 |
| Québec | 9 |
| Saskatchewan | 10 |
| Yukon | 11 |
| Nunavut | 12 |
| Territoires du Nord-Ouest | 13 |
SI ADMISSIBLE [A1B = 1] : Merci beaucoup, vous répondez aux critères du sondage. Les questions portent sur votre service cellulaire ou sans fil. Plus particulièrement, les questions sont sur votre contrat ou entente de service, qu’il s’agisse d’un contrat à durée déterminée, d’un service mensuel ou de cartes prépayées. [PASSER À B1]
[SI NON ADMISSIBLE] Merci d’avoir pris le temps de répondre à mes questions. Malheureusement, vous ne répondez pas aux critères du sondage. Bonsoir. [METTRE FIN À L’APPEL]
Section B : Code sur les services dans fil
[POSER À TOUS]
B1. Lorsque vous avez conclu un contrat ou une entente, est-ce que c’était clair et facile à comprendre? Veuillez utiliser une échelle à sept points, 1 étant pas clair du tout et difficile à comprendre et 7 étant très clair et facile à comprendre.
| 7 – Très clair et facile à comprendre | 07 |
|---|---|
| 6 | 06 |
| 5 | 05 |
| 4 | 04 |
| 3 | 03 |
| 2 | 02 |
| 1 – Pas clair du tout et difficile à comprendre | 01 |
| NE PAS LIRE : N’a pas de contrat | 08 |
| NE PAS LIRE : N’a pas lu le contrat | 09 |
| NE PAS LIRE : Ne sait pas | 99 |
B2. Lorsque vous avez signé votre contrat ou accepté votre entente de service, le fournisseur de services a-t-il expliqué clairement les frais qui s’appliquent si vous annulez prématurément le contrat ou l’entente? Veuillez utiliser une échelle à sept points, 1 étant pas clair du tout et 7 étant très clair.
| 7 – Très clair | 07 |
|---|---|
| 6 | 06 |
| 5 | 05 |
| 4 | 04 |
| 3 | 03 |
| 2 | 02 |
| 1 – Pas clair du tout | 01 |
| NE PAS LIRE : N’a pas de contrat | 08 |
| NE PAS LIRE : N’a pas lu le contrat | 09 |
| NE PAS LIRE : Ne sait pas | 99 |
B3. Vous êtes-vous déjà aperçu que votre fournisseur de service avait modifié votre forfait sans vous aviser directement des modifications apportées aux modalités?
| Oui | 1 |
|---|---|
| Non | 2 |
| Ne sait pas | 99 |
B4. Au cours des 12 derniers mois, avez-vous porté plainte au sujet de vos services sans fil?
| Oui | 1 |
|---|---|
| Non | 2 |
| Ne sait pas | 99 |
B4a. [Si B4 = Oui] Auprès de qui avez-vous déposé votre plainte? [NE PAS LIRE LA LISTE]
| Commissaire aux plaintes relatives aux services de télécommunications (CPRST) | 1 |
|---|---|
| Conseil de la radiodiffusion et des télécommunications canadiennes (CRTC) | 2 |
| Votre fournisseur de services sans fil | 3 |
| Autre [ouvert] | 77 |
| Ne sait pas | 99 |
B4b. [B4 = Oui] Êtes-vous satisfait de la manière dont votre plainte a été traitée? Veuillez utiliser une échelle à sept points, 1 étant pas du tout satisfait et 7 étant très satisfait.
| 7 – Très satisfait | 07 |
|---|---|
| 6 | 06 |
| 5 | 05 |
| 4 | 04 |
| 3 | 03 |
| 2 | 02 |
| 1 – Pas du tout satisfait | 01 |
| NE PAS LIRE : Plainte encore en cours | 08 |
| NE PAS LIRE : Ne sait pas | 99 |
[POSER À TOUS]
B5. Dans quelle mesure êtes-vous au courant que vous avez le droit de déposer une plainte au sujet de vos problèmes de services sans fil auprès du Commissaire aux plaintes relatives aux services de télécommunications (CPRST)? Diriez-vous que vous êtes parfaitement au courant, vaguement au courant ou pas du tout au courant de ce droit?
| Parfaitement au courant | 3 |
|---|---|
| Vaguement au courant | 2 |
| Pas du tout au courant | 1 |
| Ne sait pas | 99 |
B6. Au cours de la dernière année, avez-vous reçu une facture-surprise, c’est-à-dire une facture étonnamment très élevée?
| Oui | 1 |
|---|---|
| Non | 2 |
| Ne sait pas | 99 |
B6a. [Si B6 = Oui] Quelle était la principale raison des frais élevés de la facture-surprise que vous avez reçue? NE PAS LIRE LA LISTE. SÉLECTIONNER TOUTES LES RÉPONSES QUI S’APPLIQUENT.
NOTE À L’INTERVIEWEUR : SI LE RÉPONDANT INDIQUE LES FRAIS D’ITINÉRANCE, DÉTERMINER S’IL S’AGIT D’ITINÉRANCE AU CANADA OU À L’ÉTRANGER.
| Frais d’itinérance - Au Canada | 01 |
|---|---|
| Frais d’itinérance – À l’étranger | 02 |
| Autres frais non prévus (frais d’accès au réseau, service 911, etc.) | 03 |
| Utilisation de données supérieure aux attentes | 04 |
| Temps d’antenne ou utilisation de données non expliqué | 05 |
| Frais de configuration ou de service non prévus | 06 |
| Problème/erreur/faute de facturation | 21 |
| Nombre d’appels/minutes supérieurs à la limite | 22 |
| Frais interurbains | 23 |
| On ne m’a pas donné le plan/le forfait qu’on m’avait promis | 26 |
| Autre (préciser) | 77 |
| Ne sait pas | 99 |
[POSER À TOUS]
B7. Avez-vous changé de fournisseur de services sans fil au cours des deux dernières années?
| Oui | 1 |
|---|---|
| Non | 2 |
| Ne sait pas | 99 |
B7a. [Si B7 = Oui] Pourquoi avez-vous changé de fournisseur de services? [NE PAS LIRE LA LISTE. SÉLECTIONNER TOUTES LES RÉPONSES QUI S’APPLIQUENT.]
| Fin du contrat | 1 |
|---|---|
| Non satisfait du fournisseur de services | 2 |
| Un autre fournisseur a présenté une meilleure offre | 3 |
| Besoin de remplacer le téléphone | 4 |
| Autre [ouvert] | 77 |
| Ne sait pas | 99 |
B7b. [Si B7 = Oui] A-t-il été facile de changer de fournisseur de services? Veuillez utiliser une échelle à sept points, 1 étant très difficile et 7 étant très facile.
| 7 – Très facile | 07 |
|---|---|
| 6 | 06 |
| 5 | 05 |
| 4 | 04 |
| 3 | 03 |
| 2 | 02 |
| 1 – Très difficile | 01 |
| NE PAS LIRE : Ne sait pas | 99 |
B7c. [Si réponse B7b = « Quelque peu ou très difficile » (B7b =03, 02 ou 01)] Pourquoi vous a-t-il été difficile de changer de fournisseur de services? [NE PAS LIRE LA LISTE. SÉLECTIONNER TOUTES LES RÉPONSES QUI S’APPLIQUENT.]
| Problèmes techniques | 01 |
|---|---|
| Problème pour garder le numéro de téléphone | 02 |
| Coût de résiliation de contrat élevé | 03 |
| Ne pouvait obtenir le téléphone voulu | 04 |
| Autre [ouvert] | 77 |
| Ne sait pas | 99 |
[POSER À TOUS]
B8. Le 2 décembre 2013, le Code sur les services sans fil est entré en vigueur et a établi des lignes directrices à l’intention des fournisseurs de services. Ce Code aide les consommateurs à prendre des décisions éclairées et à assurer un marché des services sans fil concurrentiel. Vous rappelez-vous clairement, vaguement, ou pas du tout si vous avez entendu ou lu quelque chose au sujet de ce Code?
| S’en rappelle clairement | 3 |
|---|---|
| S’en rappelle vaguement | 2 |
| Ne s’en rappelle pas | 1 |
| Ne sait pas | 99 |
B8a. [Si réponse B8 : « S’en rappelle clairement ou vaguement »] Comment en avez-vous entendu parler? [NE PAS LIRE LA LISTE. SÉLECTIONNER TOUTES LES RÉPONSES QUI S’APPLIQUENT.]
| Médias (journaux, nouvelles en ligne, télévision, radio) | 1 |
|---|---|
| Médias sociaux (Twitter, Facebook) | 2 |
| Un ami, parent ou autre connaissance | 3 |
| Un fournisseur de services | 4 |
| Commissaire aux plaintes relatives aux services de télécommunications (CPRST) | 5 |
| Conseil de la radiodiffusion et des télécommunications canadiennes (CRTC) | 6 |
| Autre [ouvert] | 77 |
| Ne sait pas | 99 |
[POSER À TOUS] En ce qui concerne votre contrat ou votre forfait pour votre appareil sans fil personnel…
[Note à l’intervieweur : Si le répondant dit « Je n’ai pas de forfait, je paie à la carte/de mois en mois, veuillez dire : « cette question porte sur votre entente de service ou votre forfait, peu importe que vous ayez signé un contrat pour une période de temps déterminée, que vous renouveliez de mois en mois ou que vous utilisiez des cartes prépayées. »]
B9a. S’agit-il d’un forfait individuel ou d’un forfait familial?
[Note à l’intervieweur : Si le répondant est incertain de la différence, dites « Payez-vous seulement pour vous-même, ce qui est un forfait individuel, ou partagez-vous un plan avec votre famille et payez ensemble, ce qui est un forfait familial? »]
| Forfait individuel | 1 |
|---|---|
| Forfait familial/partagé | 2 |
| [NE PAS LIRE] Autre [PRÉCISER] | 77 |
| Ne sait pas | 99 |
B9b. Et s’agit-il d’un forfait mensuel ou d’un forfait prépayé ou à la carte?
[Note à l’intervieweur : Si le répondant est incertain de la différence, dites « Si vous payez votre facture après avoir utilisé votre service sans fil, c’est un forfait mensuel ou postpayé. Si vous payez avant avoir utilisé votre service, c’est un forfait prépayé ou à la carte. »]
| Mensuel/postpayé (paye après) | 1 |
|---|---|
| Prépayé/à la carte (paye avant) | 2 |
| [NE PAS LIRE] Autre [PRÉCISER] | 77 |
| Ne sait pas | 99 |
B9c1, Est-ce que des minutes pour appeler sont incluses dans votre forfait? [Note à l’intervieweur : Si nécessaire, clarifier en disant « C’est ce dont vous avez besoin pour faire ou recevoir des appels vocaux. »]
B9c2. Et, est-ce que votre forfait comprend des messages texte?
B9c3. Est-ce que votre forfait inclut des données? [Note à l’intervieweur : Si nécessaire, clarifier en disant « C’est ce dont vous avez besoin pour aller sur Internet, utiliser des applications ou vérifier vos courriels avec votre appareil sans fil. »]
| Oui | 1 |
|---|---|
| Non | 2 |
| Ne sait pas | 99 |
B9d. Et finalement, votre forfait est-il offert dans le cadre d’une promotion de votre employeur ou d’une association dont vous êtes membre, ce qu’on désigne souvent sous le nom de programme d’achat des employés?
| Oui | 1 |
|---|---|
| Non | 2 |
| Ne sait pas | 99 |
B10. Dans la liste suivante, quel est l’élément ou le service de votre contrat qui vous fâcherait le plus si votre fournisseur de service le changeait sans d’abord vous en informer ou vous consulter? [LIRE LA LISTE, SÉLECTIONNER SEULEMENT UNE RÉPONSE.]
[NOTE À L’INTERVIEWER : NE PAS LIRE « PRIX » - SÉLECTIONNER SEULEMENT SI DIT SPONTANÉMENT PAR LE RÉPONDANT]
| Les appels vocaux (SI DEMANDÉ : par exemple, le nombre de minutes ou le coût par minute) | 1 |
|---|---|
| Vos données (SI DEMANDÉ : par exemple, la quantité de données ou le coût des données) | 2 |
| Les messages texte (SI DEMANDÉ : par exemple, le nombre de messages texte inclus dans le plan ou le coût par message texte) | 3 |
| Les frais d’itinérance au Canada ou à l’étranger | 4 |
| Les frais de déverrouillage | 5 |
| La période d’engagement/durée du contrat | 6 |
| Un autre élément de votre contrat [Si choisi : « Quel serait cet élément? »] | 7 |
| NE PAS LIRE : Prix | 8 |
| Ne sait pas | 9 |
SI B10=8:
B10a. Quand vous dites prix, est-ce que c’est le prix des appels, des données, des messages texte ou d’un autre élément de votre contrat qui vous dérangerait le plus?
| Prix des appels vocaux | 1 |
|---|---|
| Prix des données | 2 |
| Prix des messages texte | 3 |
| Prix d’un autre élément | 4 |
| NE PAS LIRE : Prix (Général/Non spécifié) | 7 |
| Autre [PRÉCISER] | 77 |
| Ne sait pas | 99 |
[POSER À TOUS]
B11. J’ai maintenant une courte liste d’éléments que vous avez peut-être dans votre forfait ou que vous pourriez prendre en considération lorsque vous magasinez pour un forfait. Veuillez me dire dans quelle mesure chacun de ces éléments est important ou serait important pour vous. Veuillez utiliser une échelle à sept points, 1 étant pas du tout important et 7 étant essentiel. Qu’en est-il… [LIRE ET PRÉSENTER DE FAÇON ALÉATOIRE]
[Note à l’intervieweur : Si le répondant dit « Je n’ai pas de forfait, je paie à la carte/de mois en mois, veuillez dire : « cette question porte sur votre entente de service ou votre forfait, peu importe que vous ayez signé un contrat pour une période de temps déterminée, que vous renouveliez de mois en mois ou que vous utilisiez des cartes prépayées. »]
Note à l’intervieweur : Si le répondant dit « Ceci n’est pas inclus dans mon forfait », veuillez répondre : « À votre avis, dans quelle mesure serait-il important pour vous que ce soit inclus dans votre forfait? »]
| 7 – Essentiel | 07 |
|---|---|
| 6 | 06 |
| 5 | 05 |
| 4 | 04 |
| 3 | 03 |
| 2 | 02 |
| 1 – Pas du tout important | 01 |
| NE PAS LIRE : Ne sait pas | 99 |
Section D : Renseignements démographiques
Merci beaucoup. Voici quelques dernières questions à votre sujet et au sujet de votre ménage. Soyez assuré que vos réponses demeureront confidentielles.
D3. Quel niveau de scolarité avez-vous atteint? [LIRE LA LISTE AU BESOIN – N’INSCRIRE QU’UNE RÉPONSE]
| École primaire | 1 |
|---|---|
| Secondaire, sans obtenir de diplôme | 2 |
| Diplôme d’études secondaires ou l’équivalent | 3 |
| Permis d’apprentissage ou autre diplôme ou certificat de métier manuel | 4 |
| Collège, CÉGEP ou autre certificat ou diplôme non universitaire | 5 |
| Diplôme ou certificat universitaire inférieur au baccalauréat | 6 |
| Baccalauréat | 7 |
| Diplôme d’études supérieures | 8 |
| [NE PAS LIRE] Préfère ne pas répondre | 99 |
D4. Quelle est votre langue maternelle, c’est-à-dire la première langue que vous avez apprise à la maison? [Inscrire une seule réponse]
| Anglais | 1 |
|---|---|
| Français | 2 |
| Autre (PRÉCISER : ____________) | 8 |
| Ne sait pas ou pas de réponse | 99 |
D5. Le revenu total de votre ménage appartient à laquelle des catégories suivantes? Il s’agit du revenu combiné de tous les membres de votre ménage, avant les impôts. [LIRE LA LISTE – INSCRIRE UNE SEULE RÉPONSE]
| Moins de 20 000 $ | 1 |
|---|---|
| de 20 000 $ à moins de 40 000 $ | 2 |
| de 40 000 $ à moins de 60 000 $ | 3 |
| de 60 000 $ à moins de 80 000 $ | 4 |
| de 80 000 $ à moins de 100 000 $ | 5 |
| de 100 000 $ à moins de 150 000 $ | 6 |
| 150 000 $ ou plus | 7 |
| [NE PAS LIRE] Refusé | 99 |
Je n’ai plus d’autres questions pour vous. Je vous remercie de votre collaboration et du temps que vous nous avez accordé. Bonne journée!